Conversation statistics provide a clear overview of how your team interacts with customers in chats. You can see reply times, customer ratings, and which communication channels are used most. These insights help balance workloads and improve service quality.
Bitrix24 plans and pricing
In this article:
- Access conversation statistics
- Use built-in reports
- Set a reporting period
- Create a report
- Customize a report
- Adjust report appearance
- Restore default settings
- Delete a report
Access conversation statistics
Bitrix24 administrators or employees with access to conversation statistics can view these reports. You can manage permissions in the Open Channel settings.
Access permissions to Open Channels
To open conversation statistics:
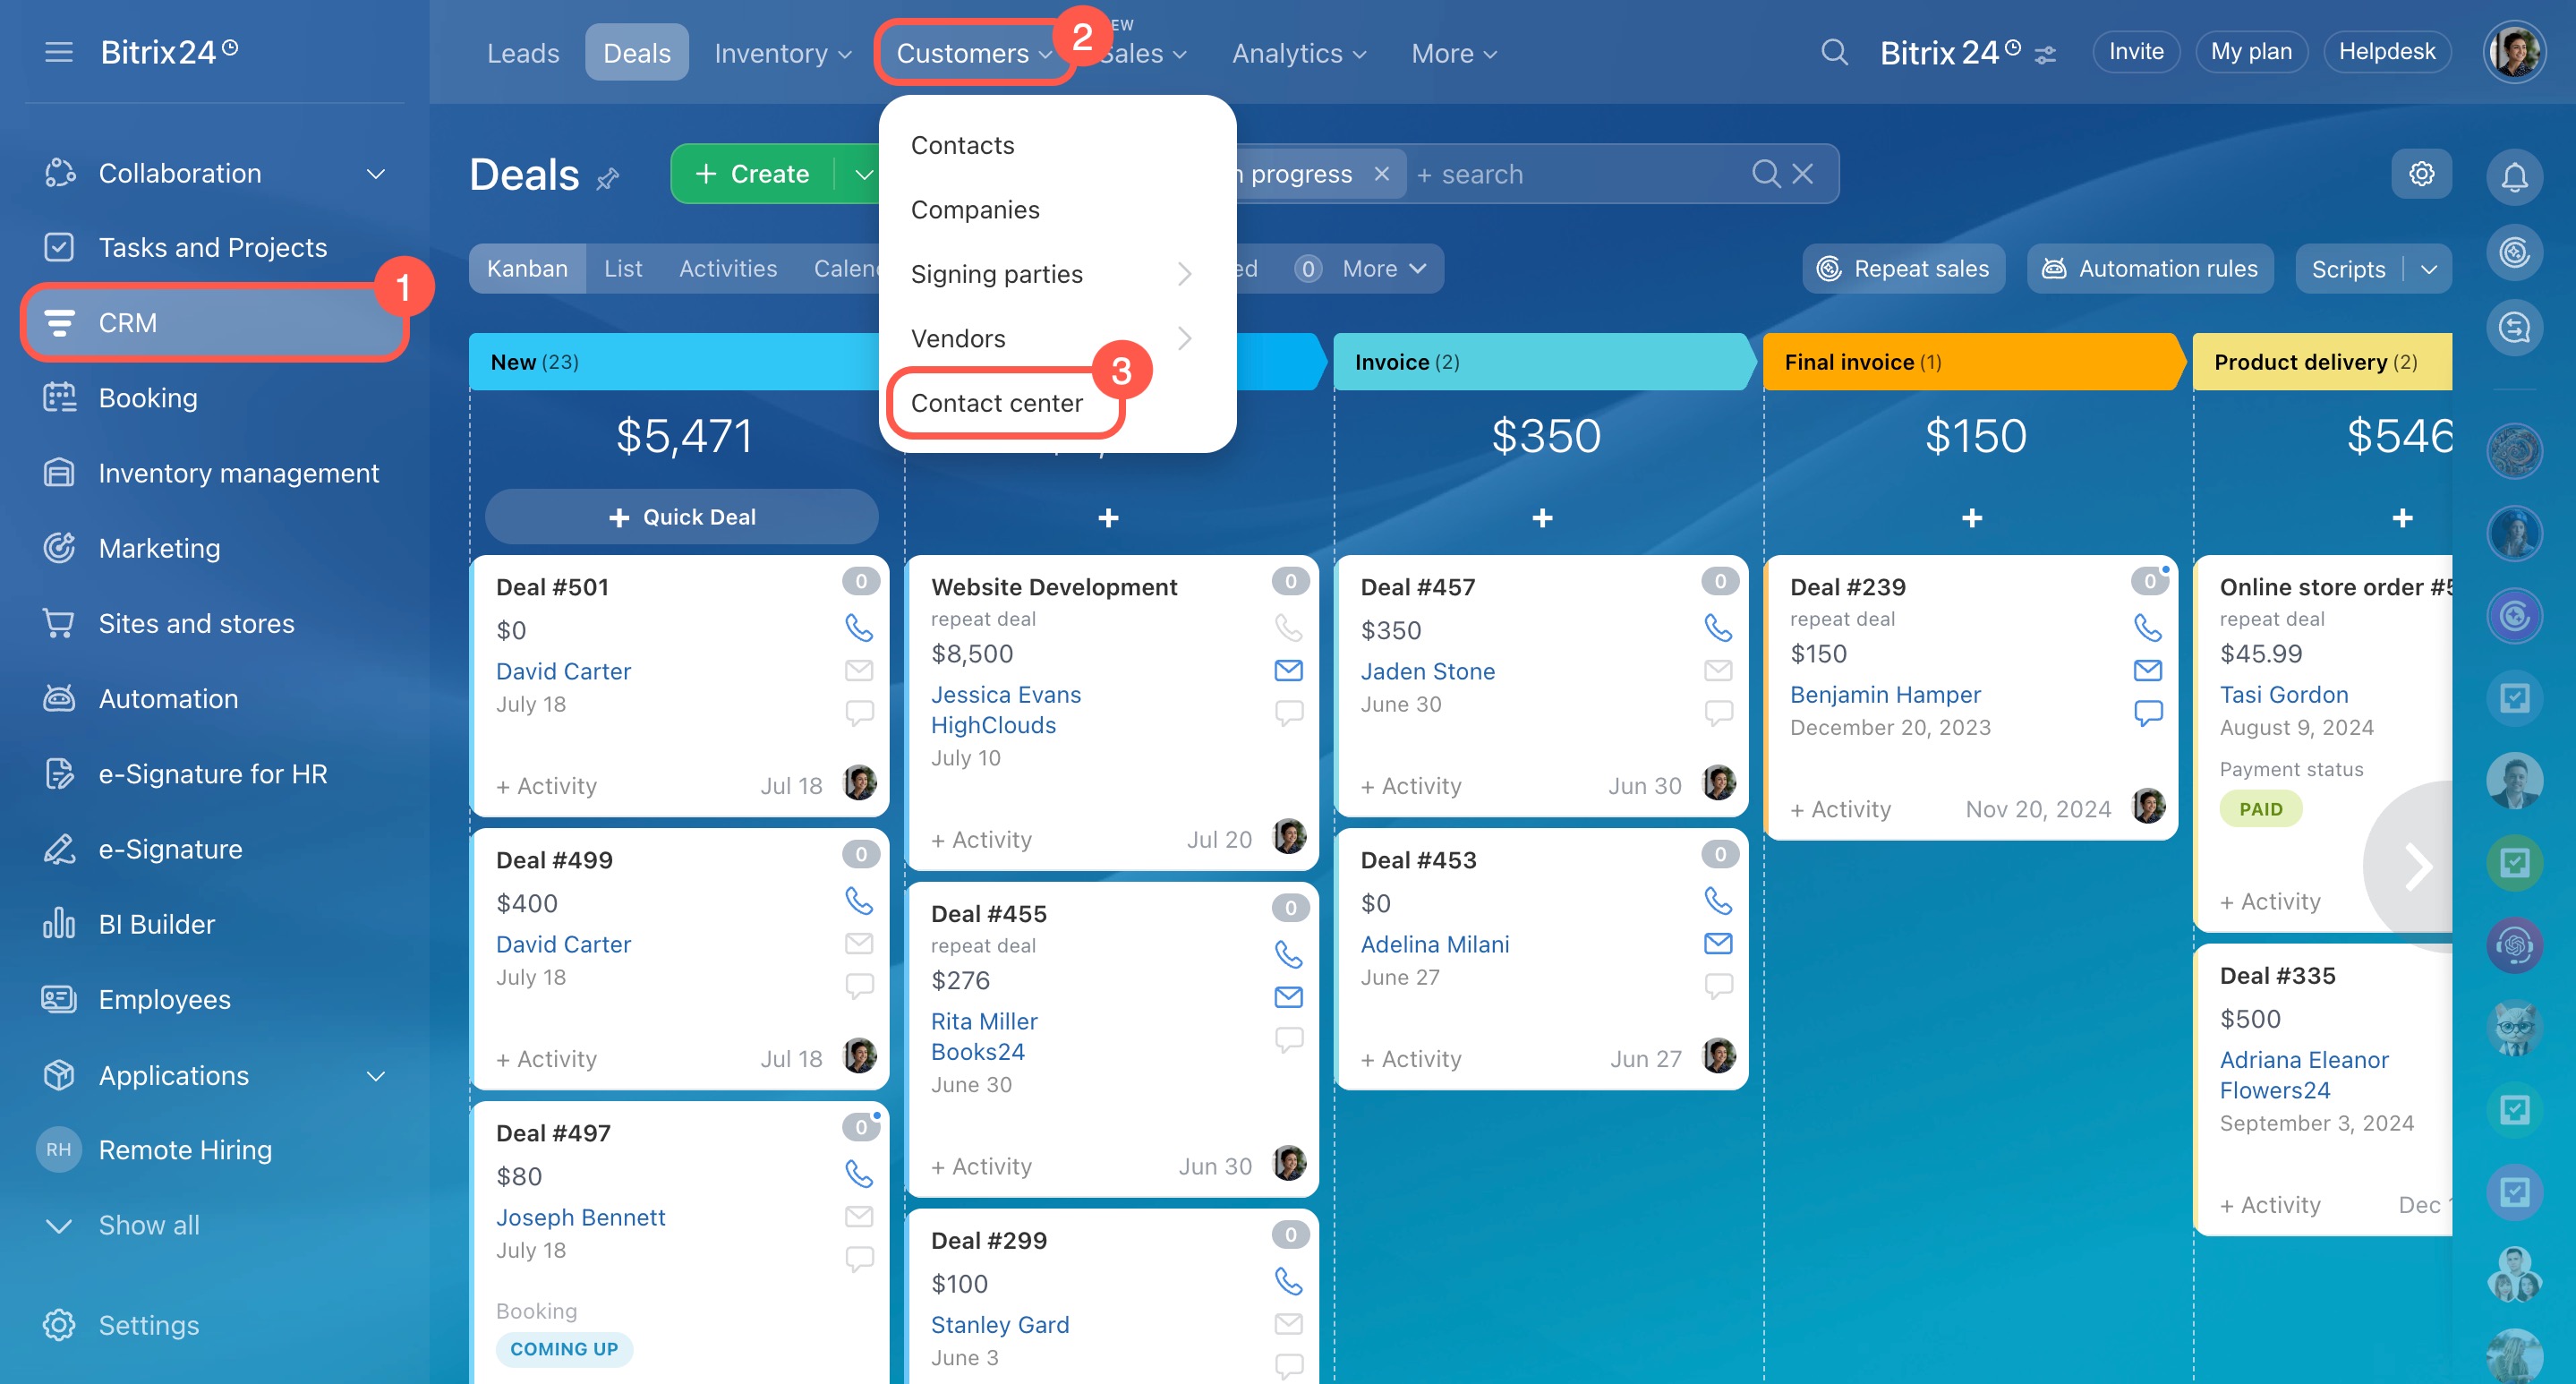
- Go to CRM.
- Expand Customers.
- Select Contact center.
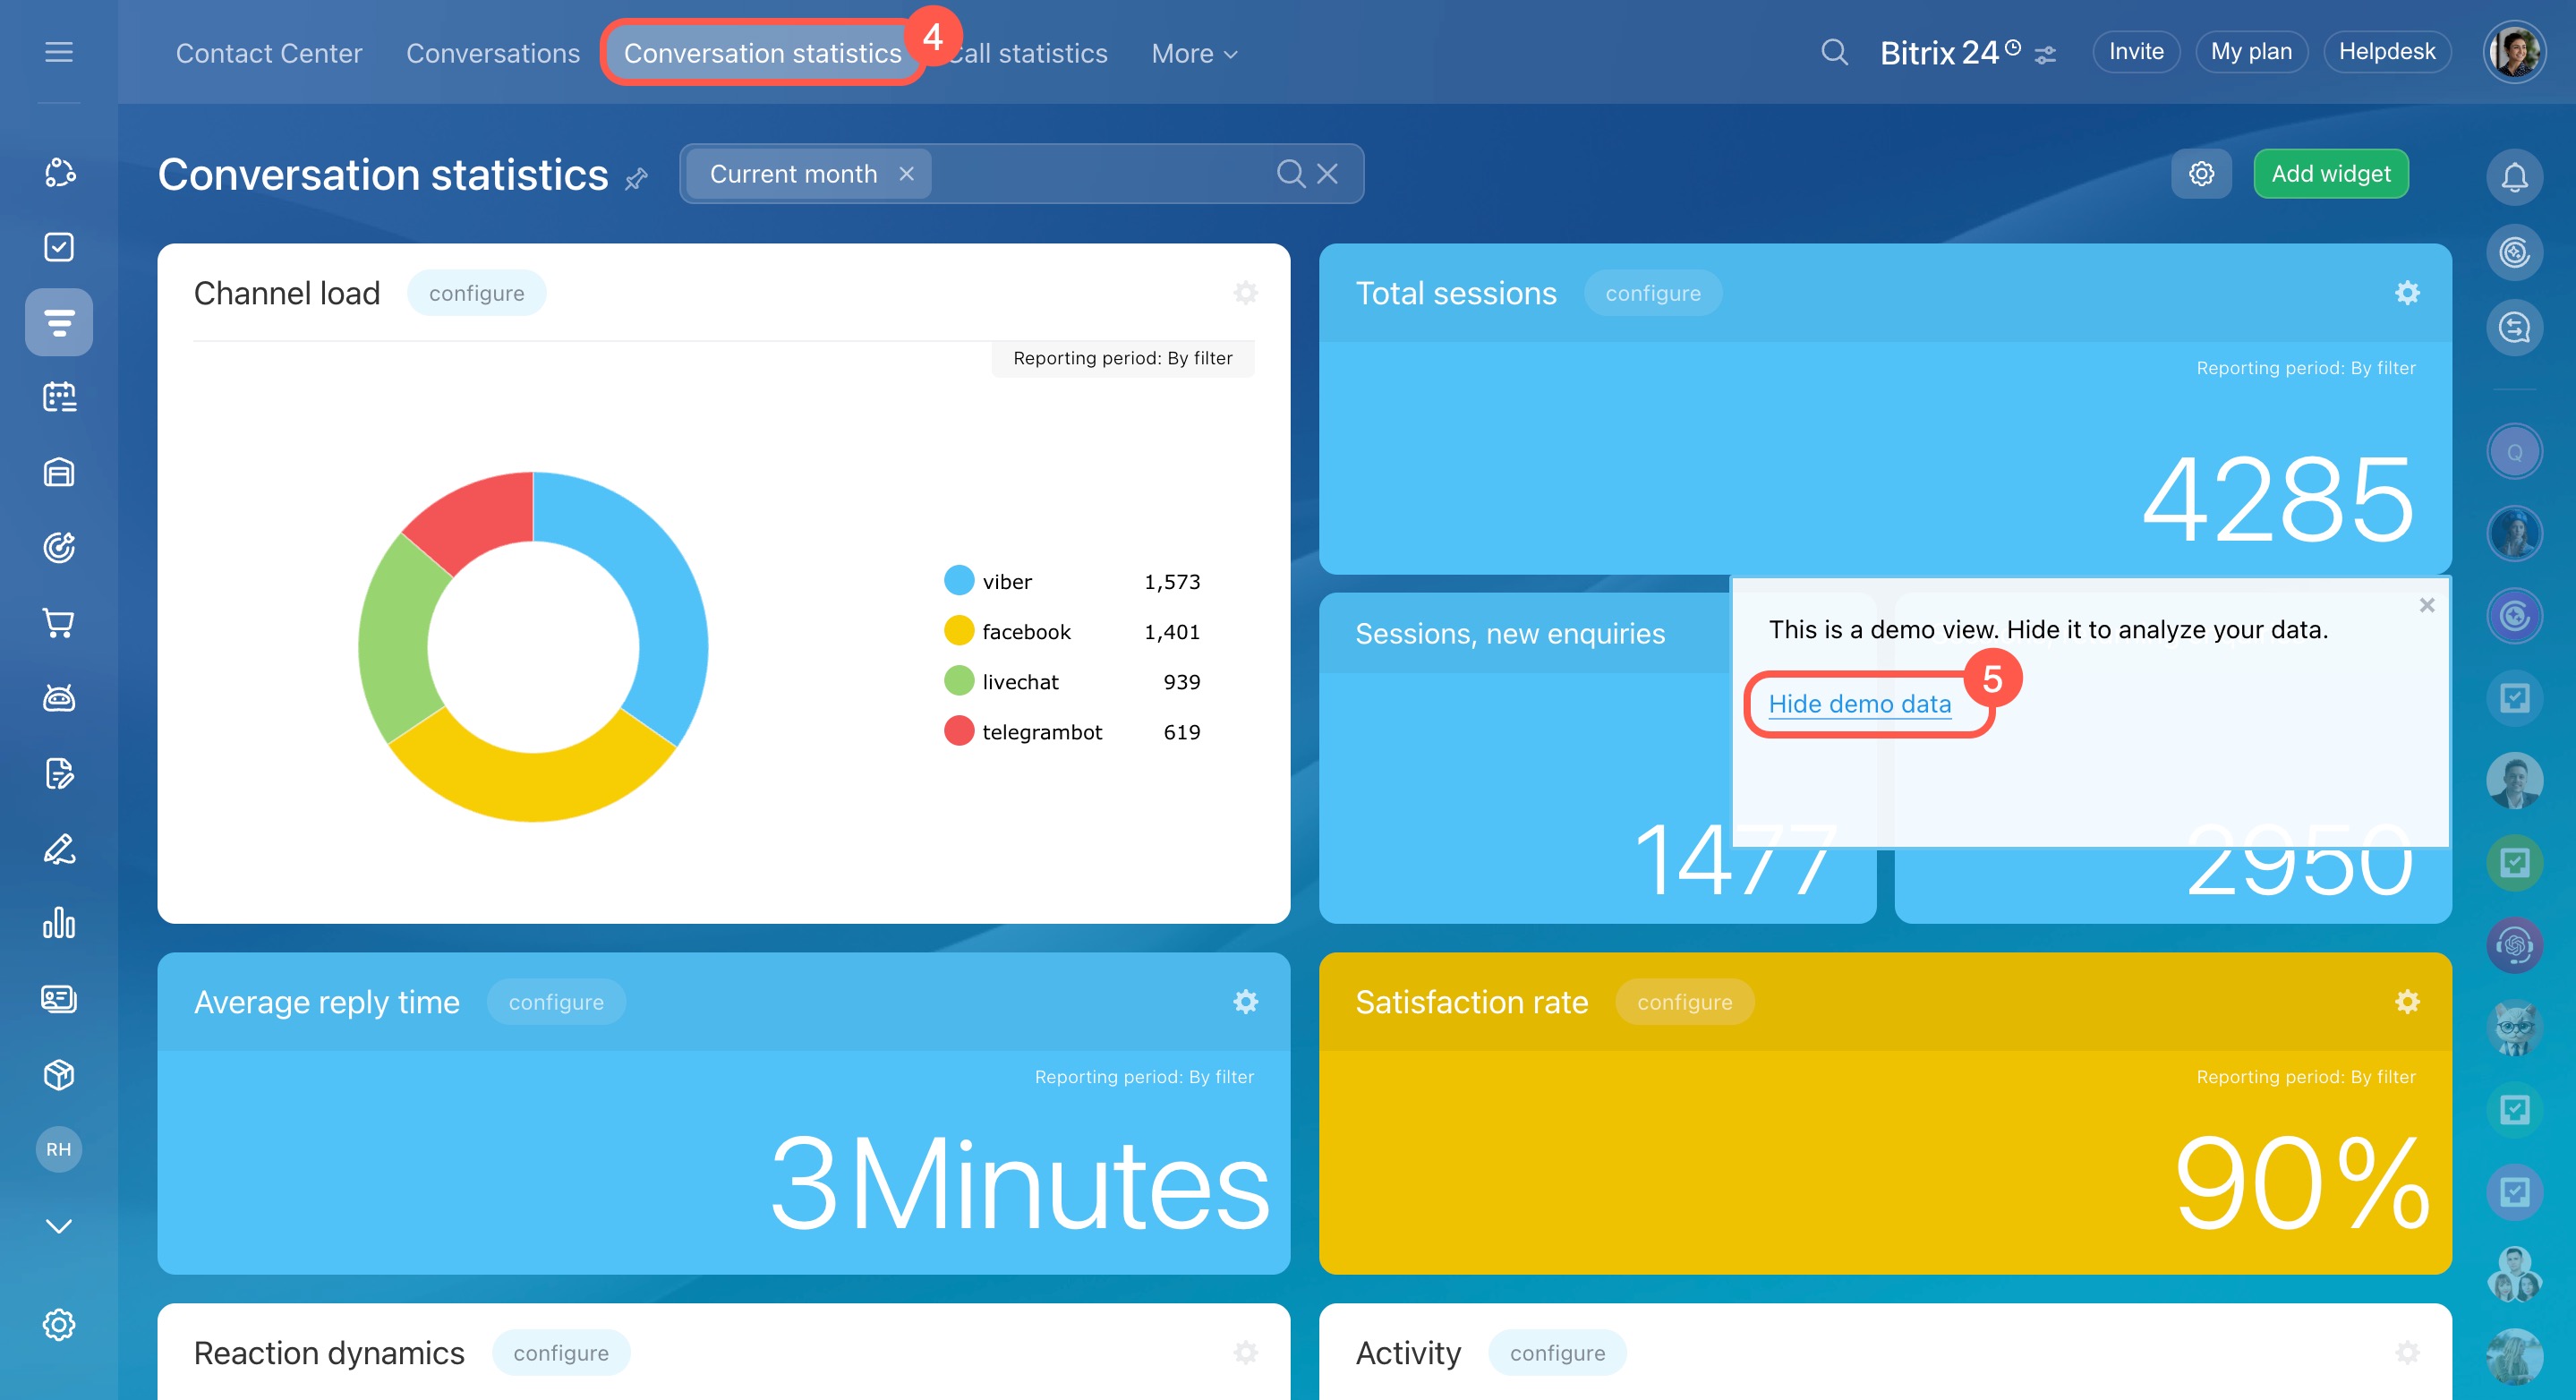
- Open the Conversation statistics tab.
- The first time you open the page, demo data will be shown. Click Hide demo data to see your actual account statistics.
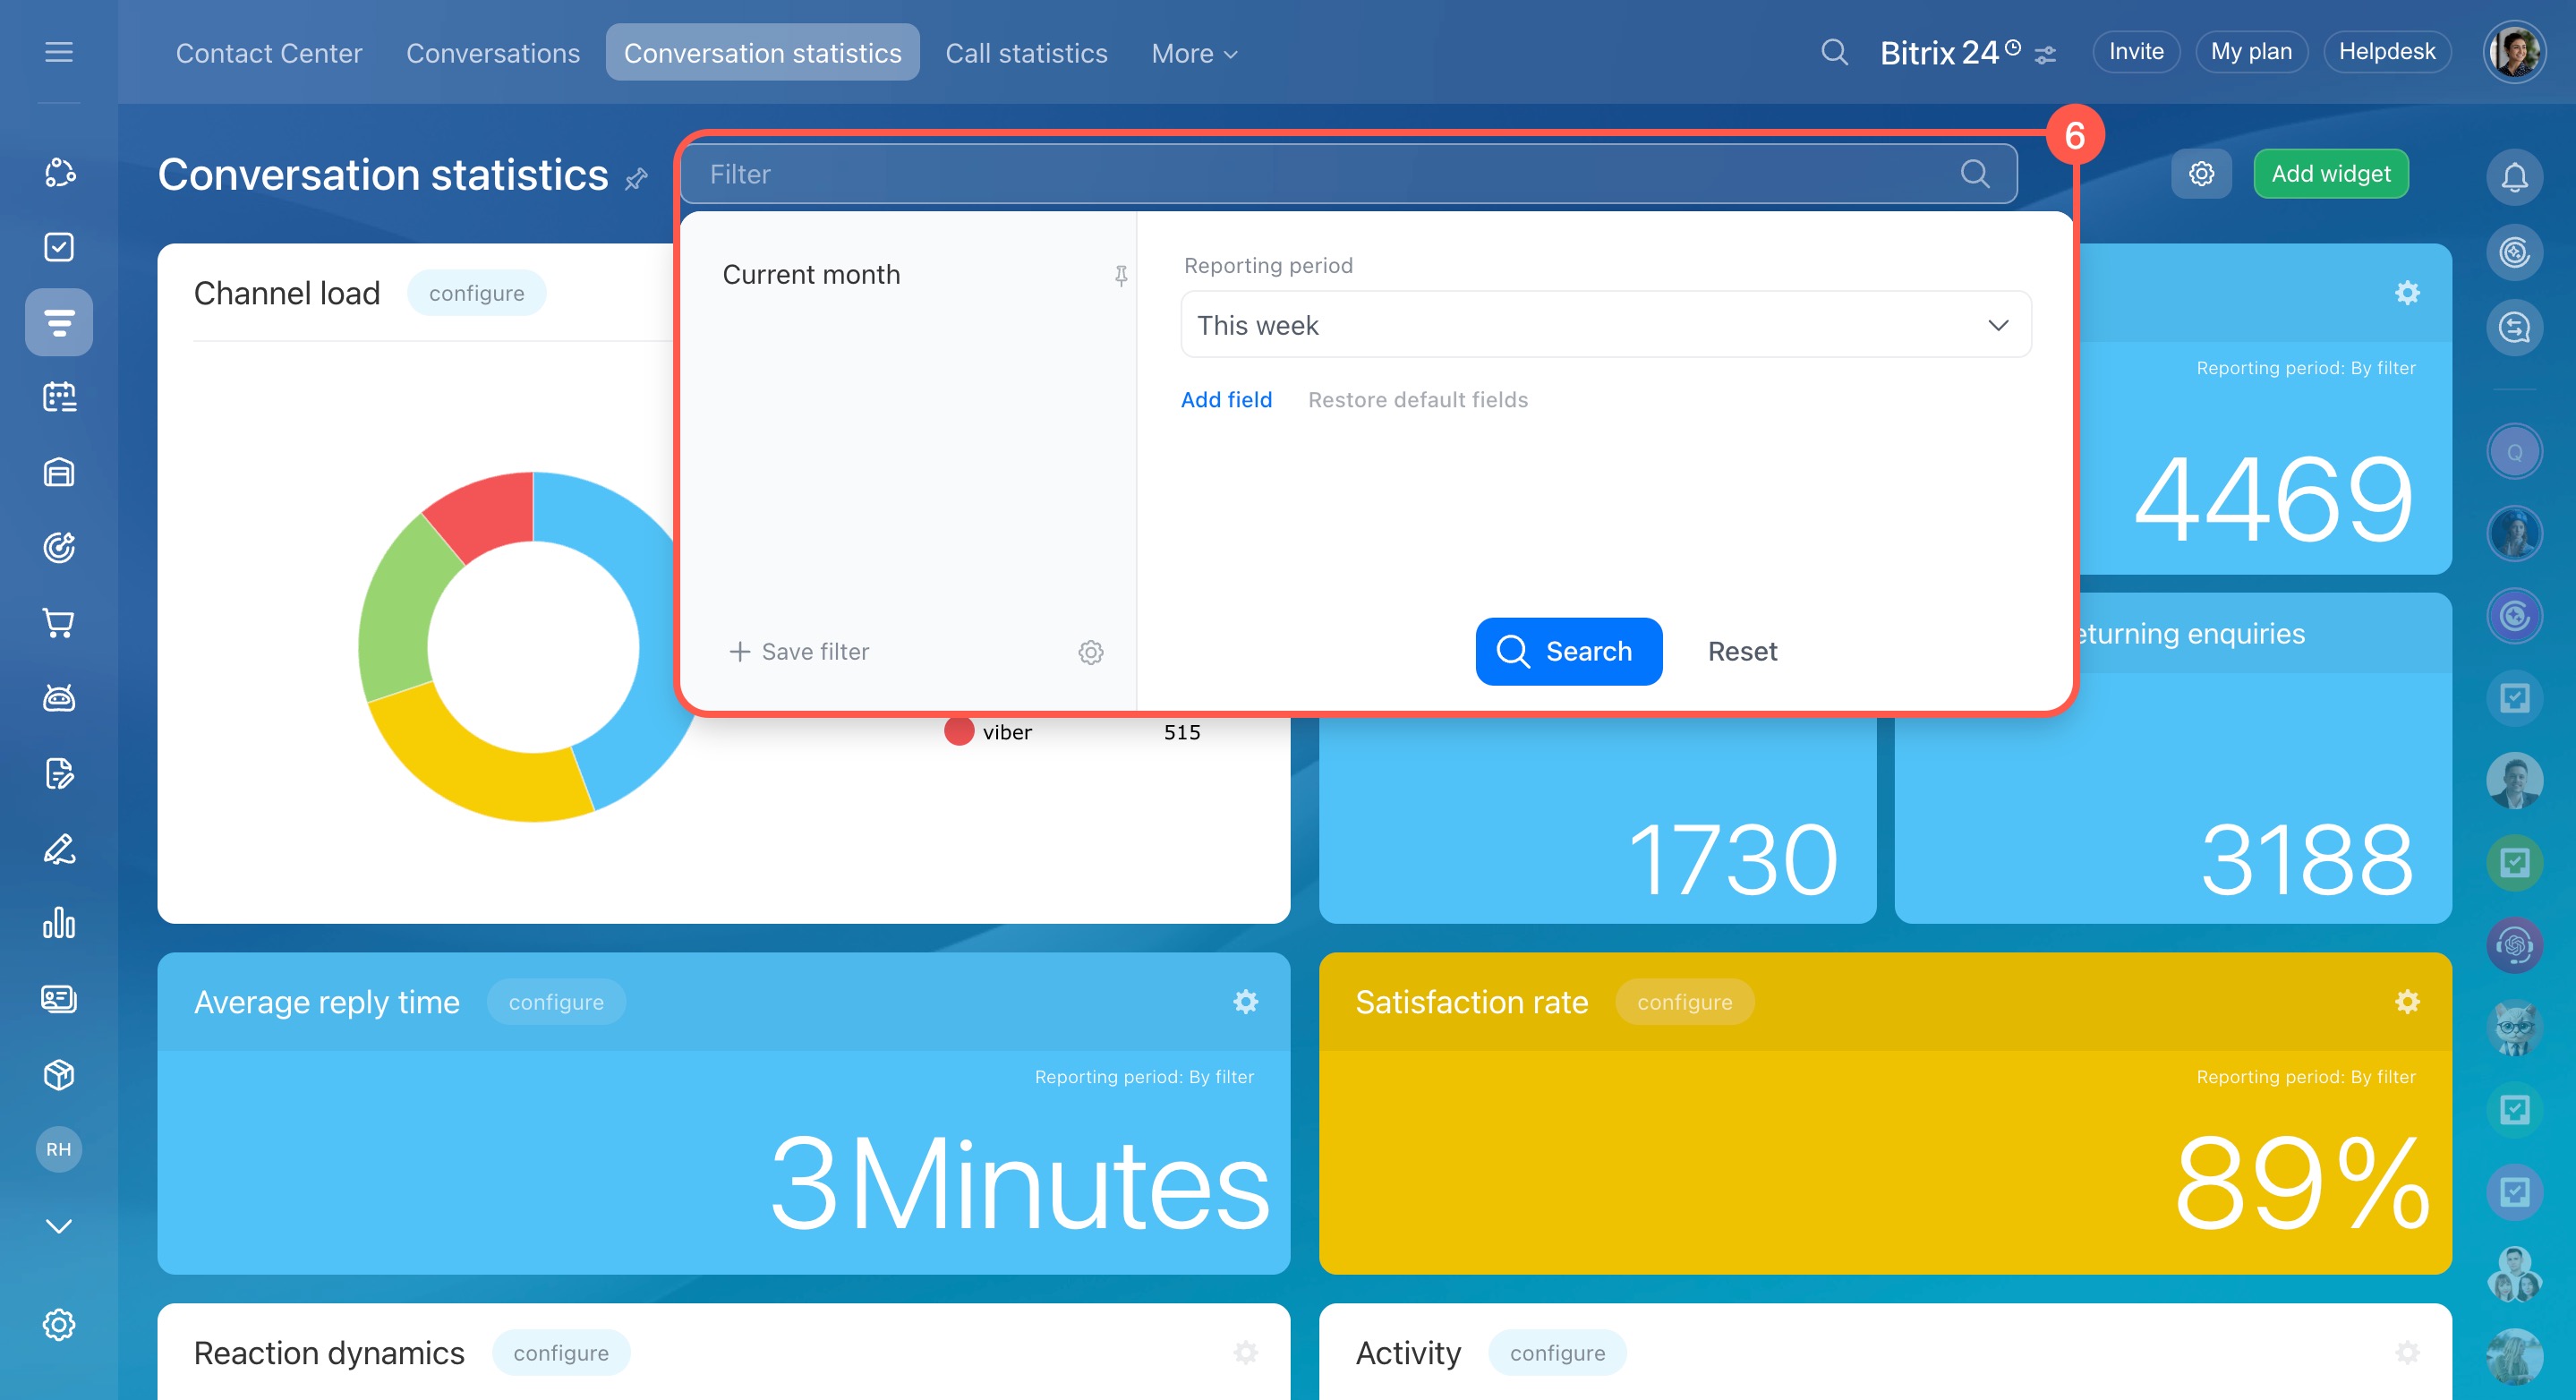
- Use the Filter field to set a reporting period and view chat data for specific dates.
Use built-in reports
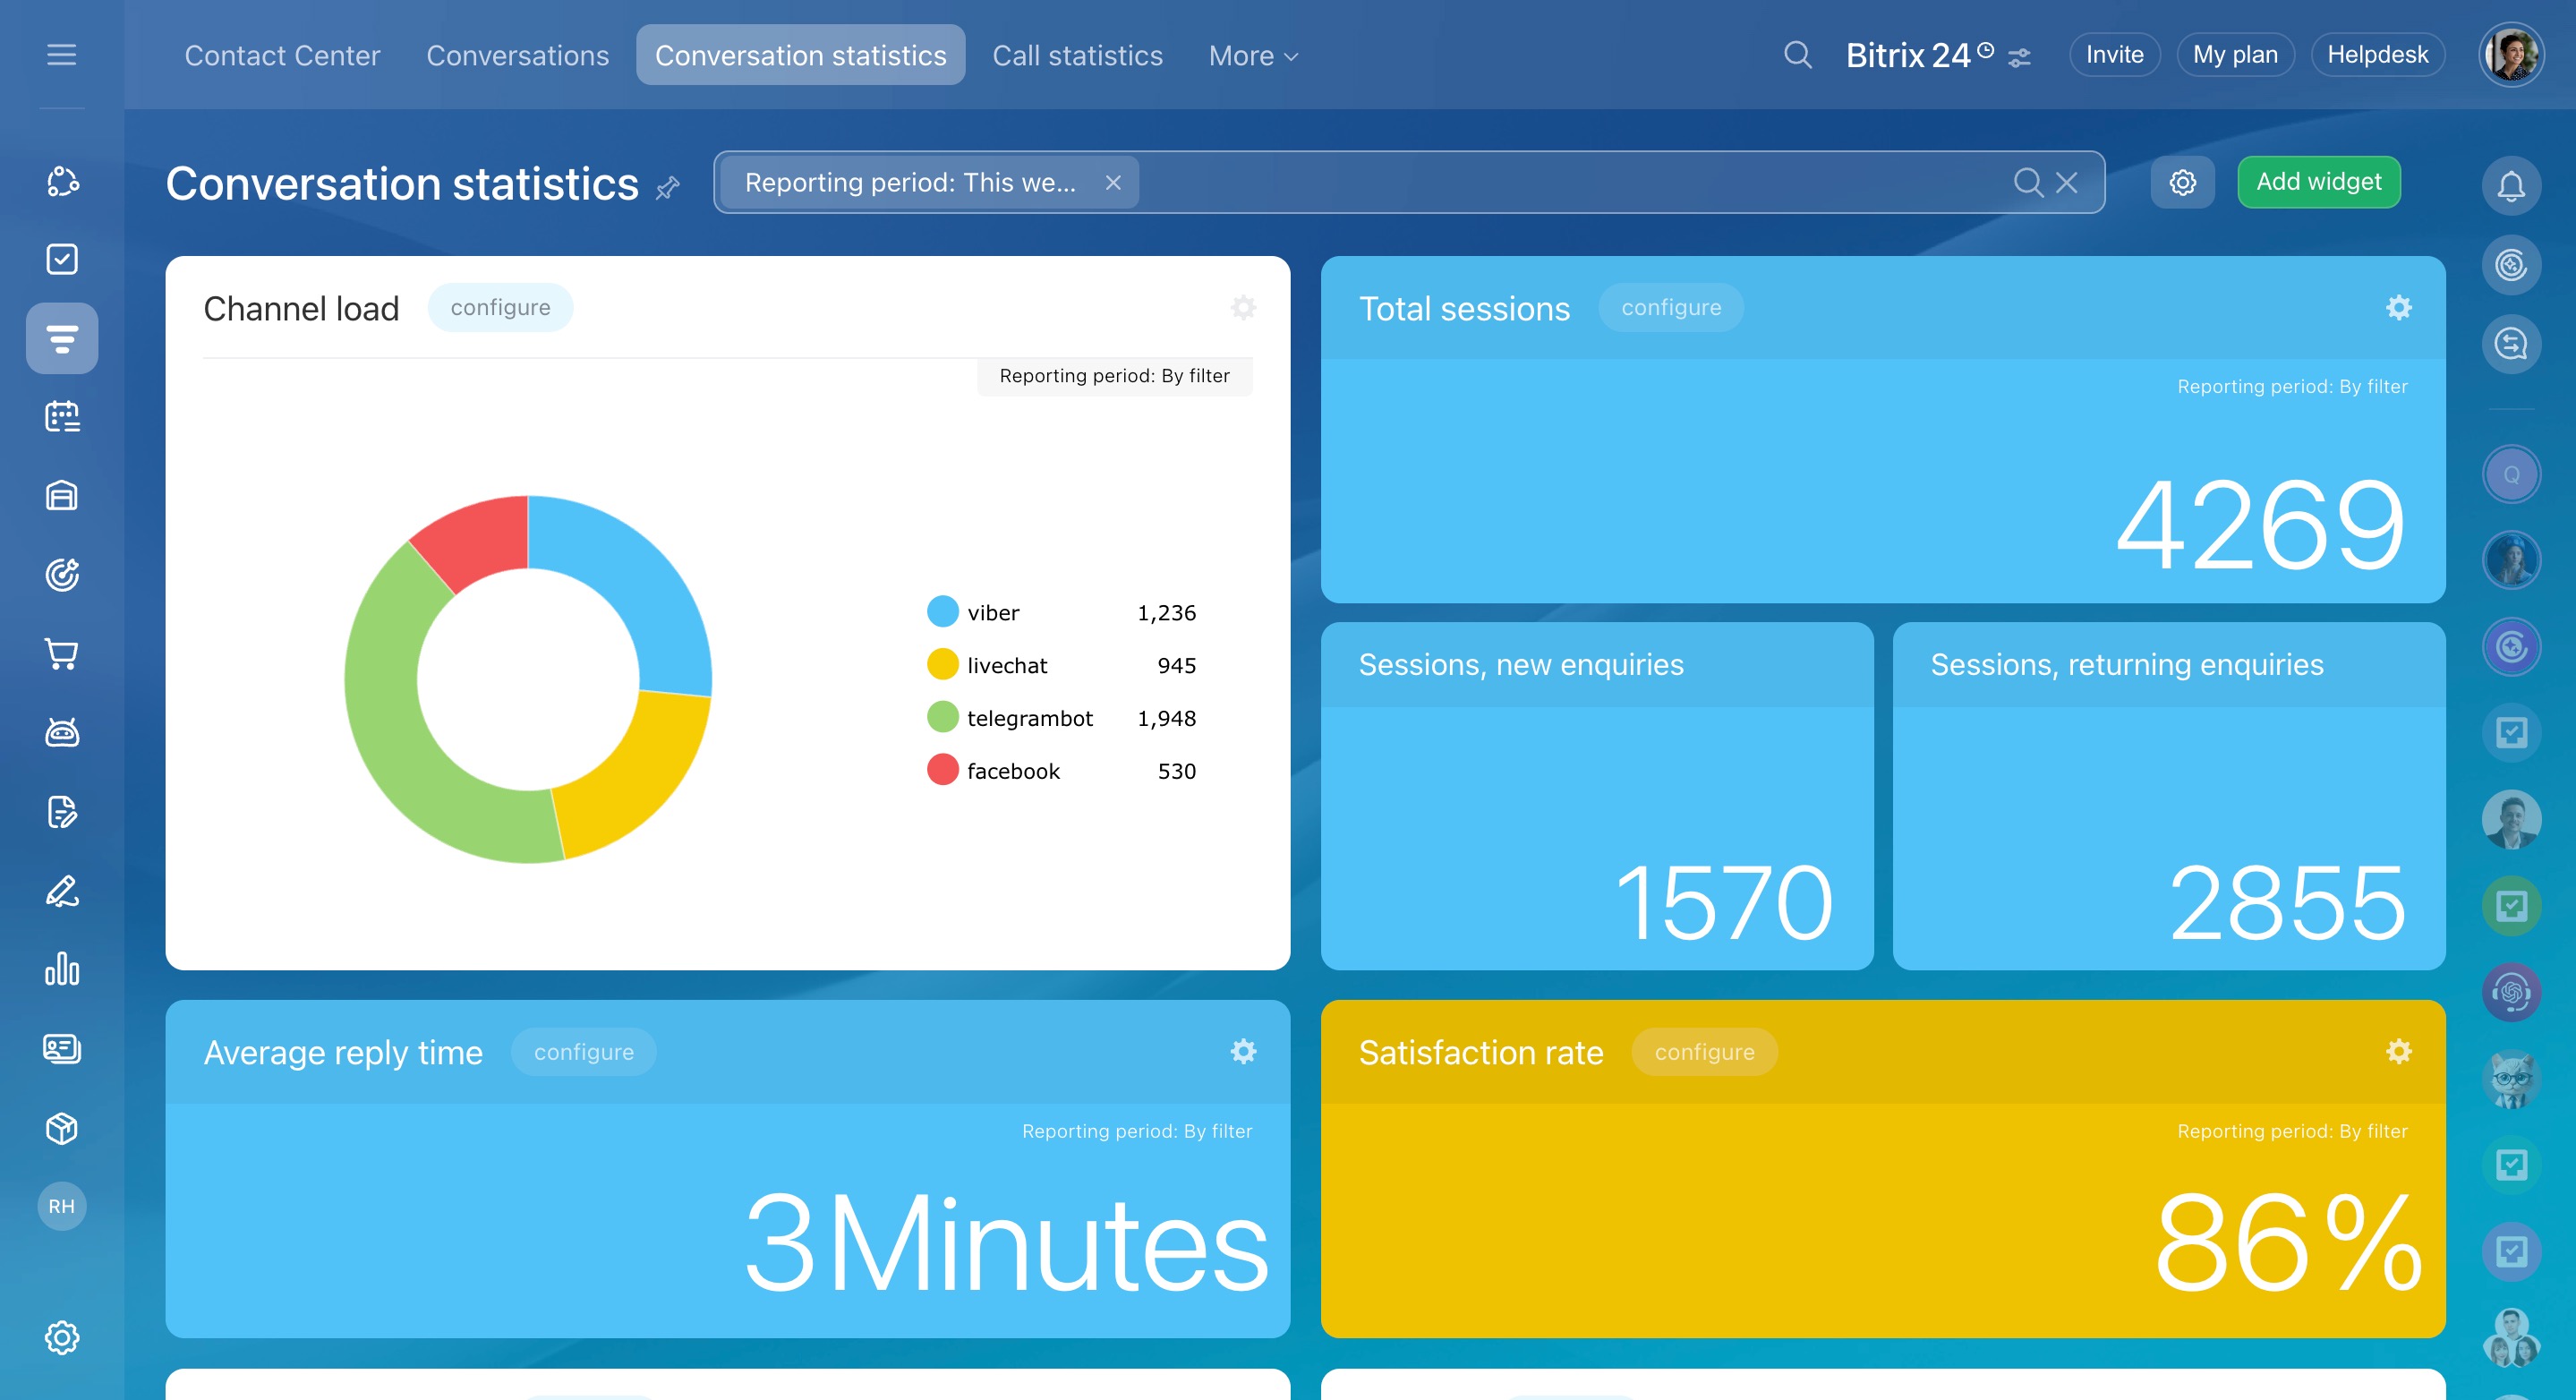
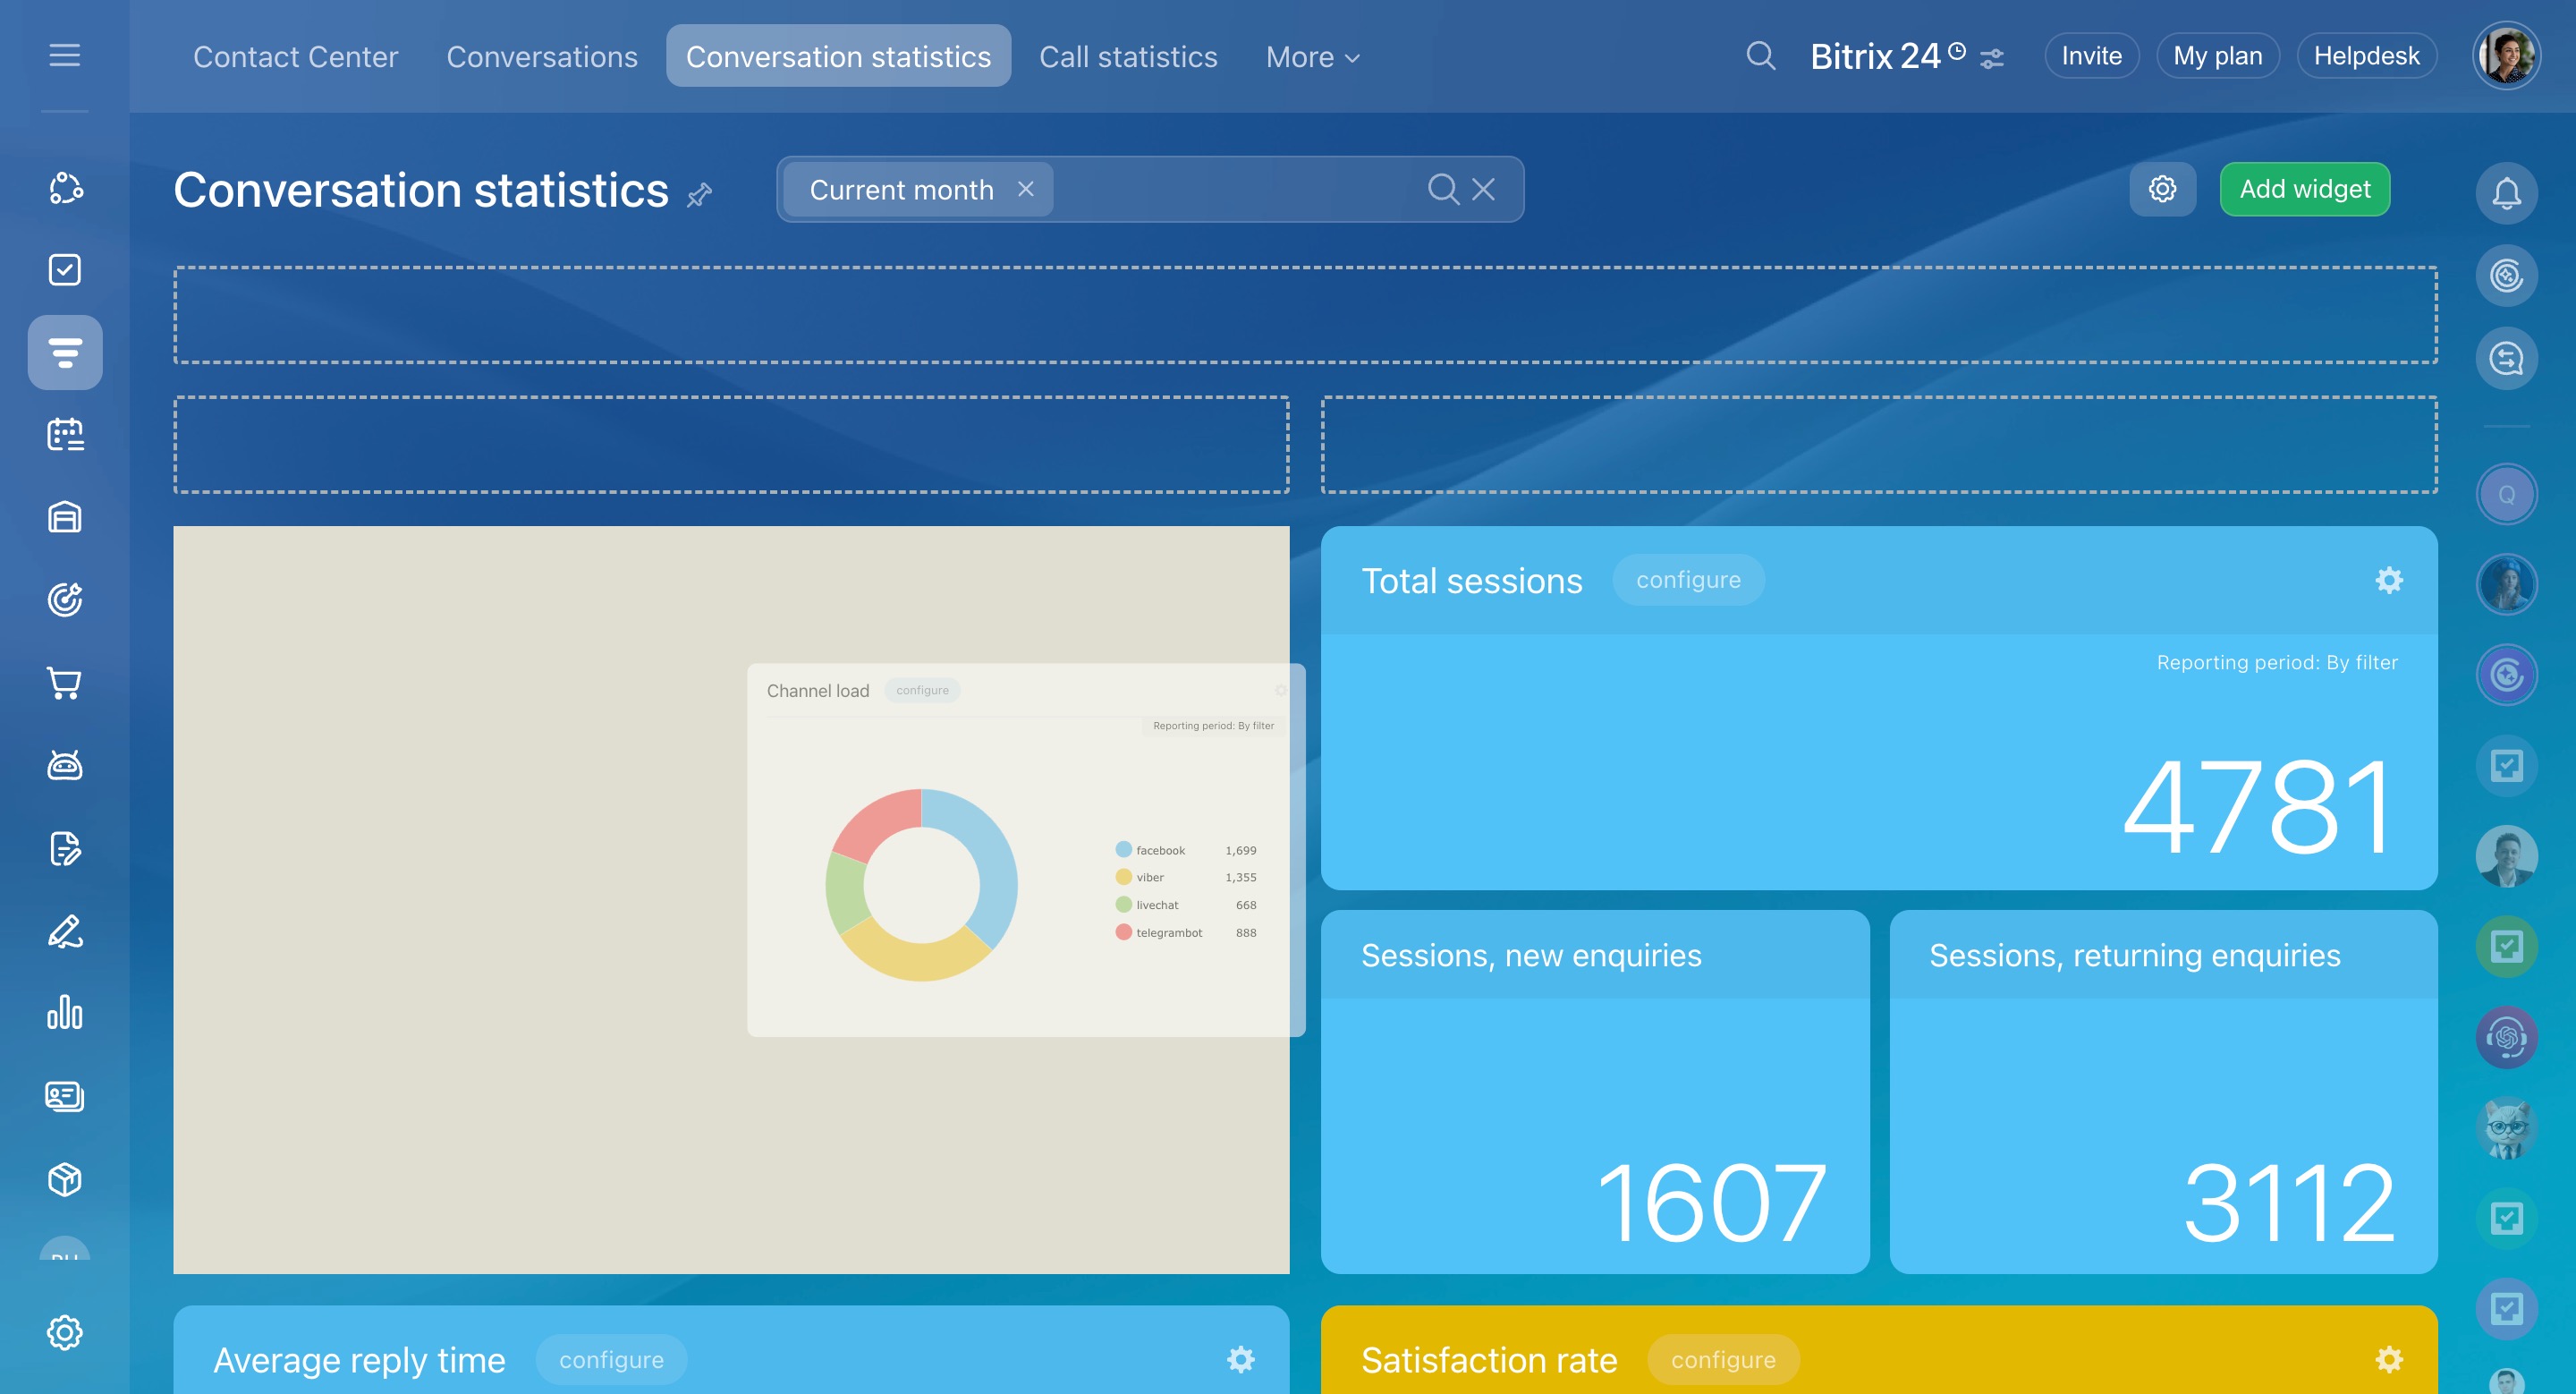
Bitrix24 offers built-in reports that display key metrics, such as agent workload, reply time, and customer satisfaction. You can use these reports as they are or customize them to fit your business needs.
These reports help you track team performance and make changes, like adding more agents to the queue or adjusting working hours.
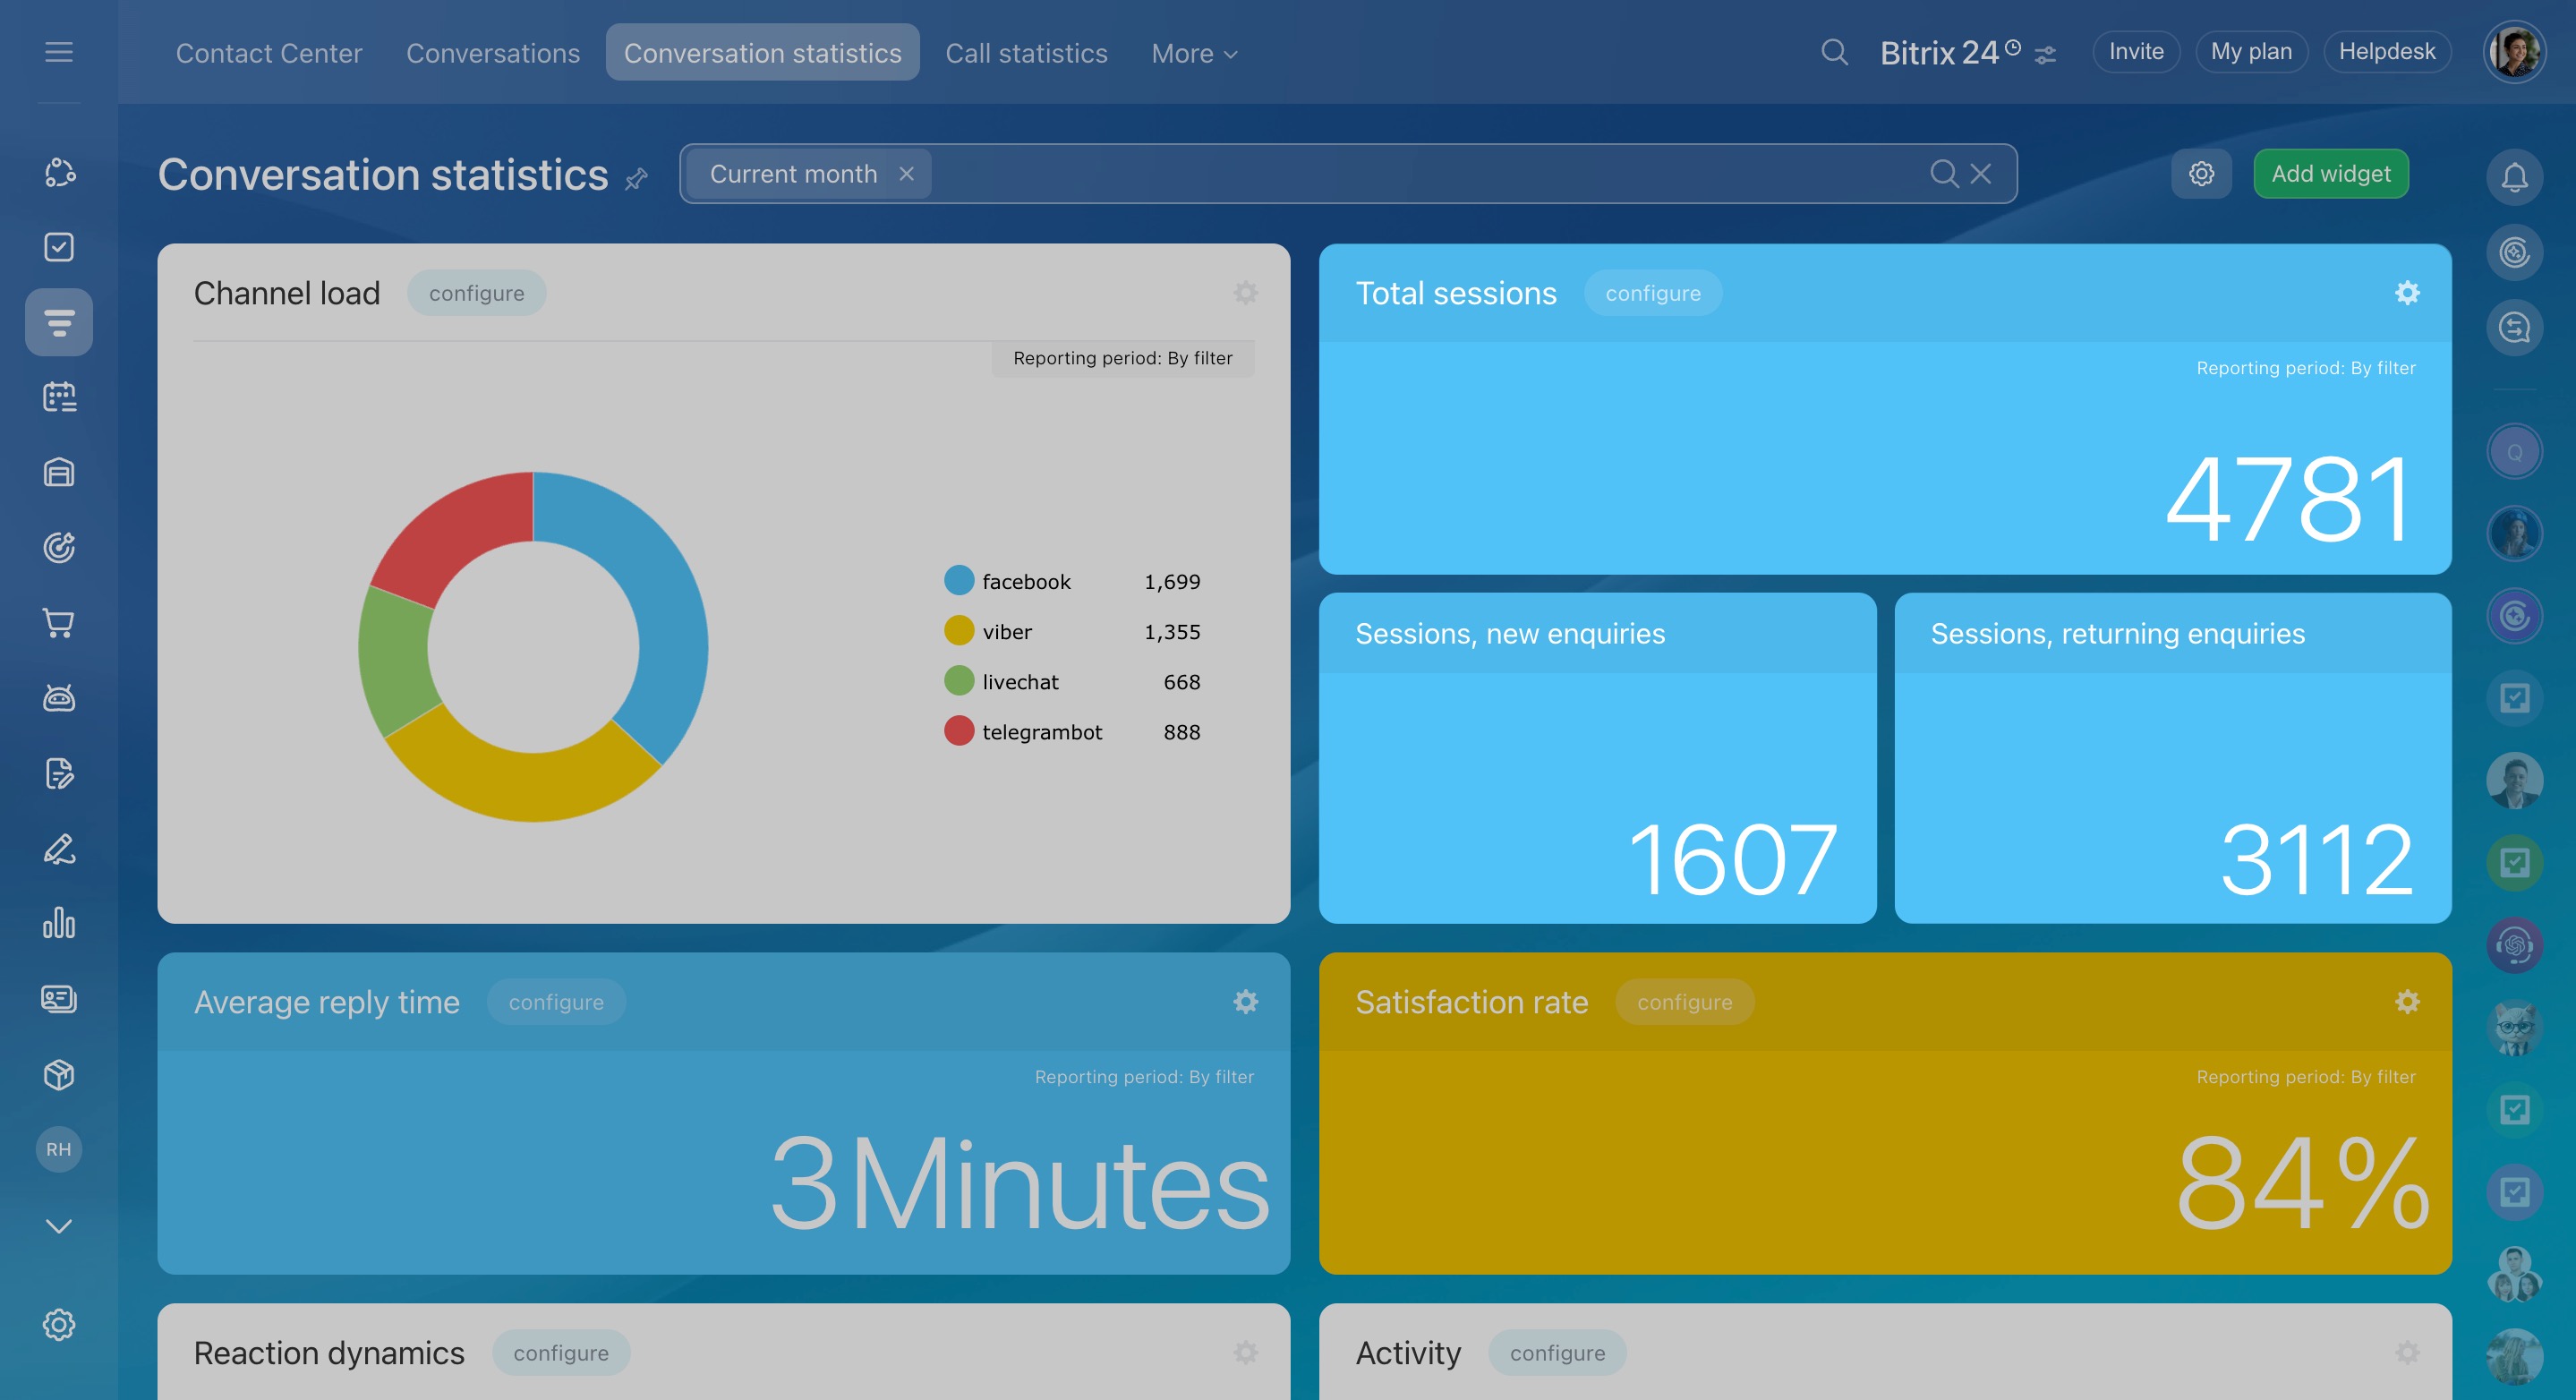
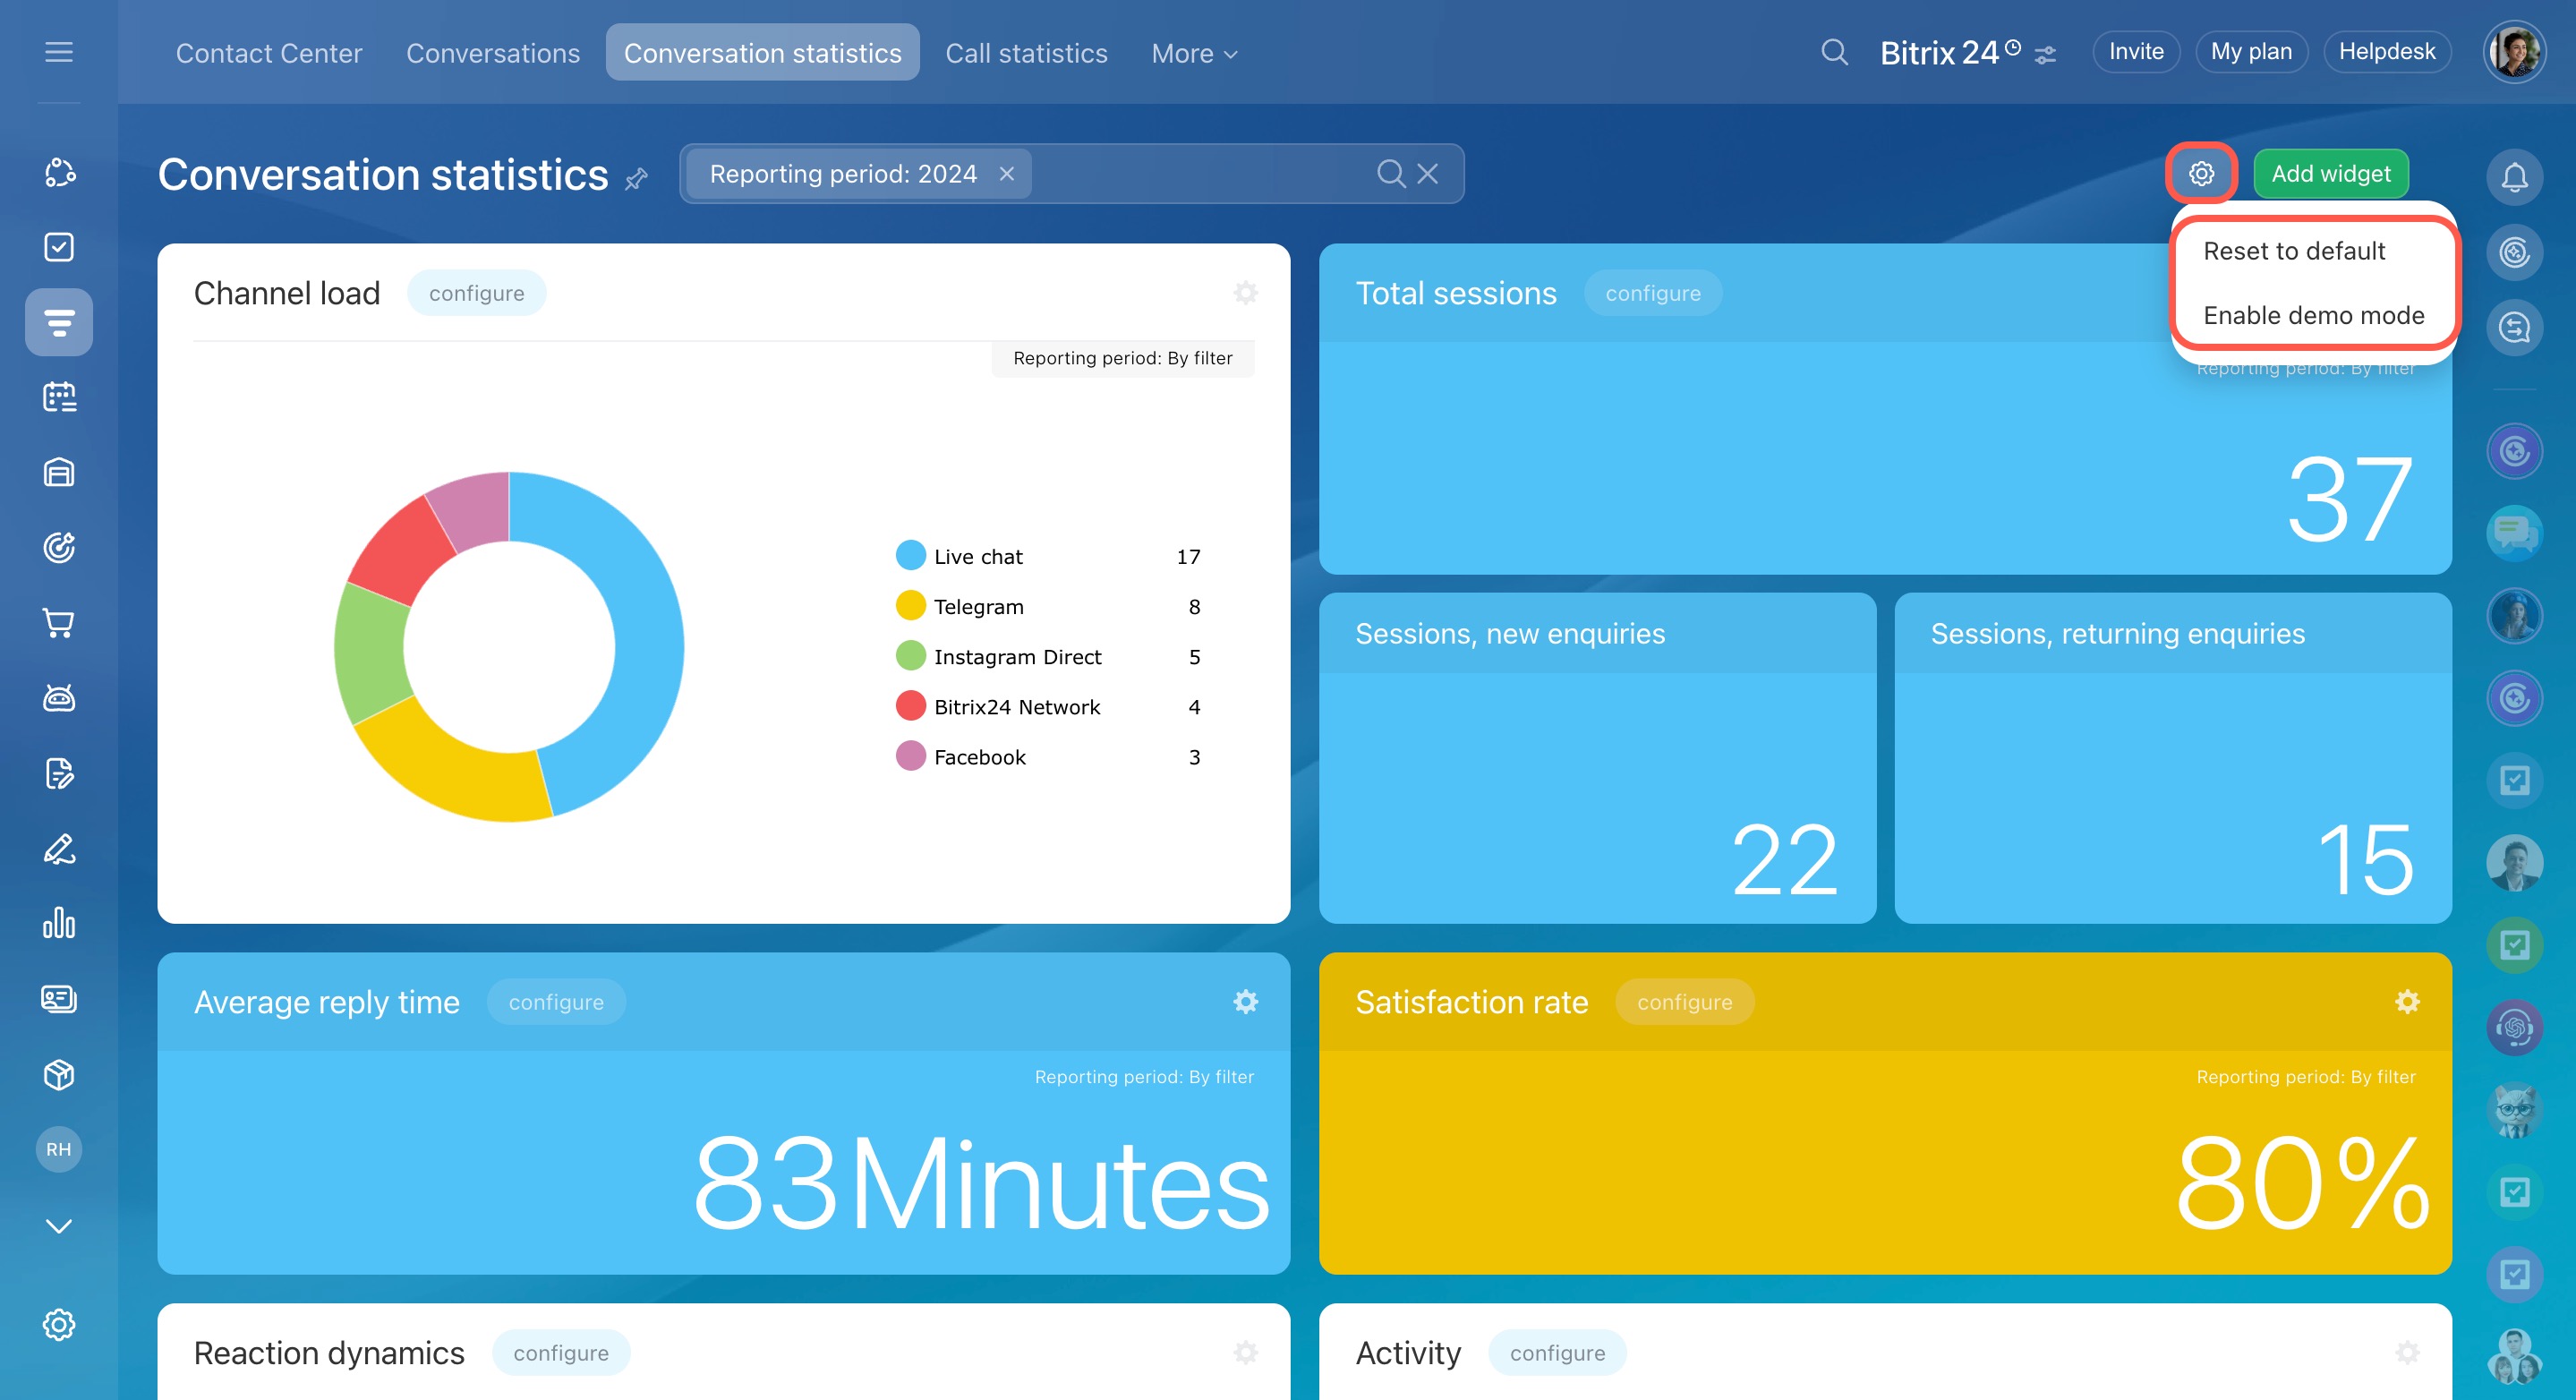
Channel load. The donut chart shows how sessions are split across different channels, such as 60% from Live chat, 25% from Telegram, and 15% from Facebook. It helps you see which channels your customers use most.
Session volume. This report is divided into three parts:
- Total sessions: The total number of conversations during the selected time period.
- Sessions, new enquiries: Customers who contacted you for the first time.
- Sessions, returning enquiries: Existing CRM contacts who reached out again with follow‑up questions or new purchase requests.
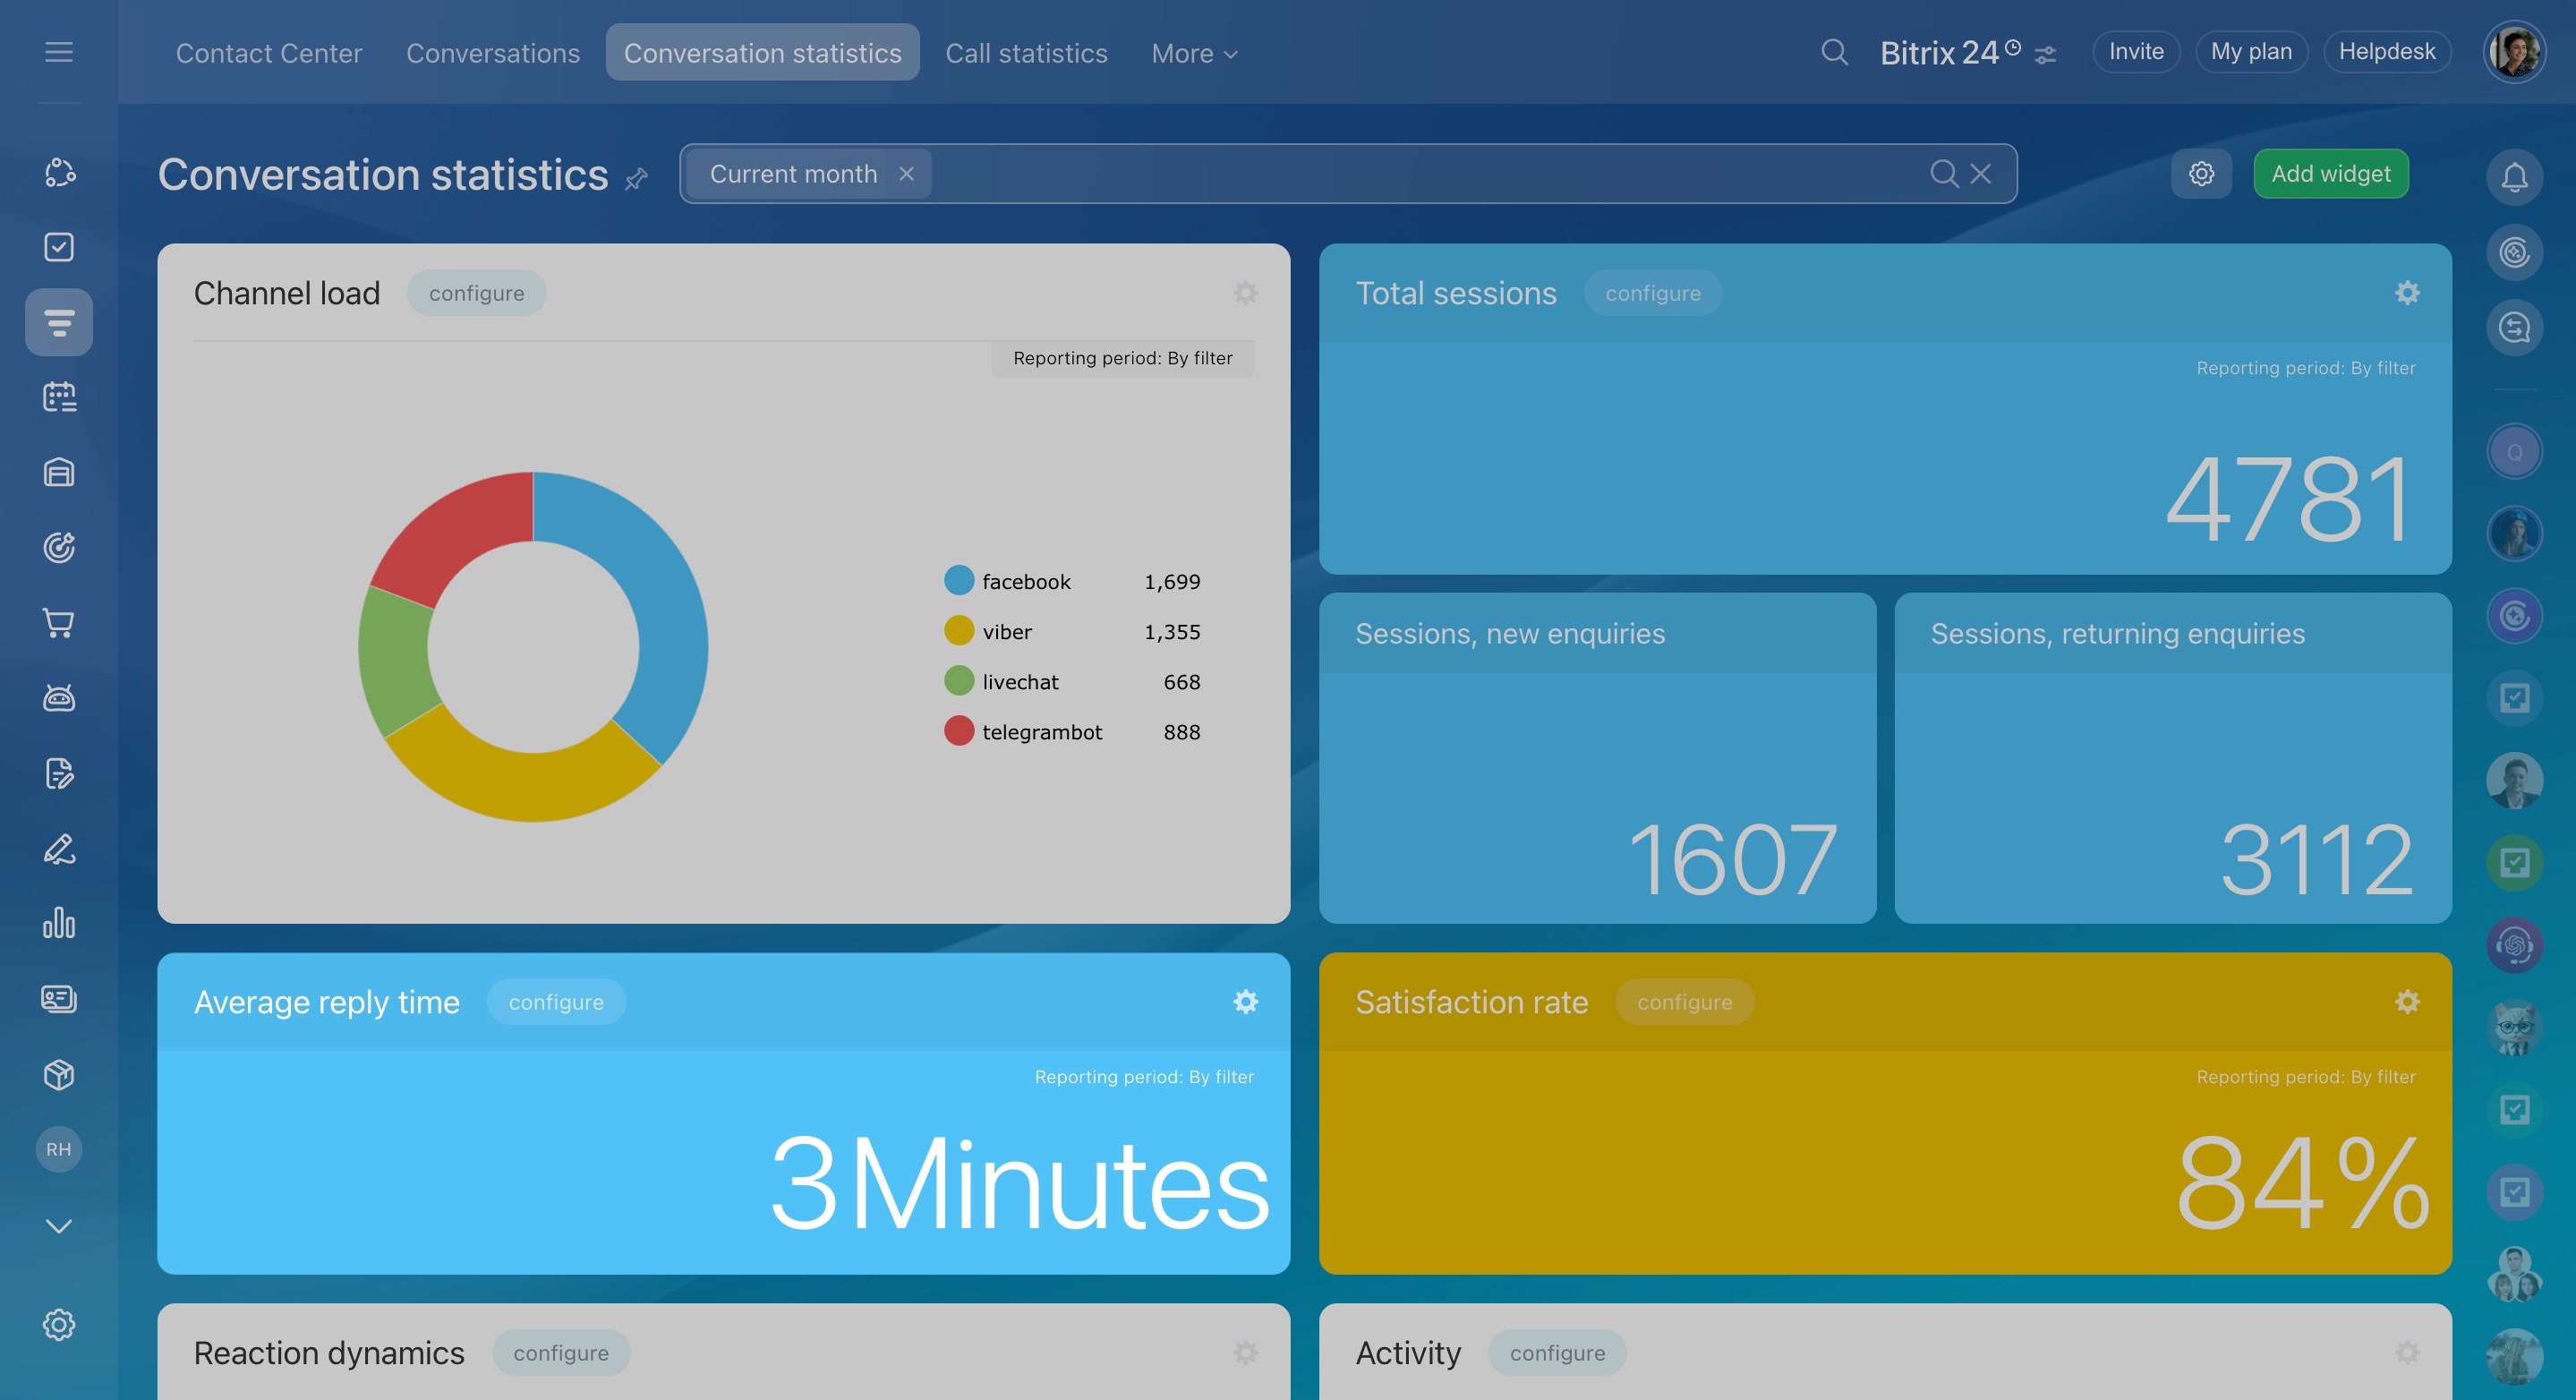
Average reply time. This is the average time between a customer’s first message and when an agent clicks Reply to start the conversation. It helps assess how quickly agents respond. The calculation includes all hours, including non-working times, so late-night messages may increase the average. When a chat is transferred between agents, each agent’s reply time is counted separately.
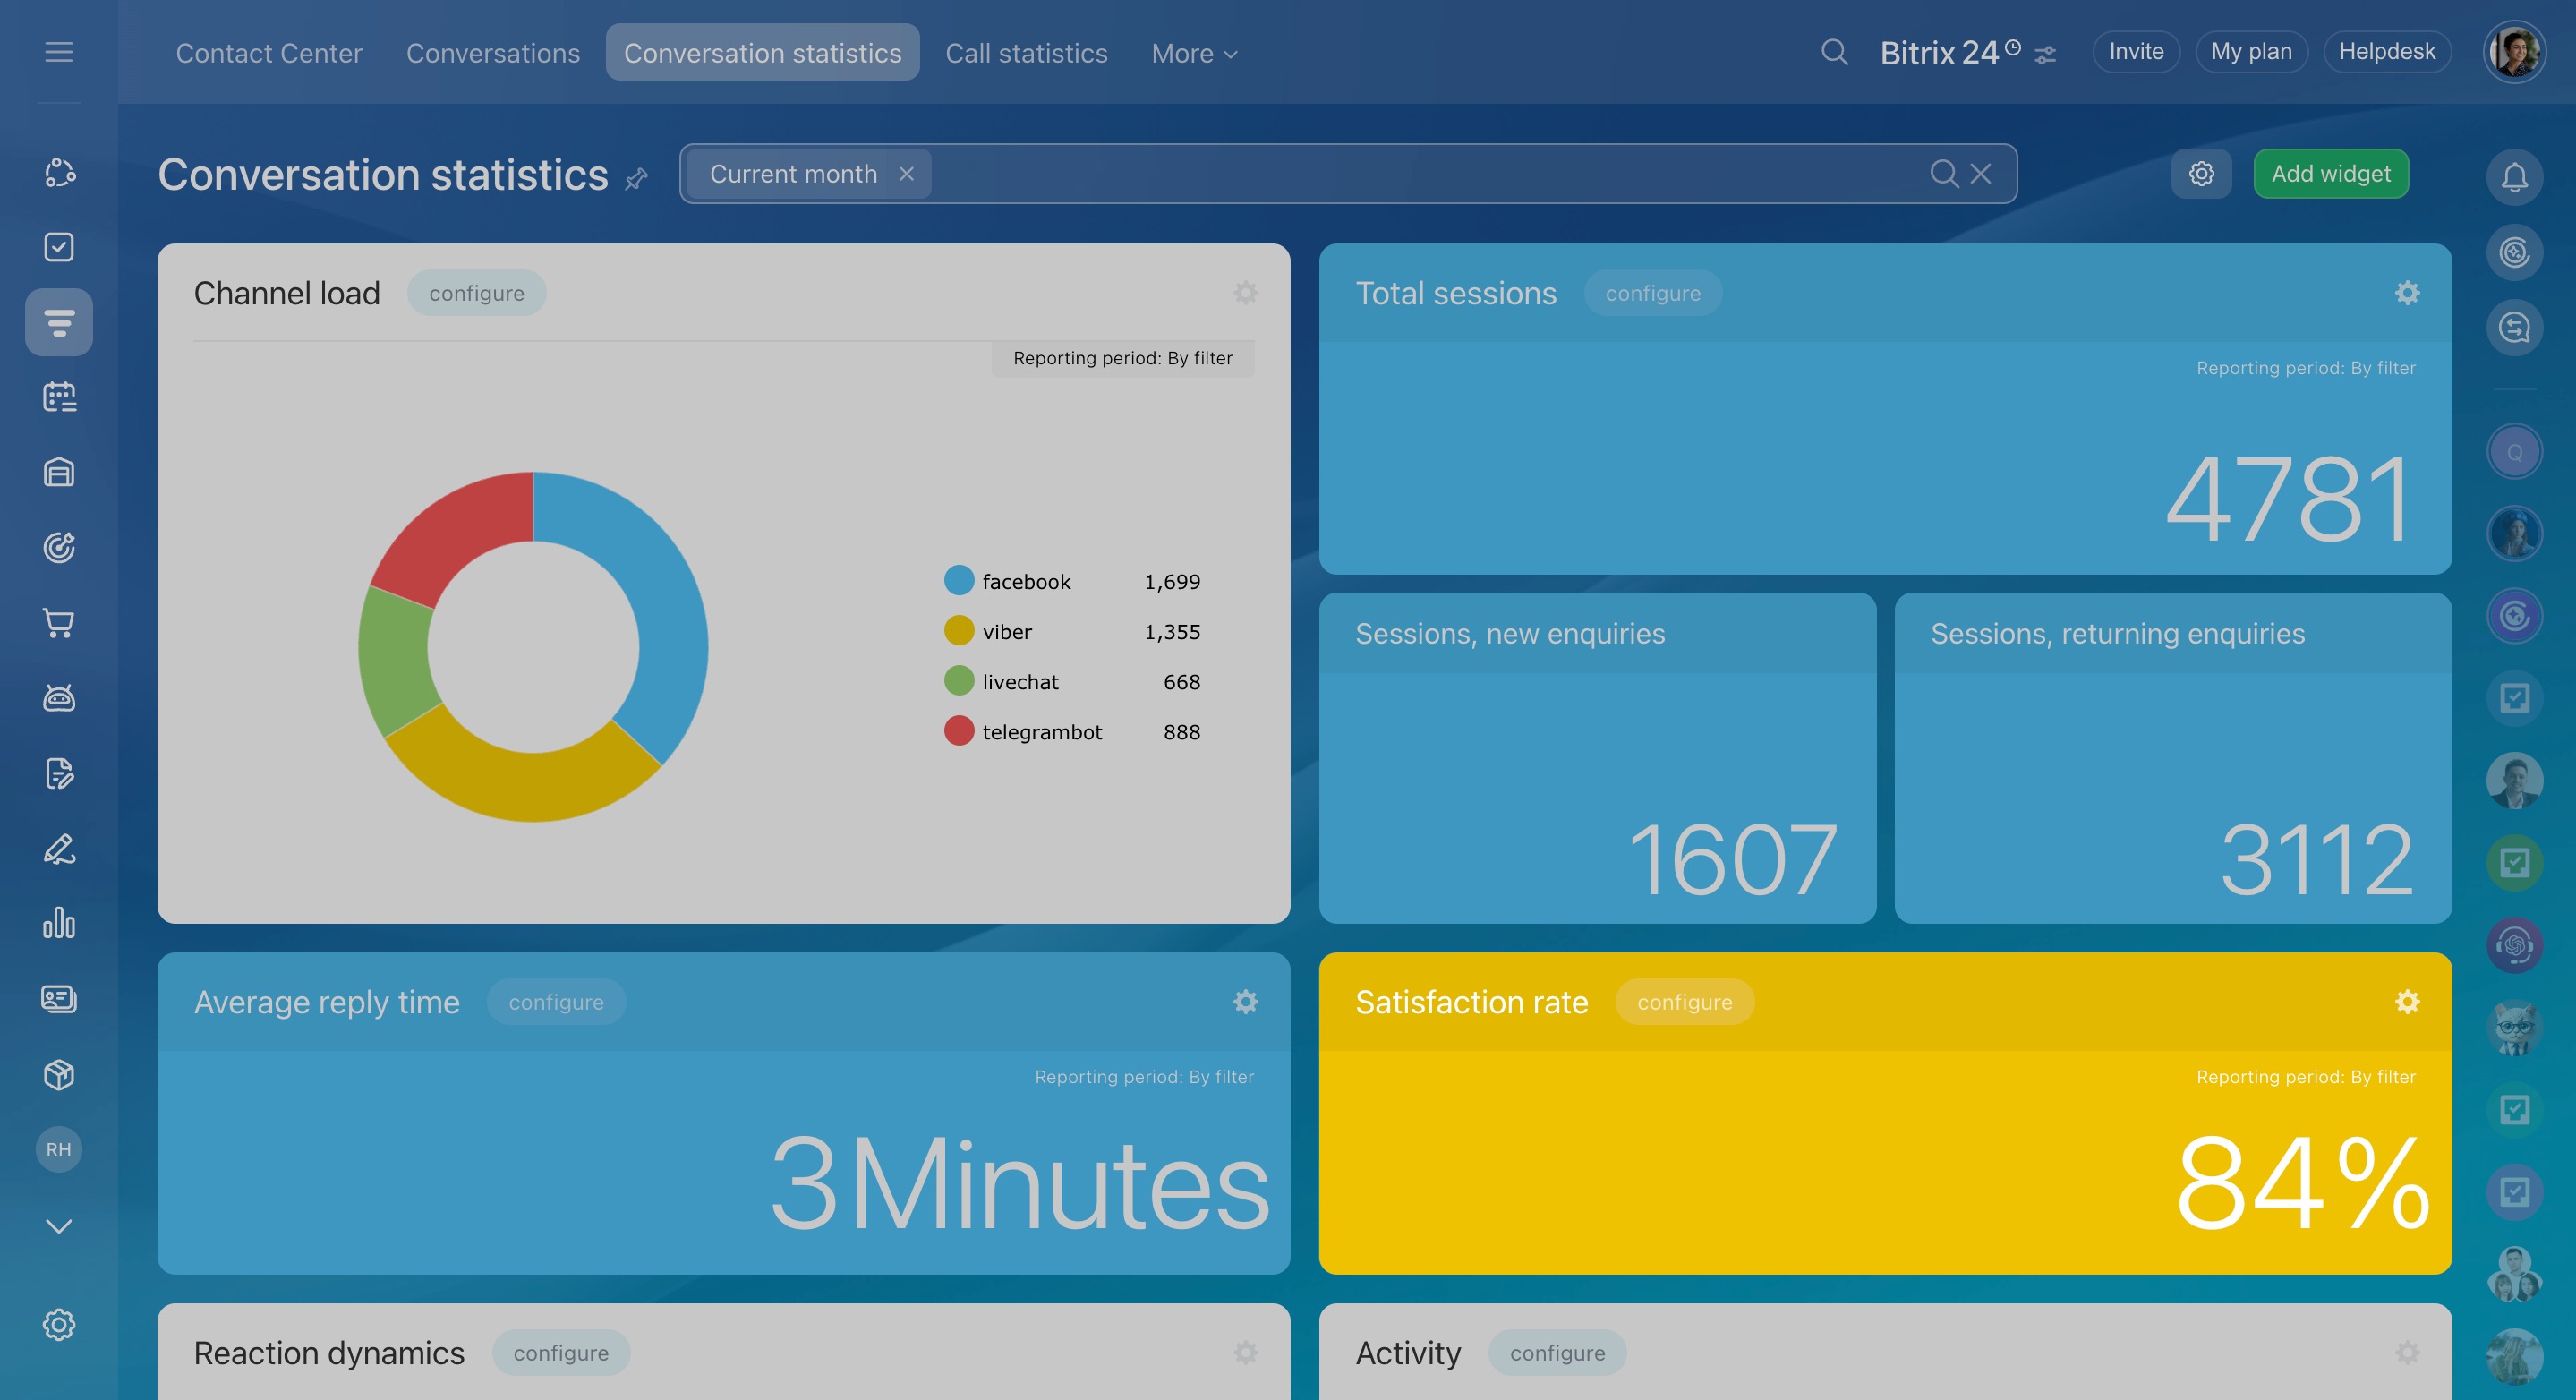
Satisfaction rate. This widget displays the percentage of positive customer ratings after conversations. Only rated chats are included. It’s a great way to measure both customer satisfaction and agent performance.
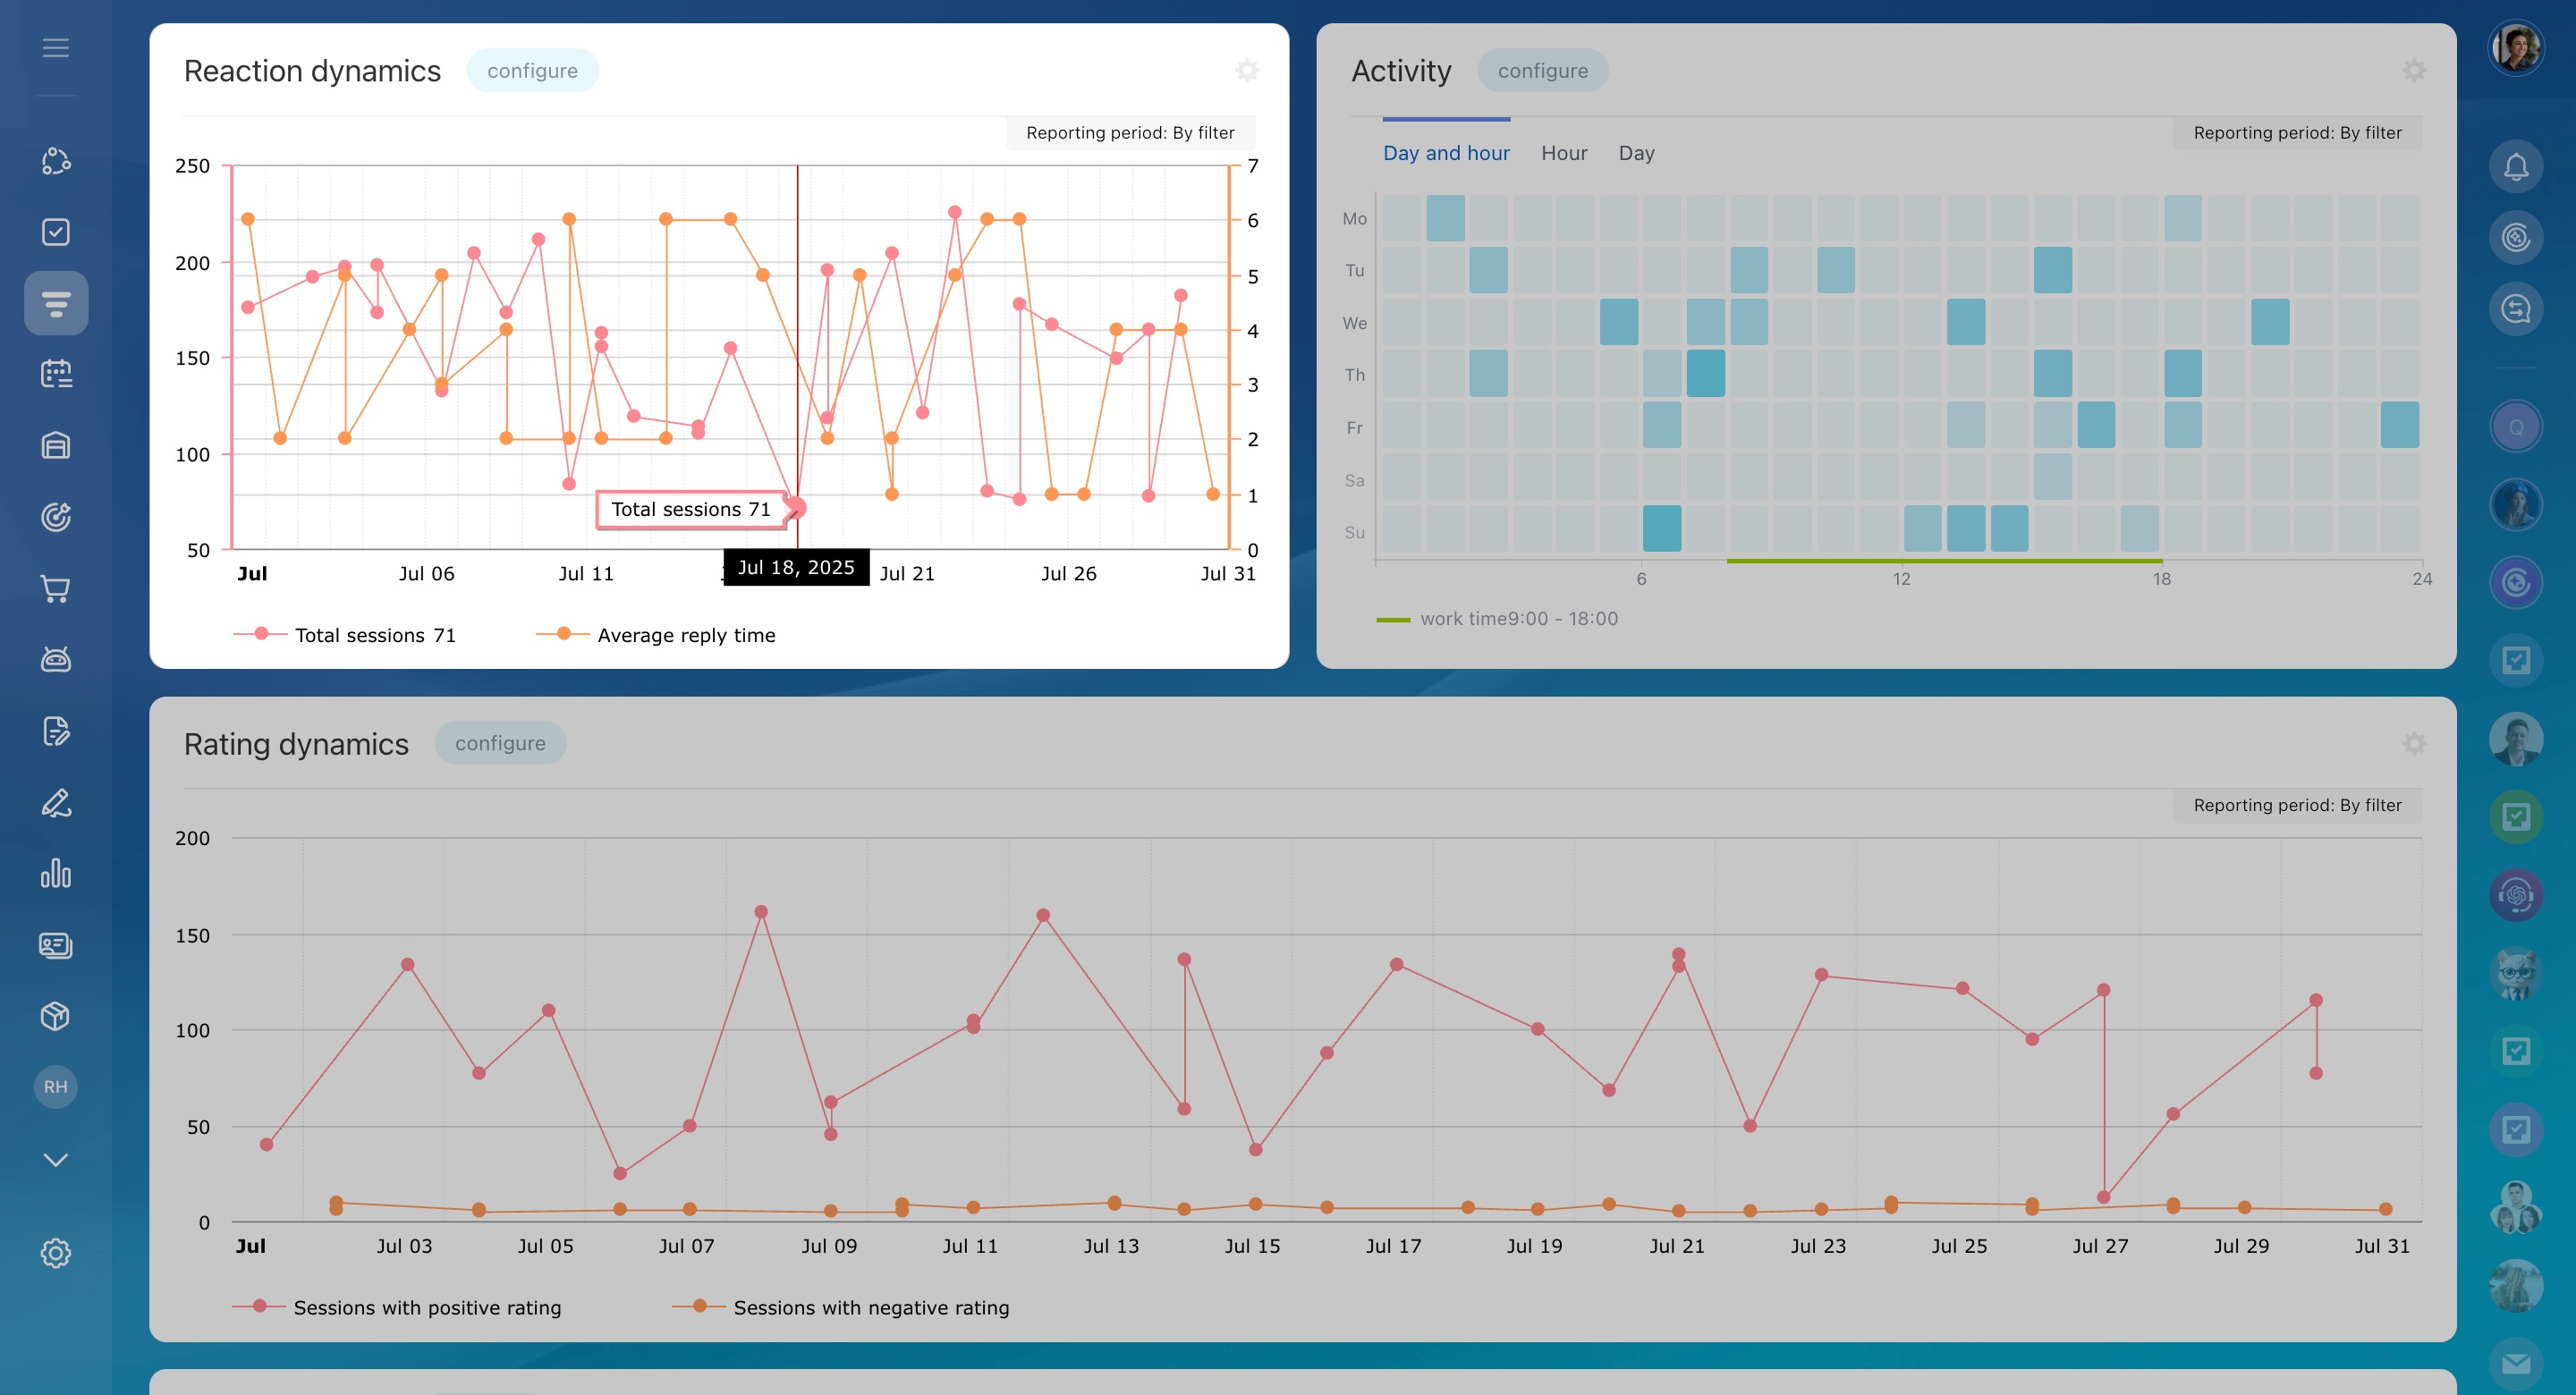
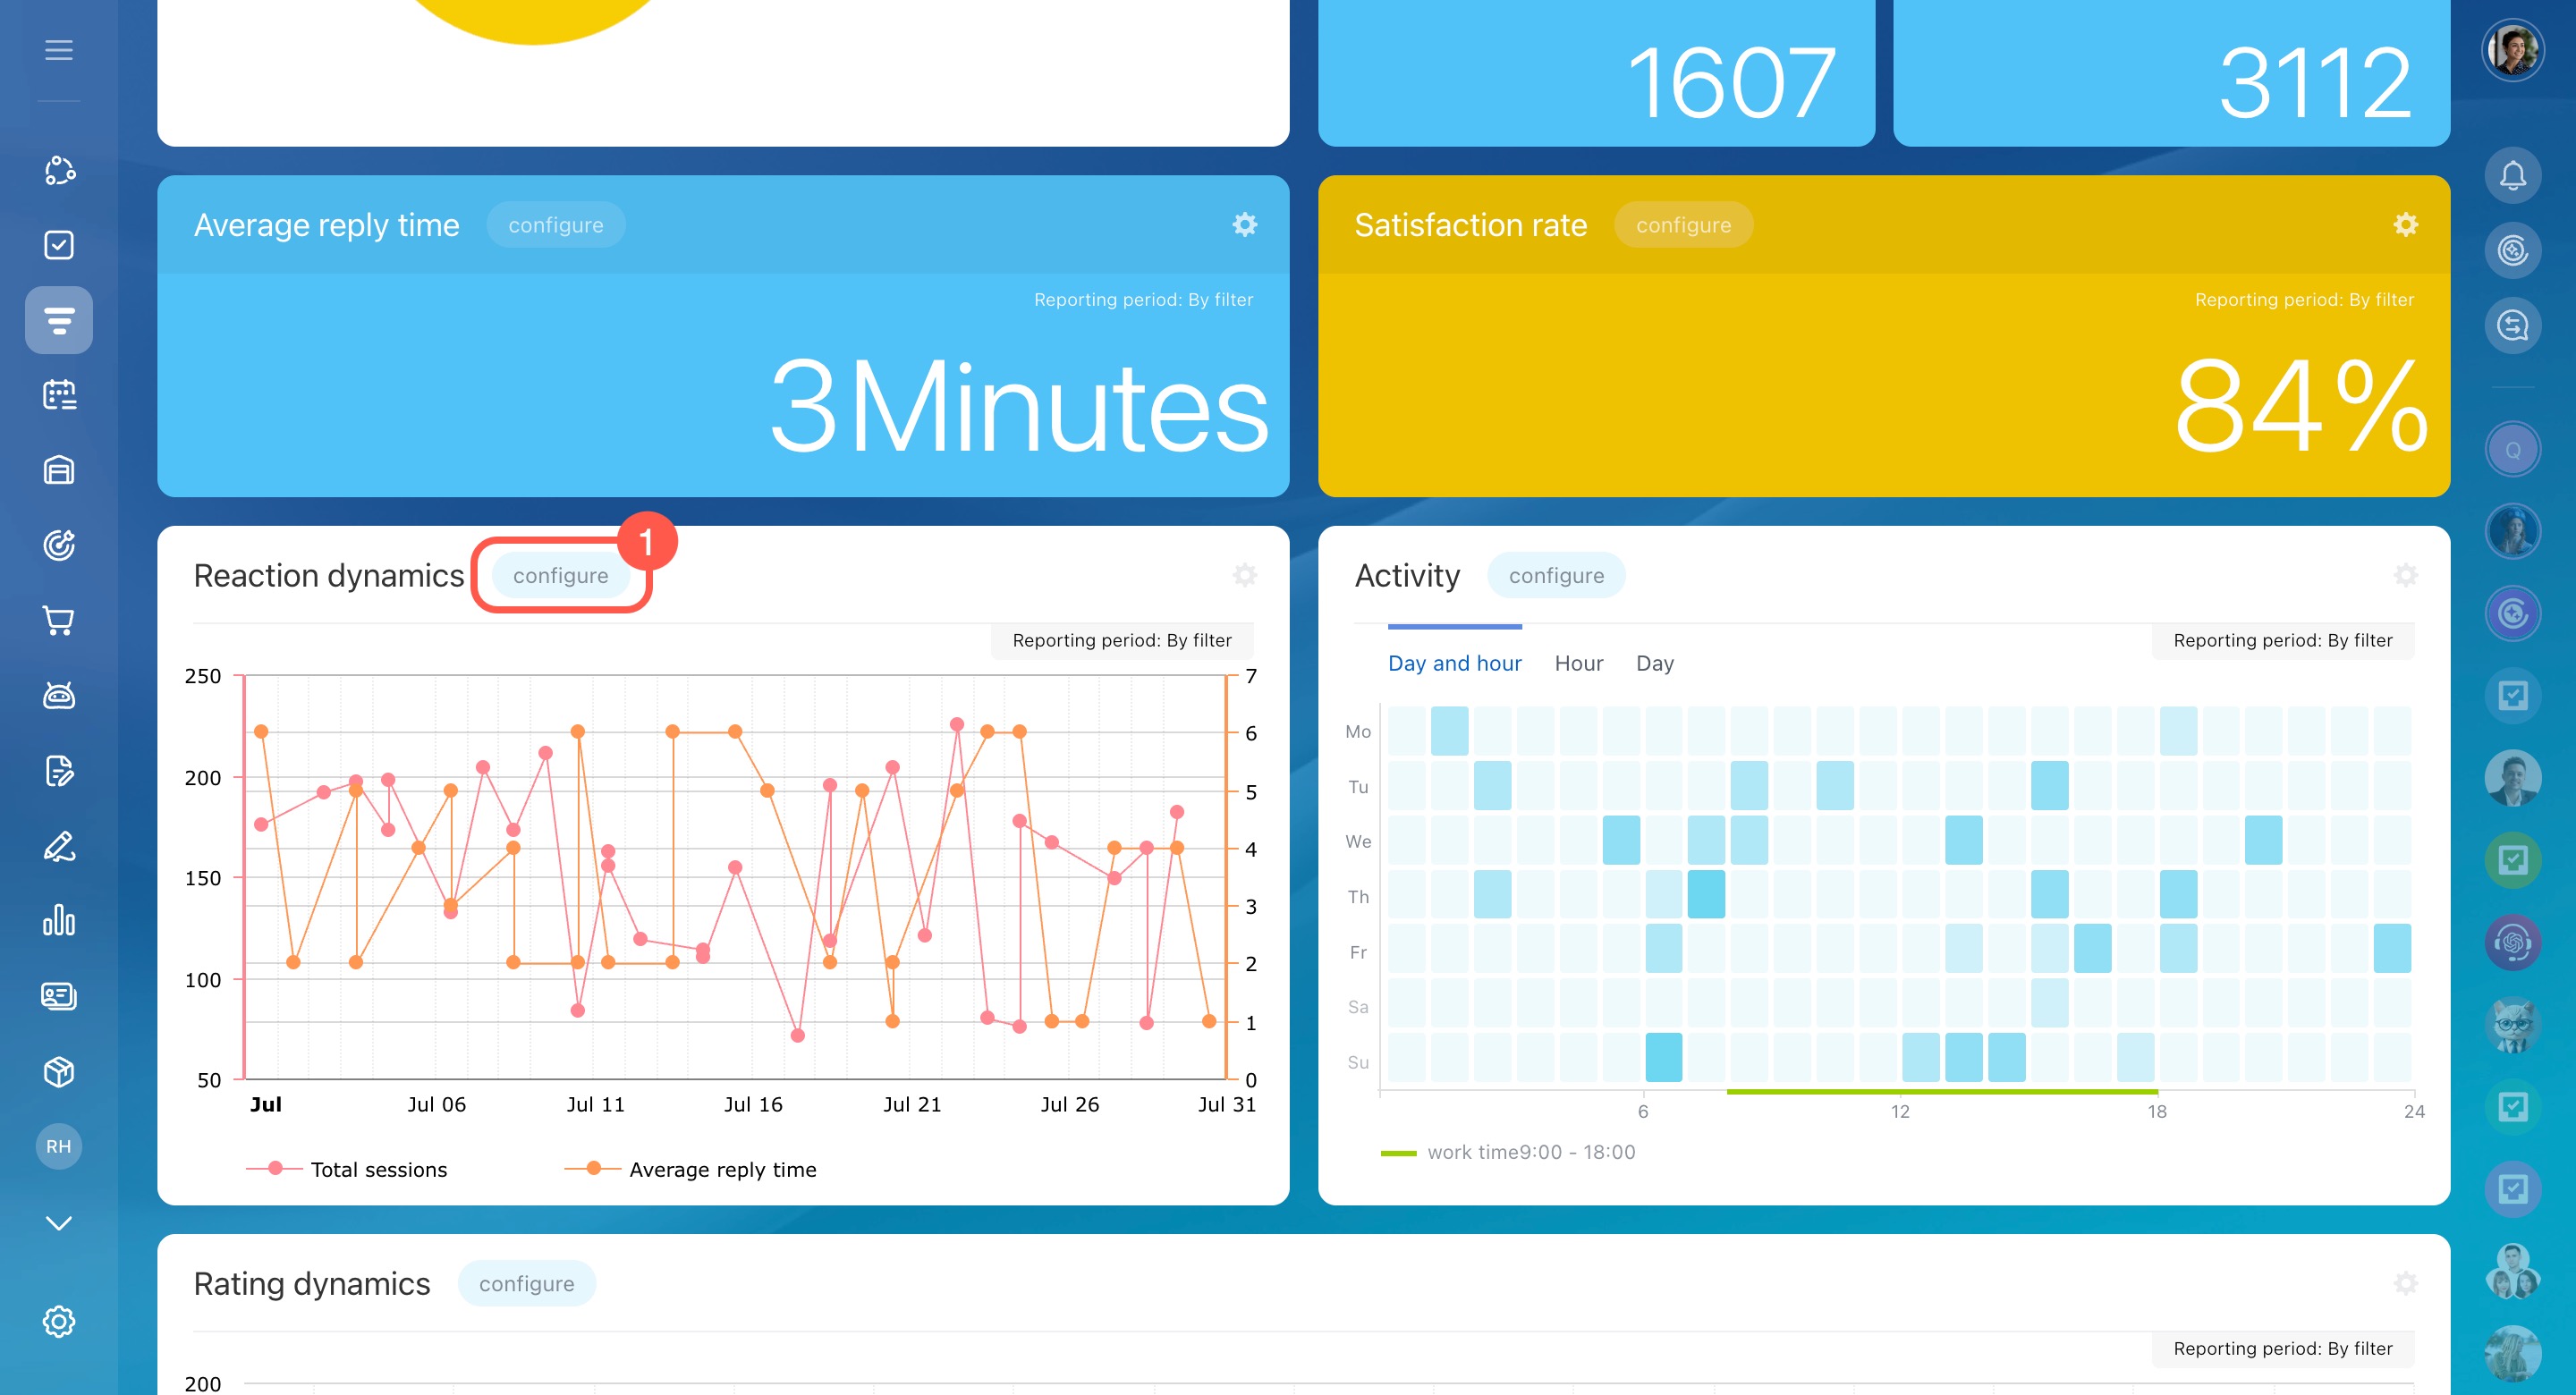
Reaction dynamics. This chart shows daily trends in incoming messages and average reply times. Use it to track how changes, such as new scripts or team adjustments, impact agent performance.
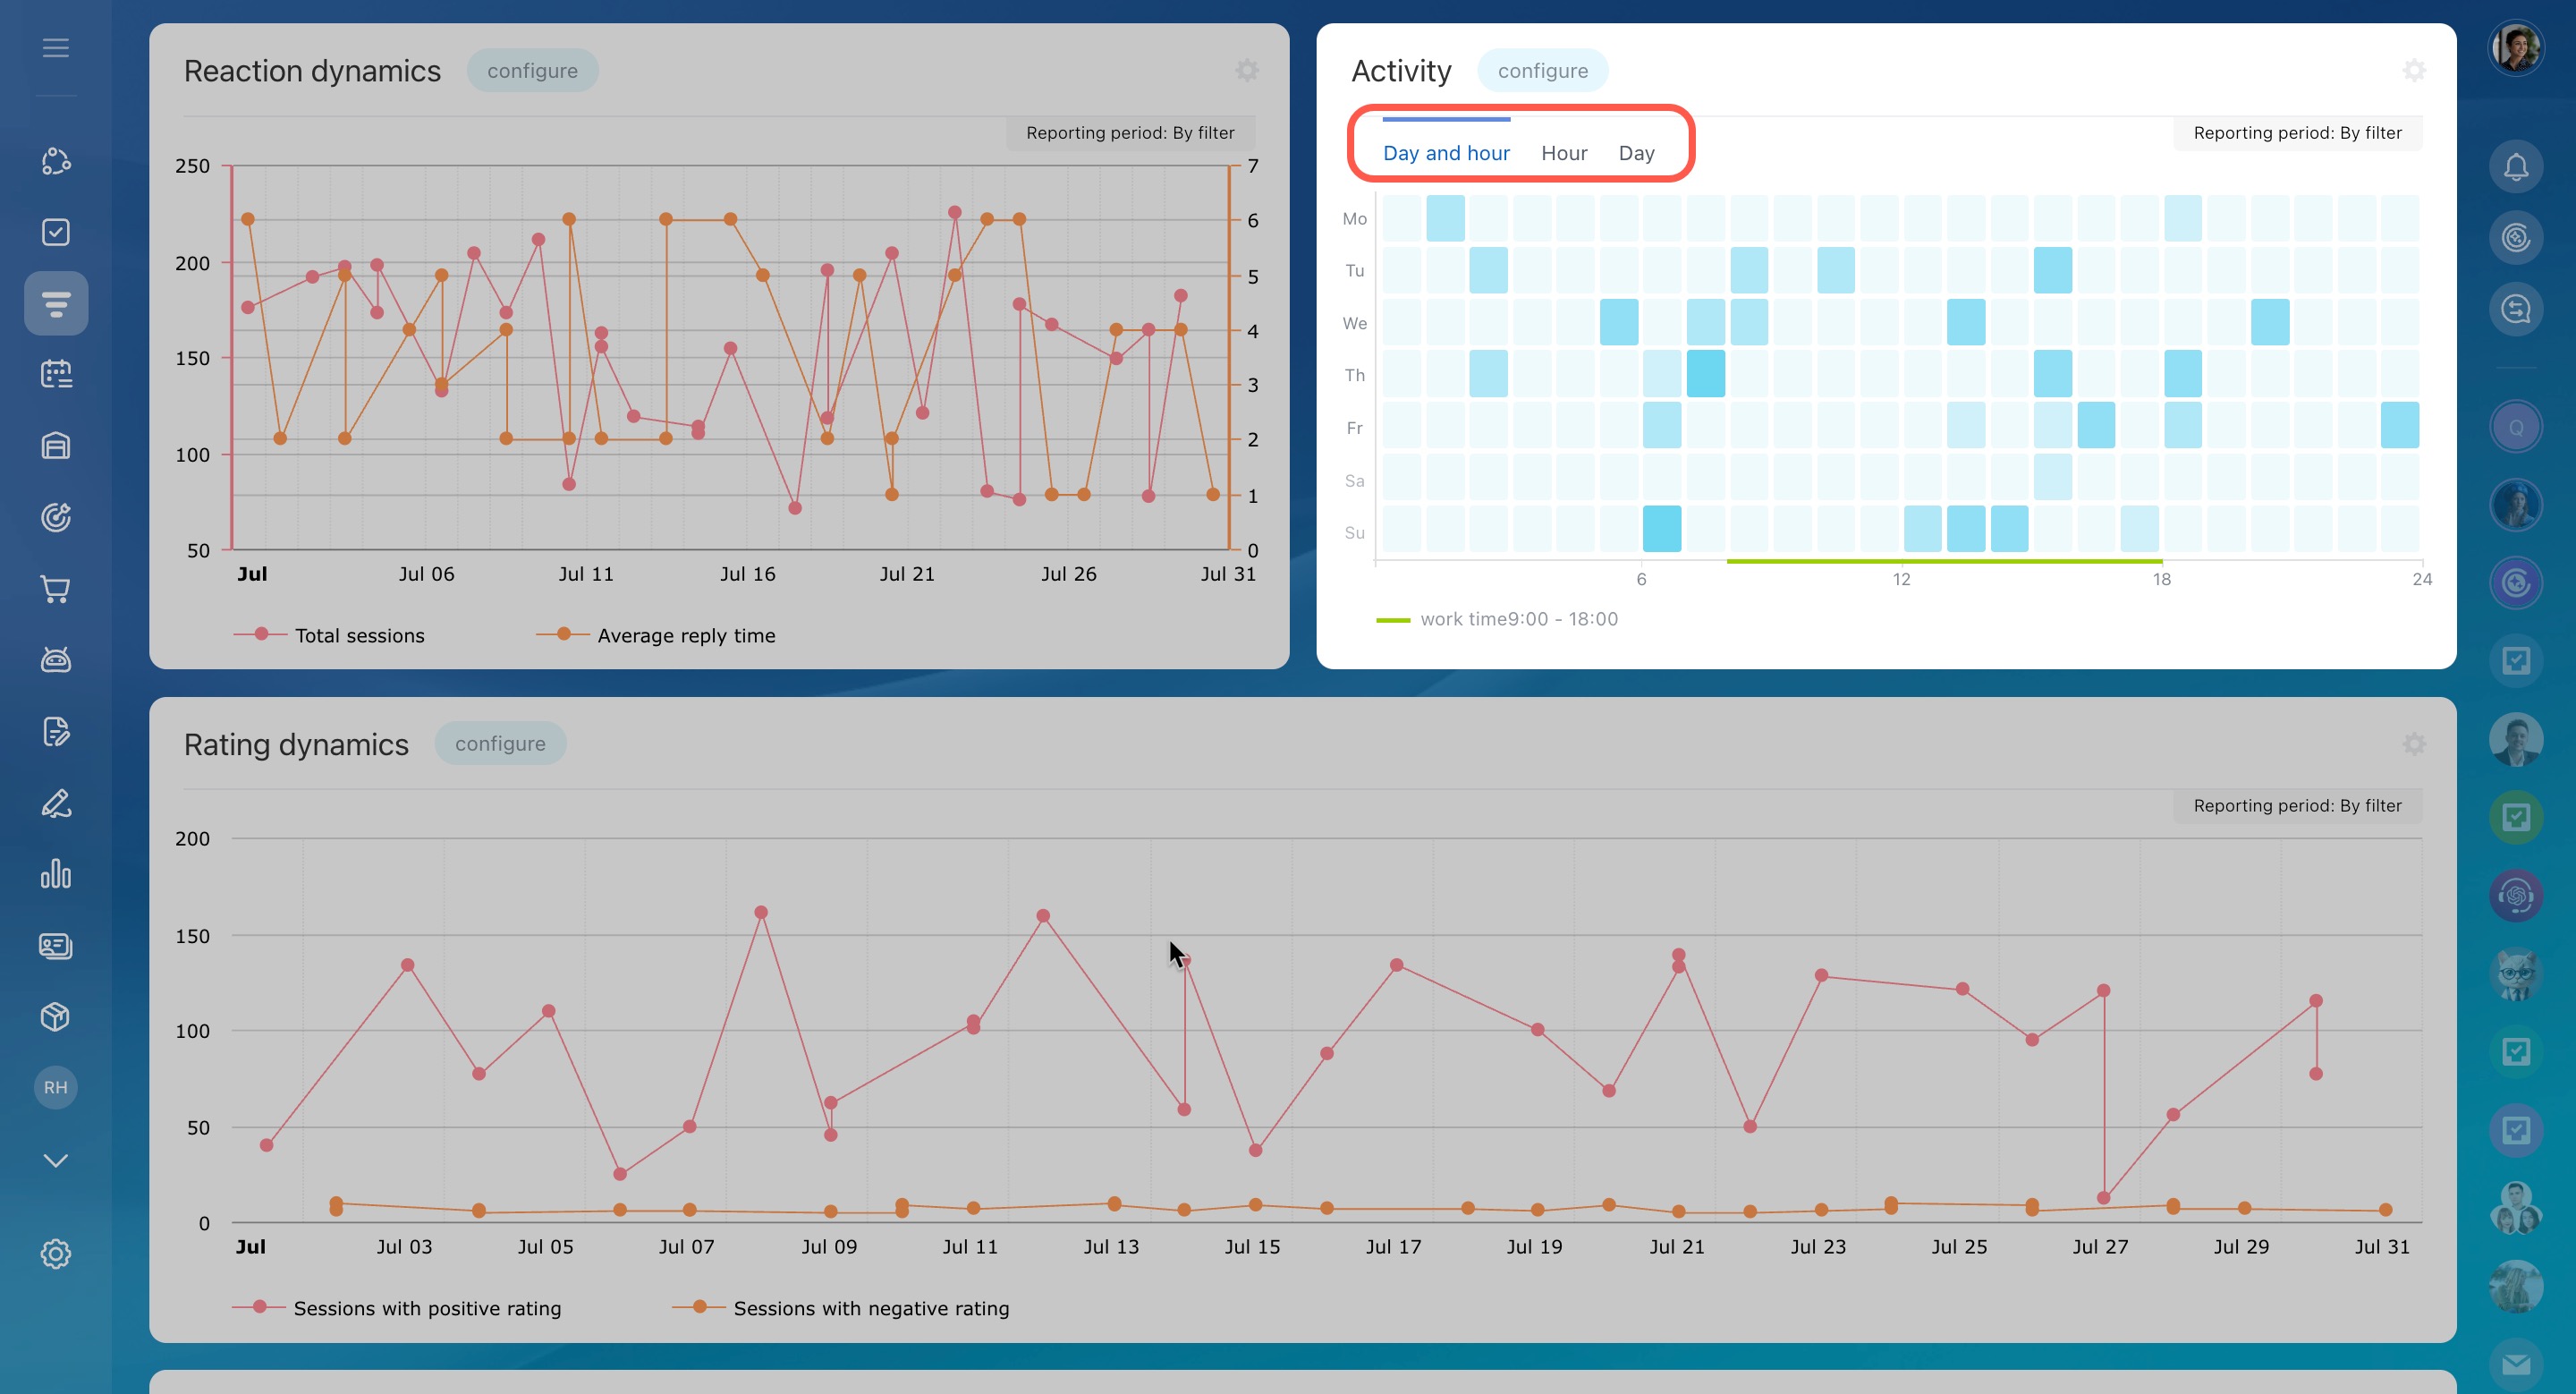
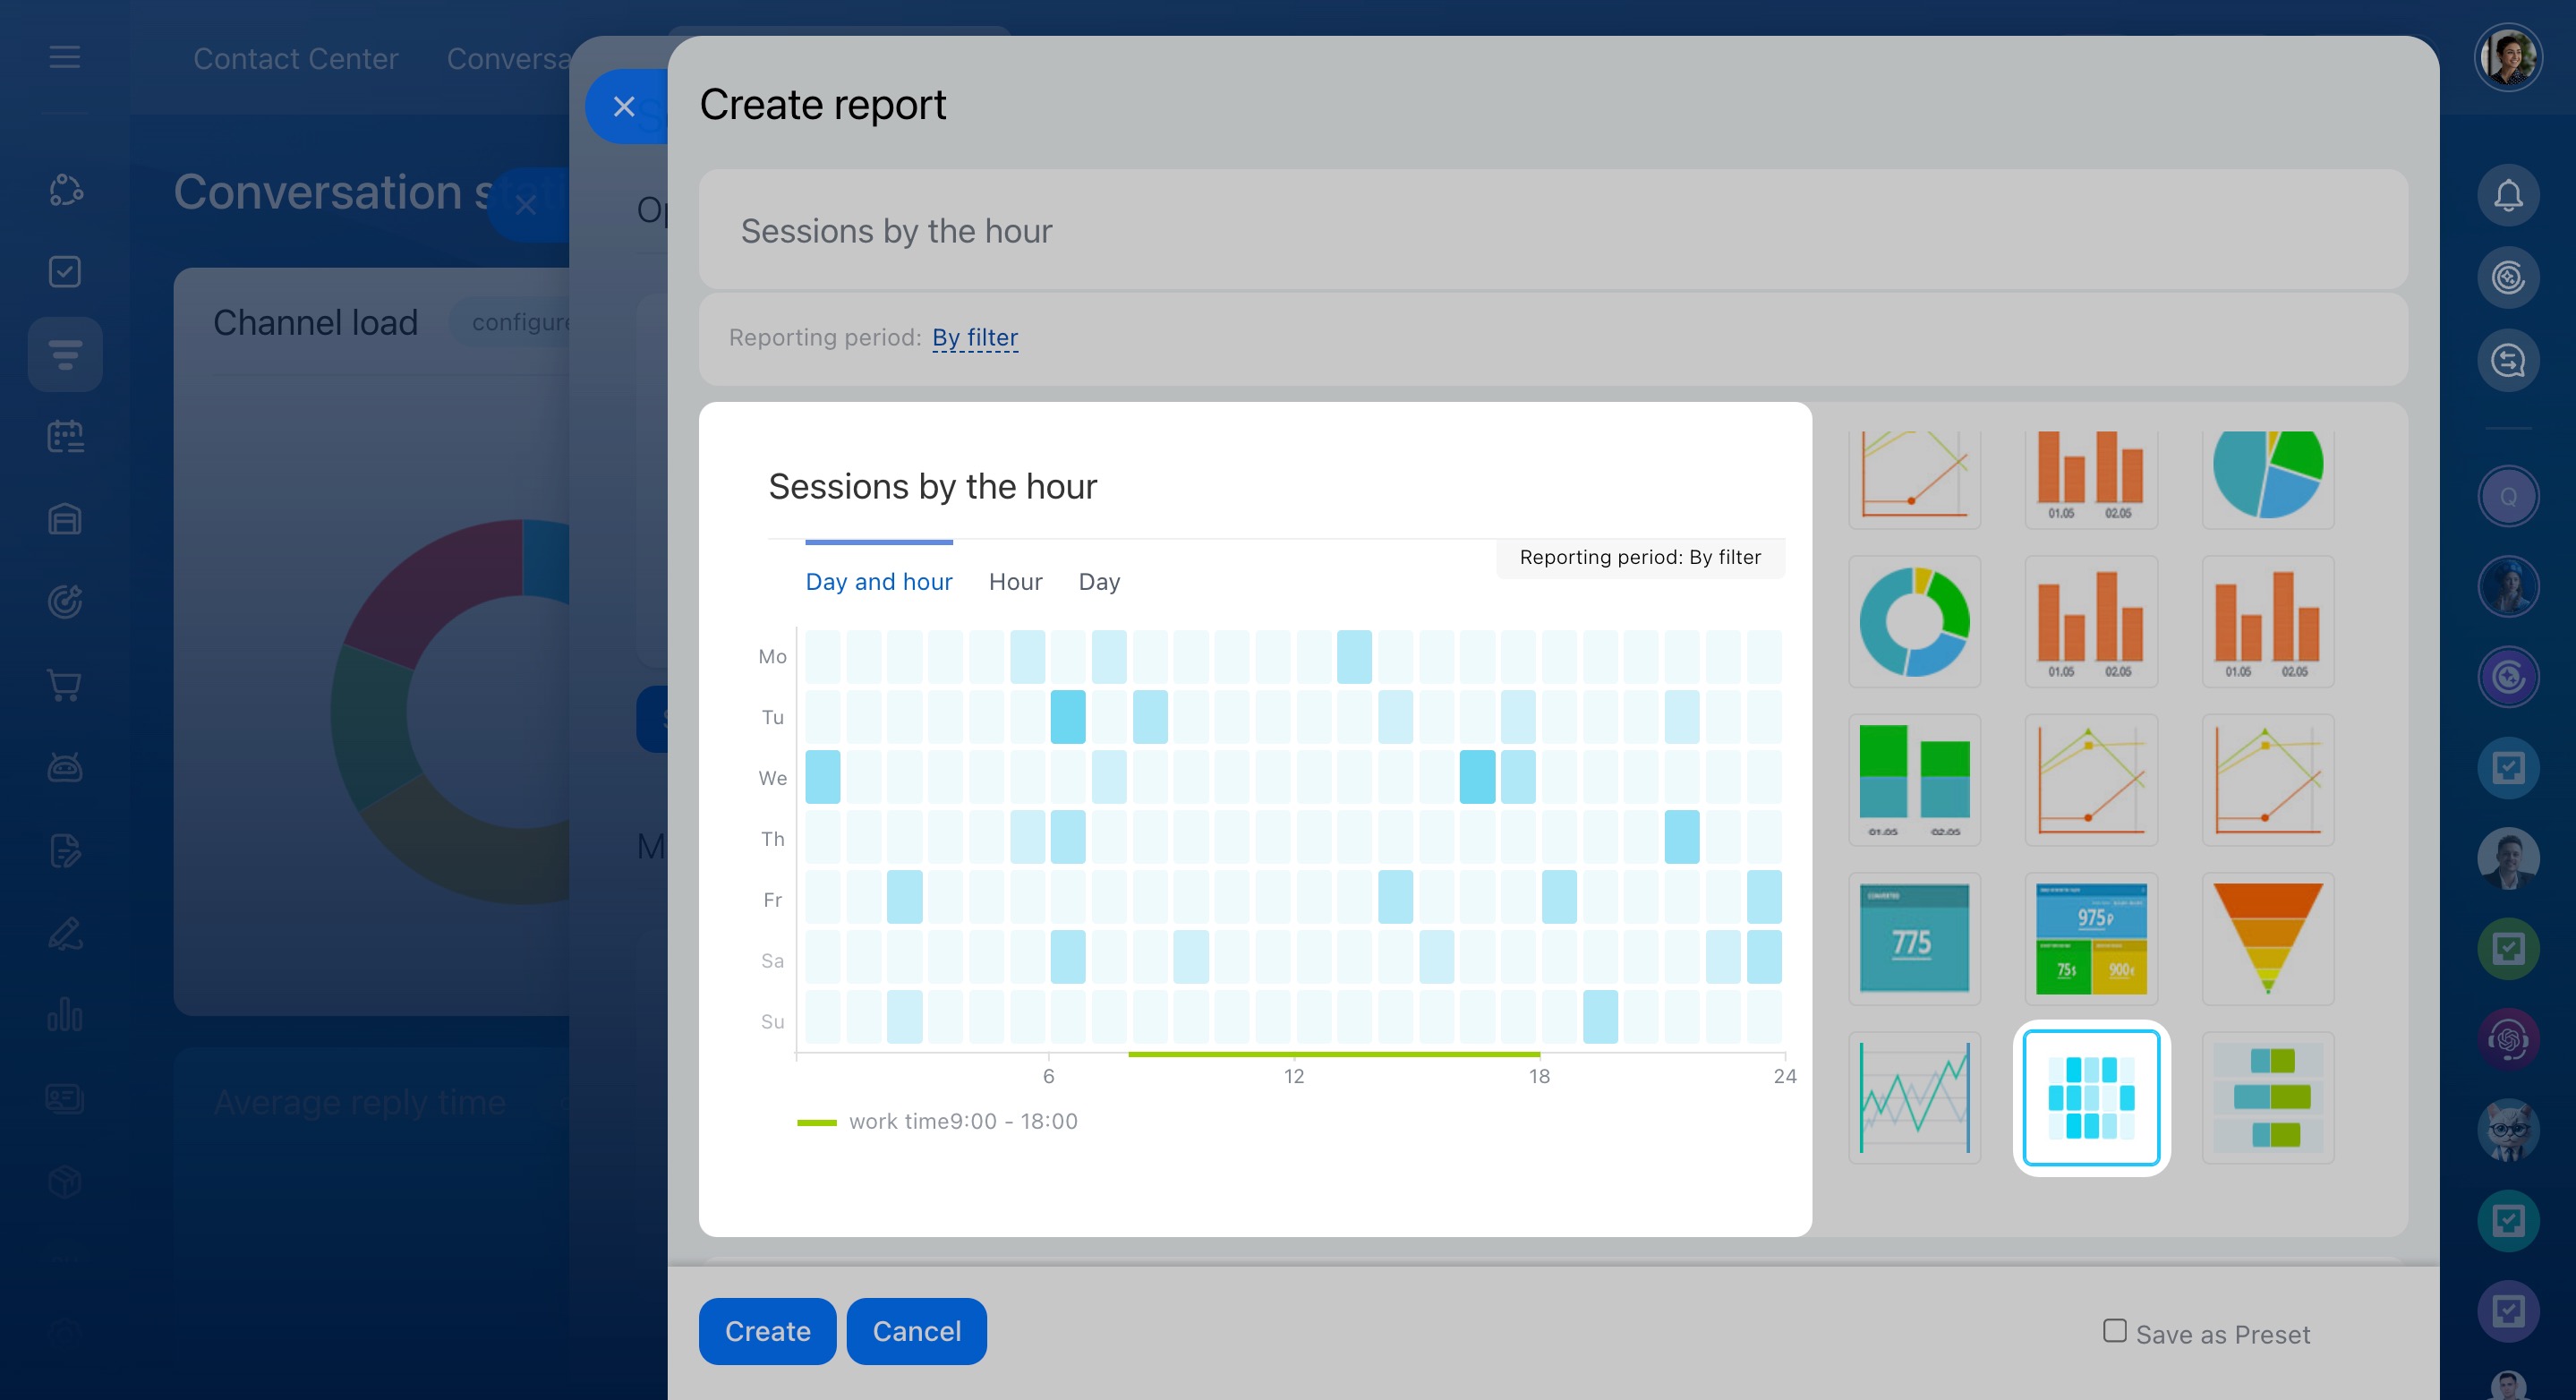
Activity. Check when customer activity peaks by day and hour, helping you organize agent shifts for prompt responses. This report includes:
- Day and hour: Total sessions by day and time
- Hour: Total sessions by hour of the day
- Day: Total sessions by day of the week
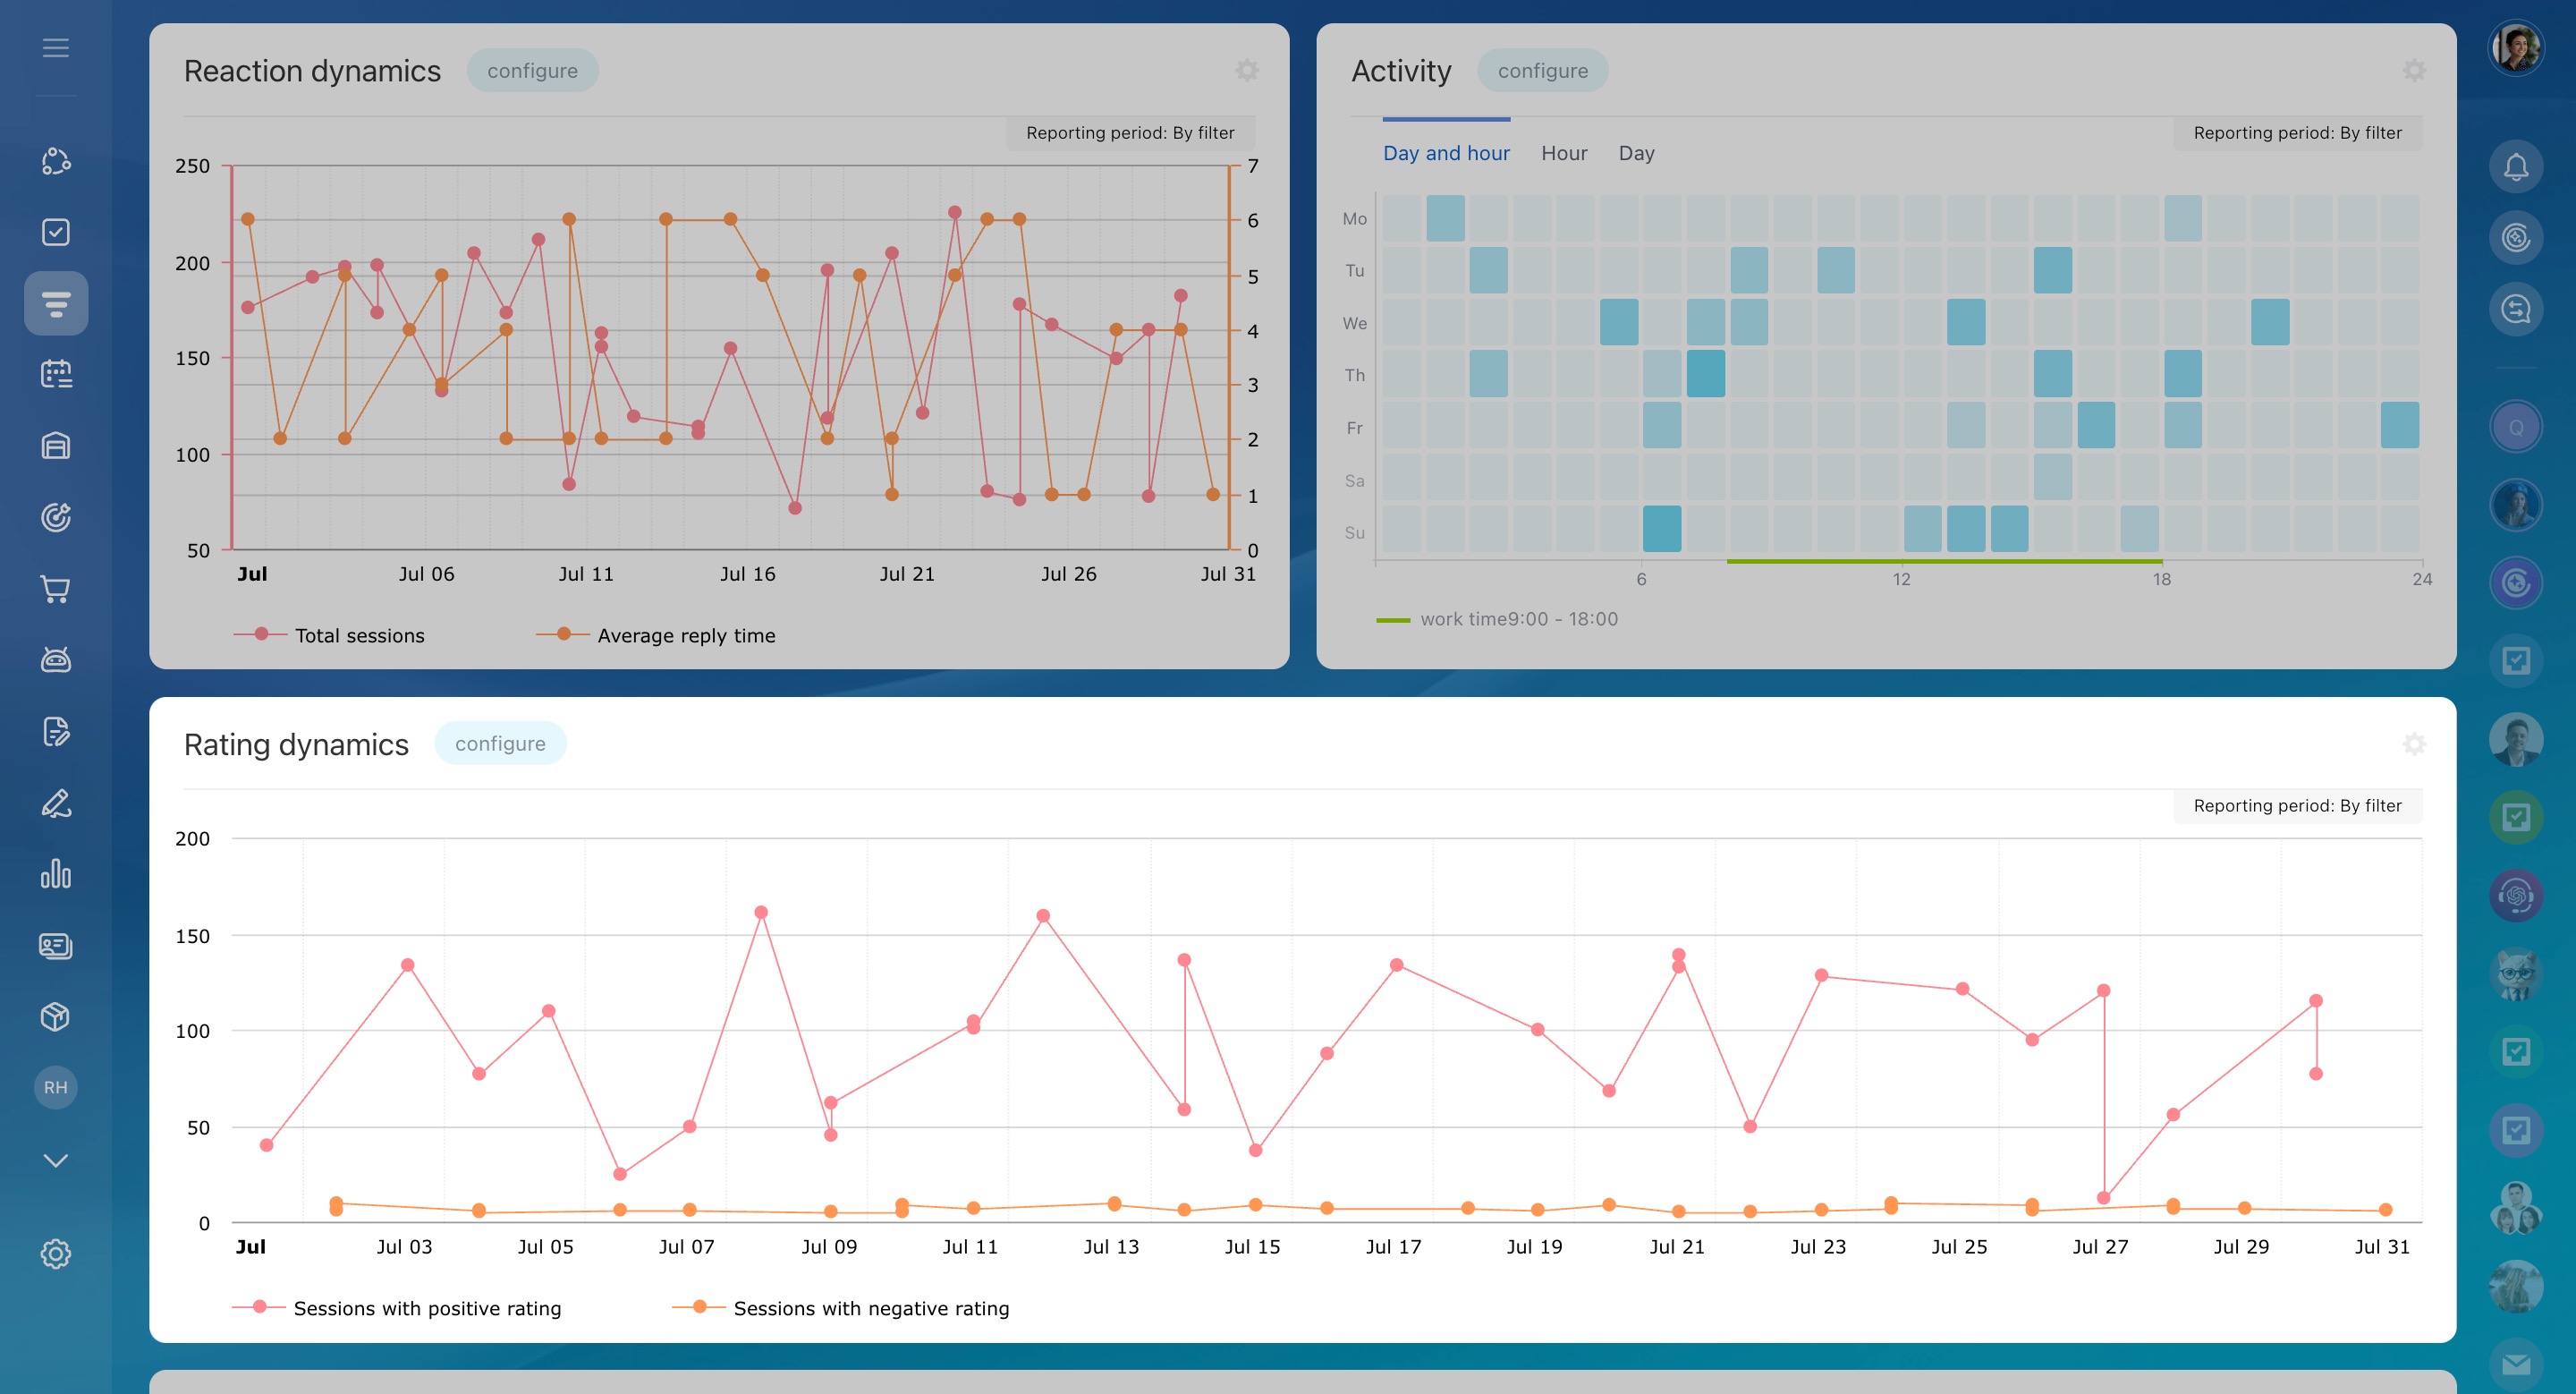
Rating dynamics. This chart shows how many positive and negative ratings you receive over the selected period. It's useful for identifying patterns, like dips in satisfaction during busy periods.
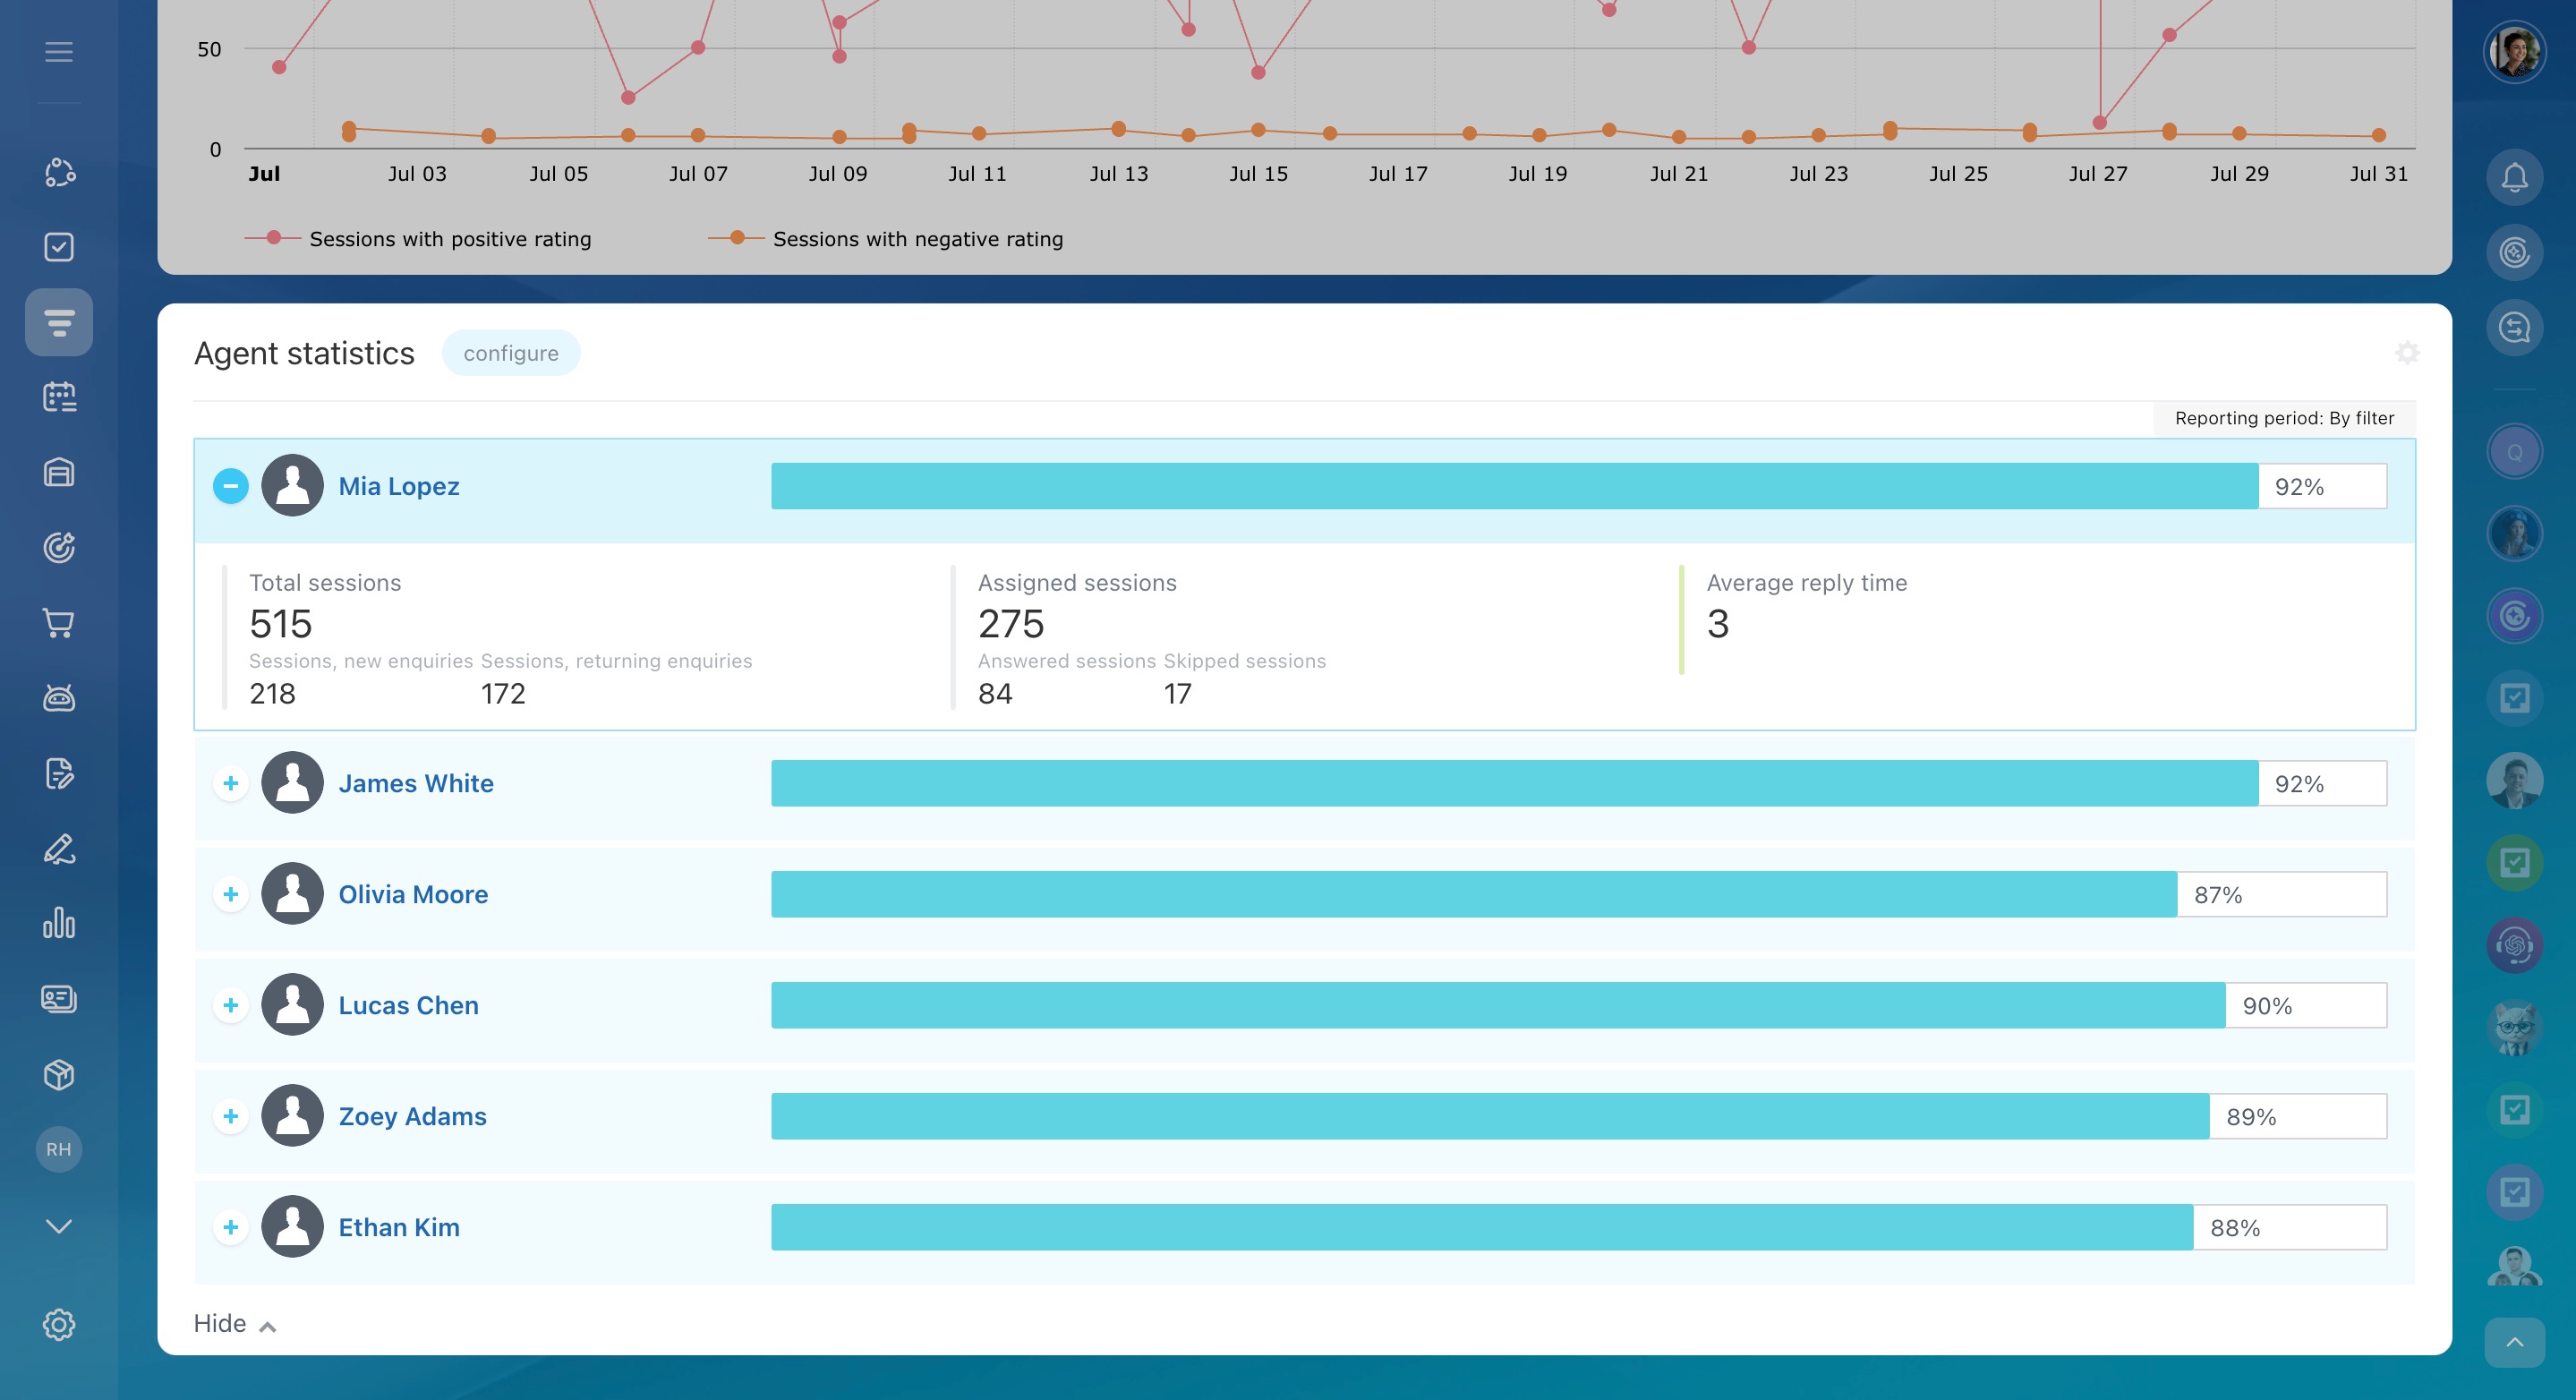
Agent statistics. This report breaks down individual agent performance:
- Satisfaction rate: The percentage of positive ratings. For example, 75% means 75 out of 100 chats were rated positively. If there are no ratings or all are negative, it shows 0%.
- Total sessions: The number of chats an agent handled (including completed, ongoing, and queued), with a breakdown of new and returning enquiries.
- Assigned sessions: The number of chats assigned to an agent (including both answered and skipped).
- Average reply time: The average time (in minutes) customers waited for a reply.
Working with Open Channel chats in the Conversations section
Set a reporting period
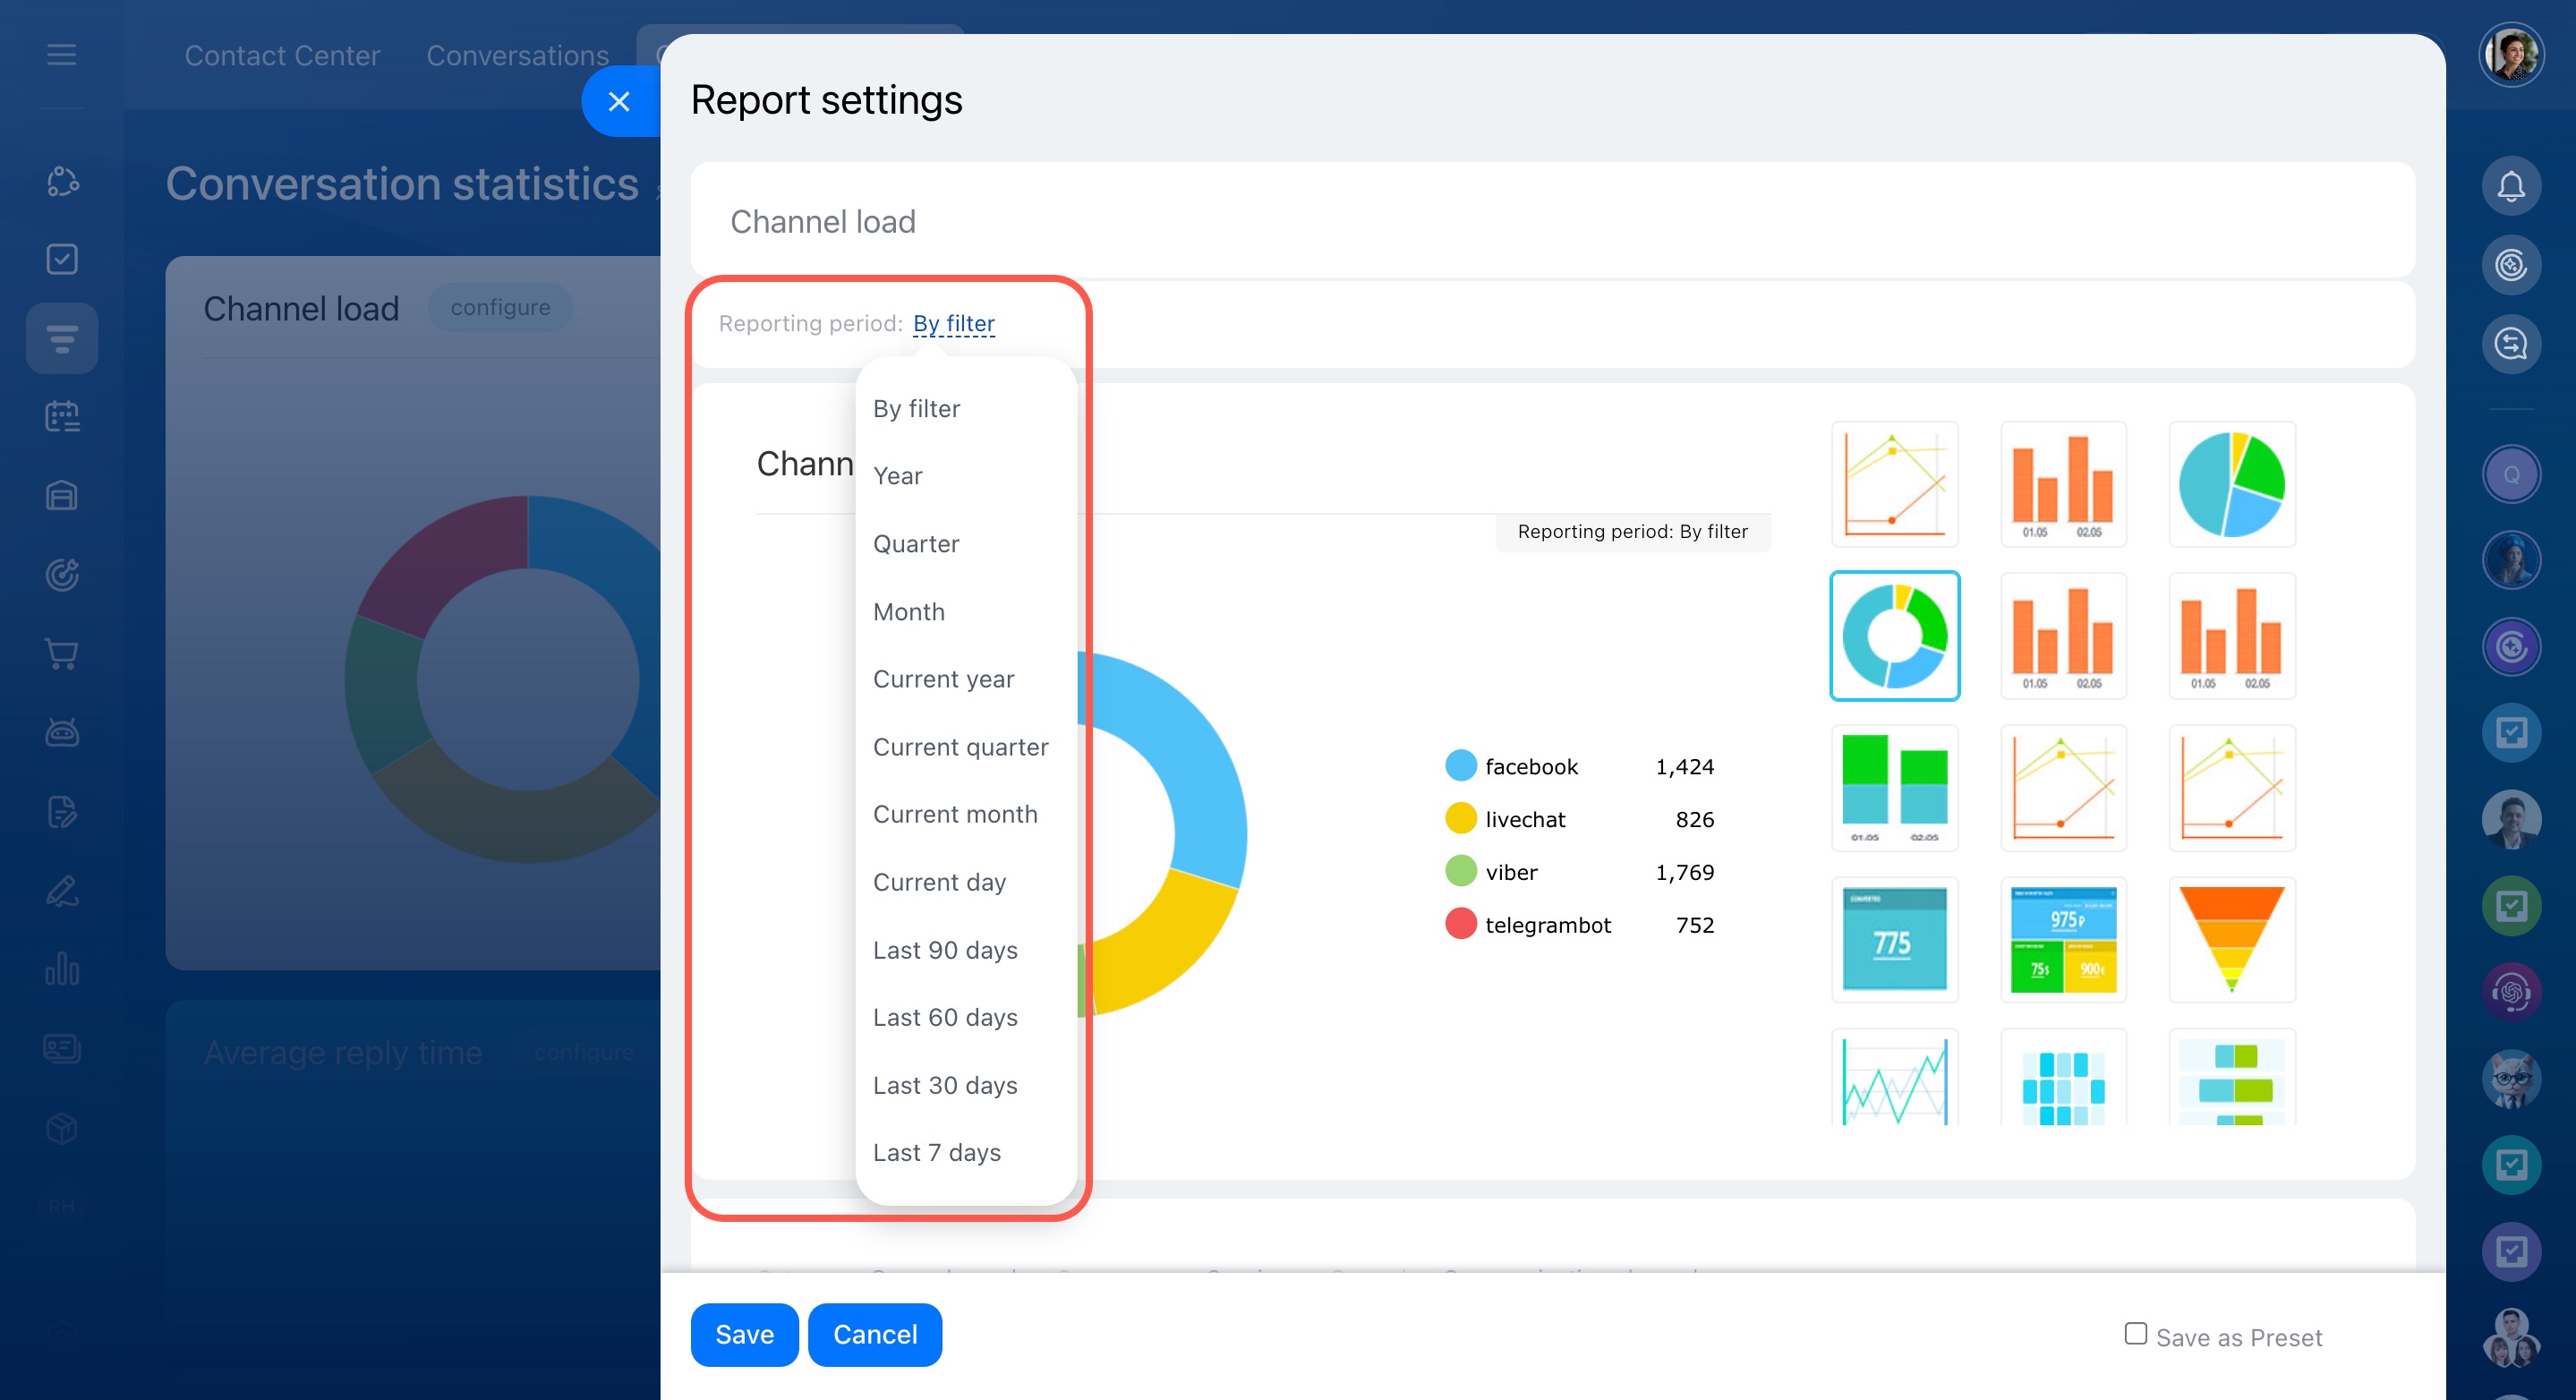
All reports use the same period by default, but you can set different periods for each report.
- Click Configure next to the report name.
- In the Reporting period section, select the period you need.
Create a report
You can create a custom report if built-in ones don’t meet your needs. For example, compare agent workloads or track changes in daily reply times.
To create a report:
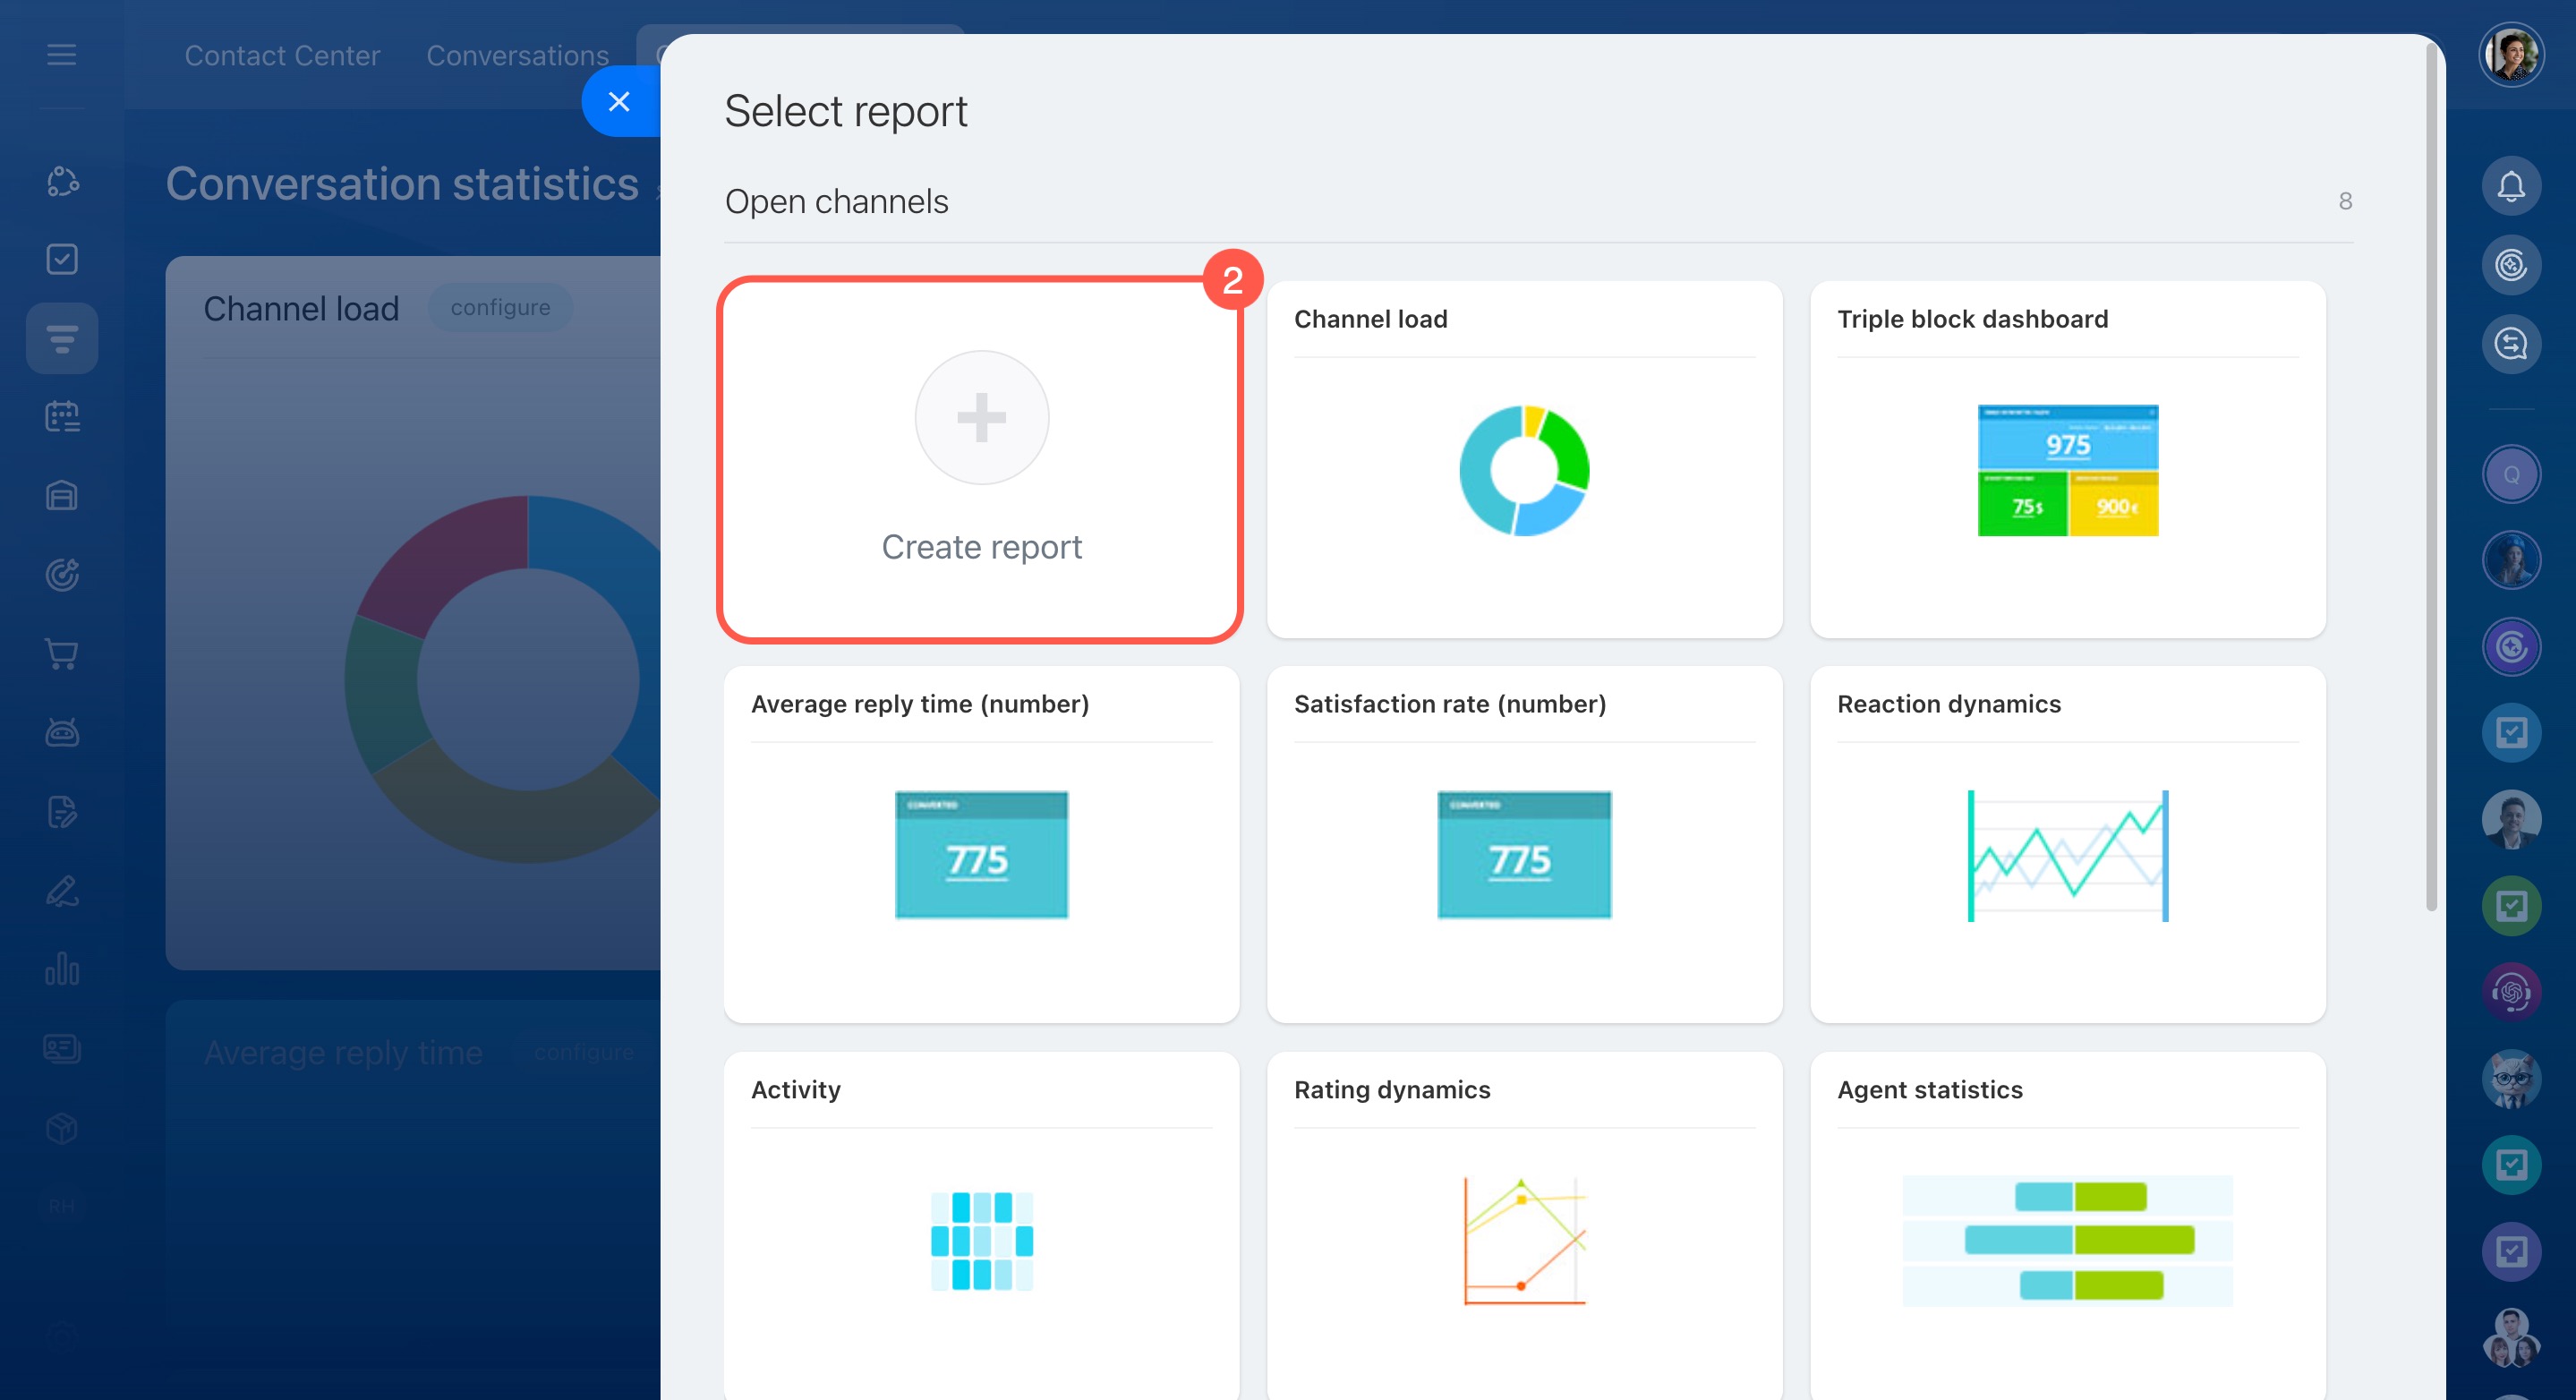
- Click Add widget.
- Select Create report.
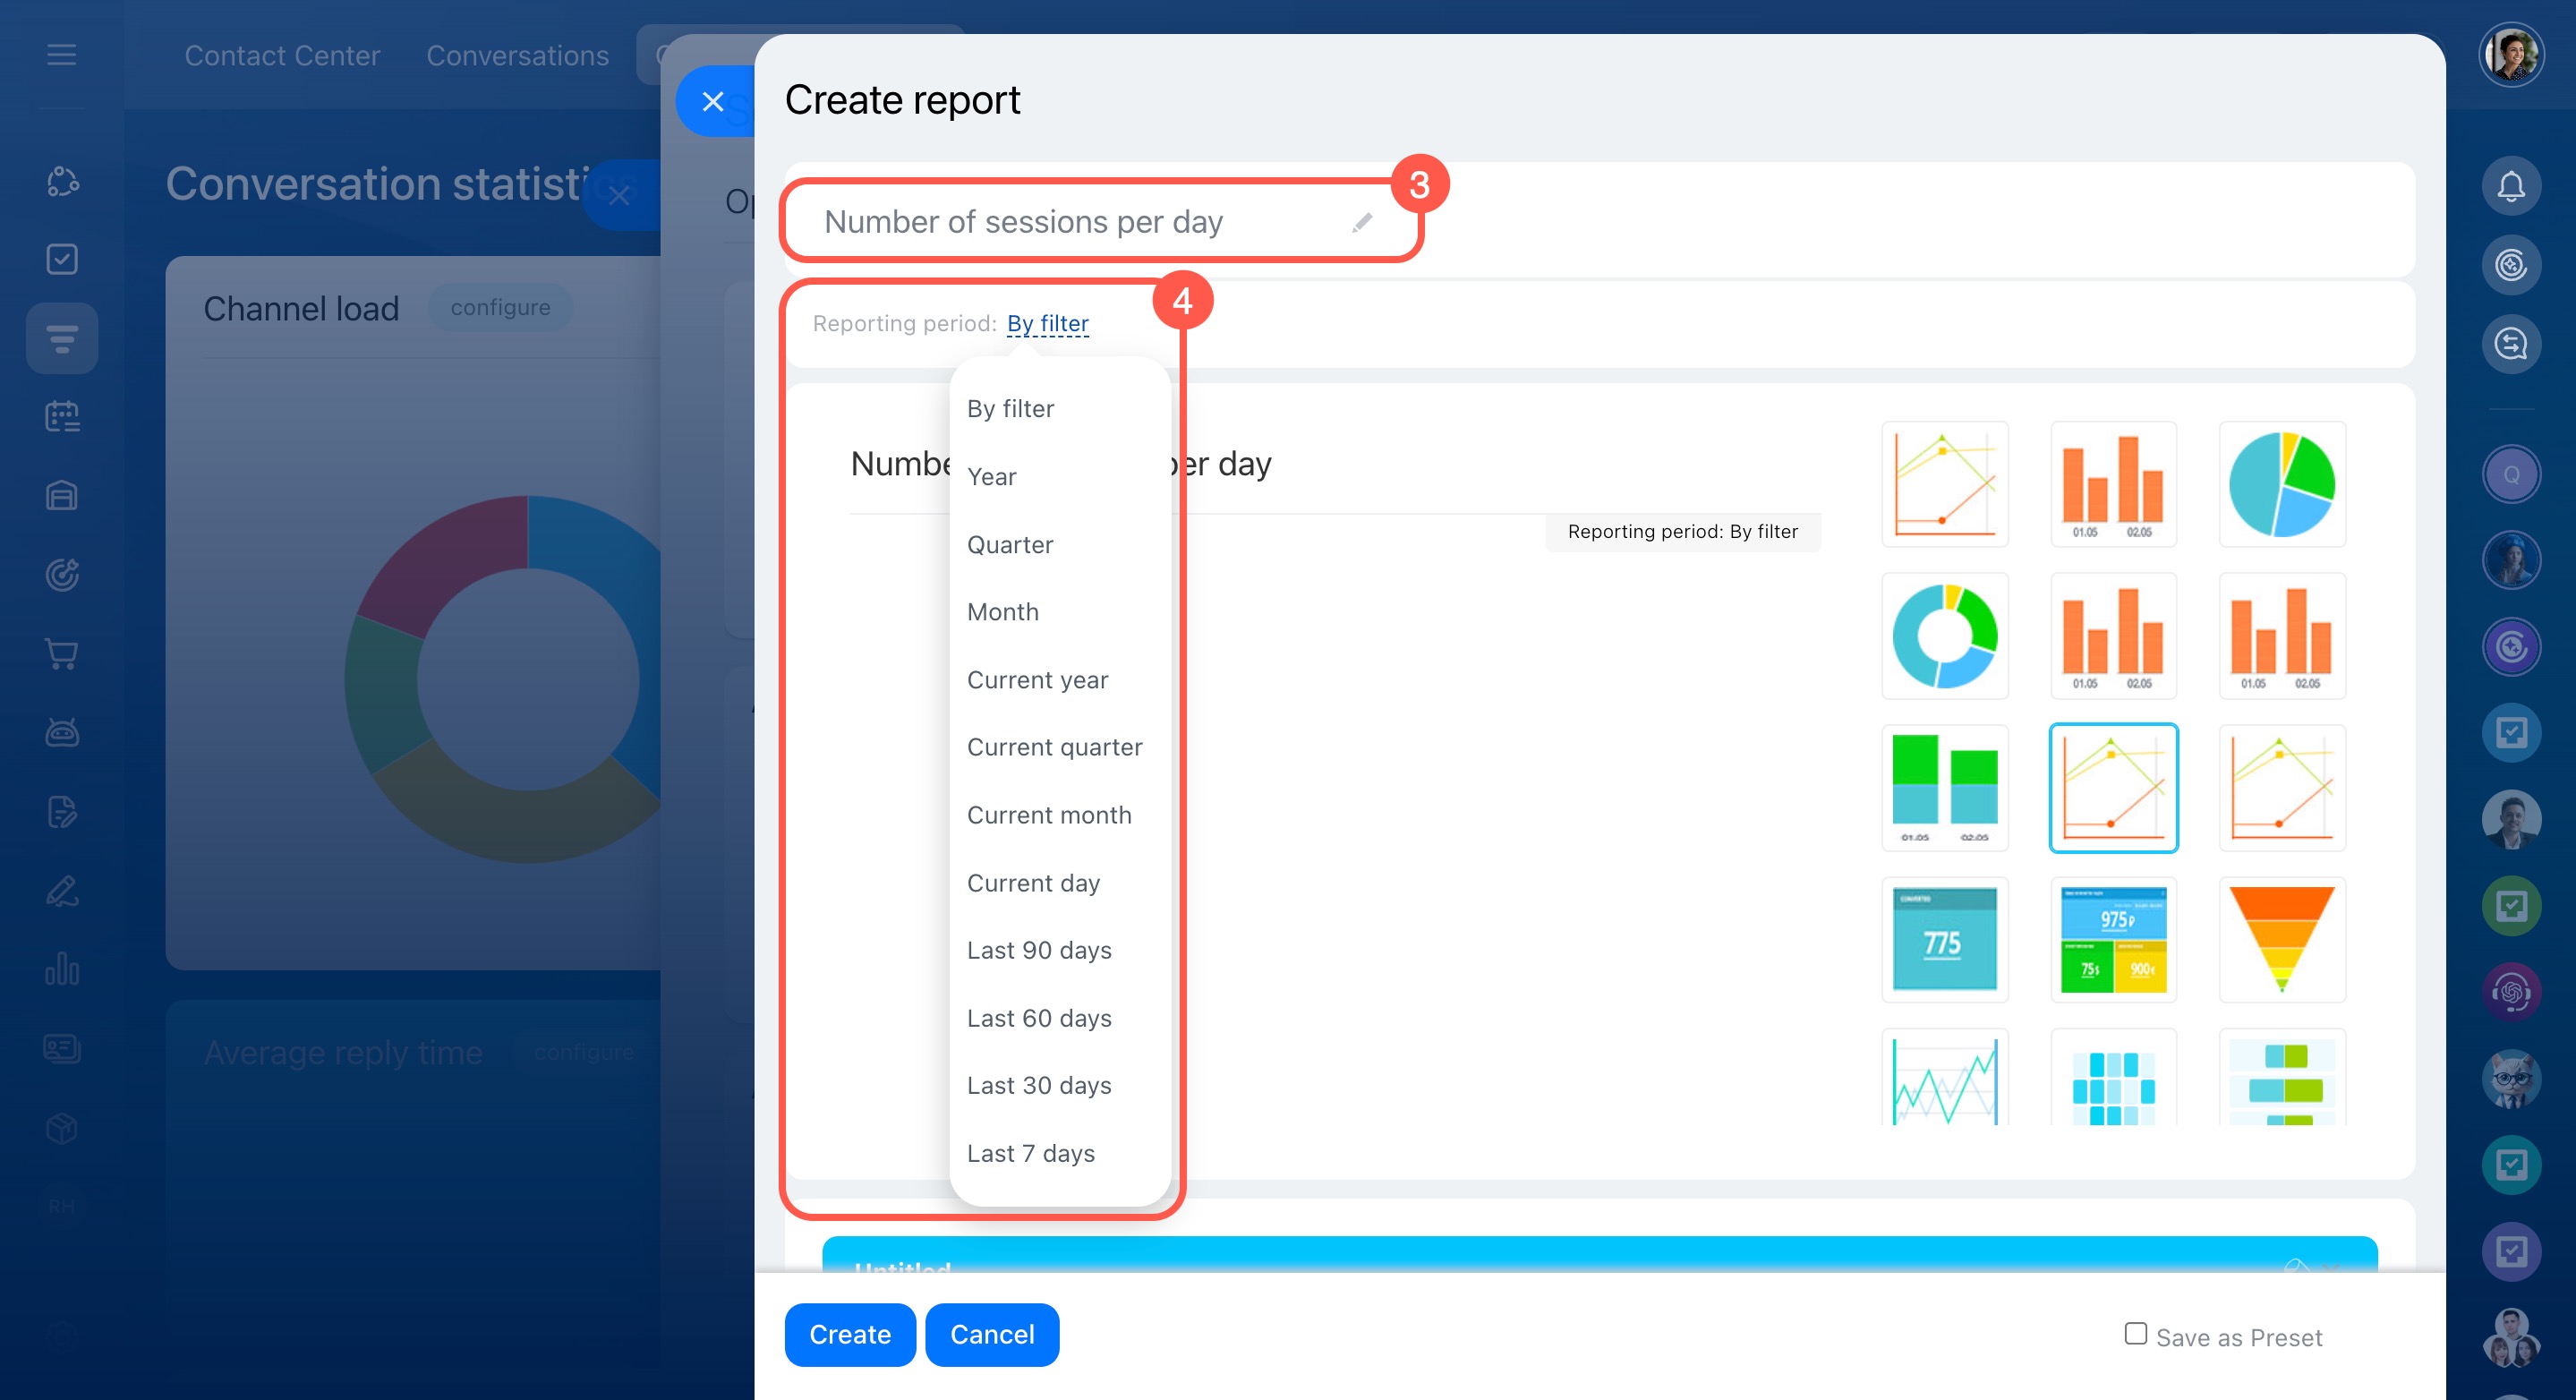
- Enter a report name.
- Select a report period.
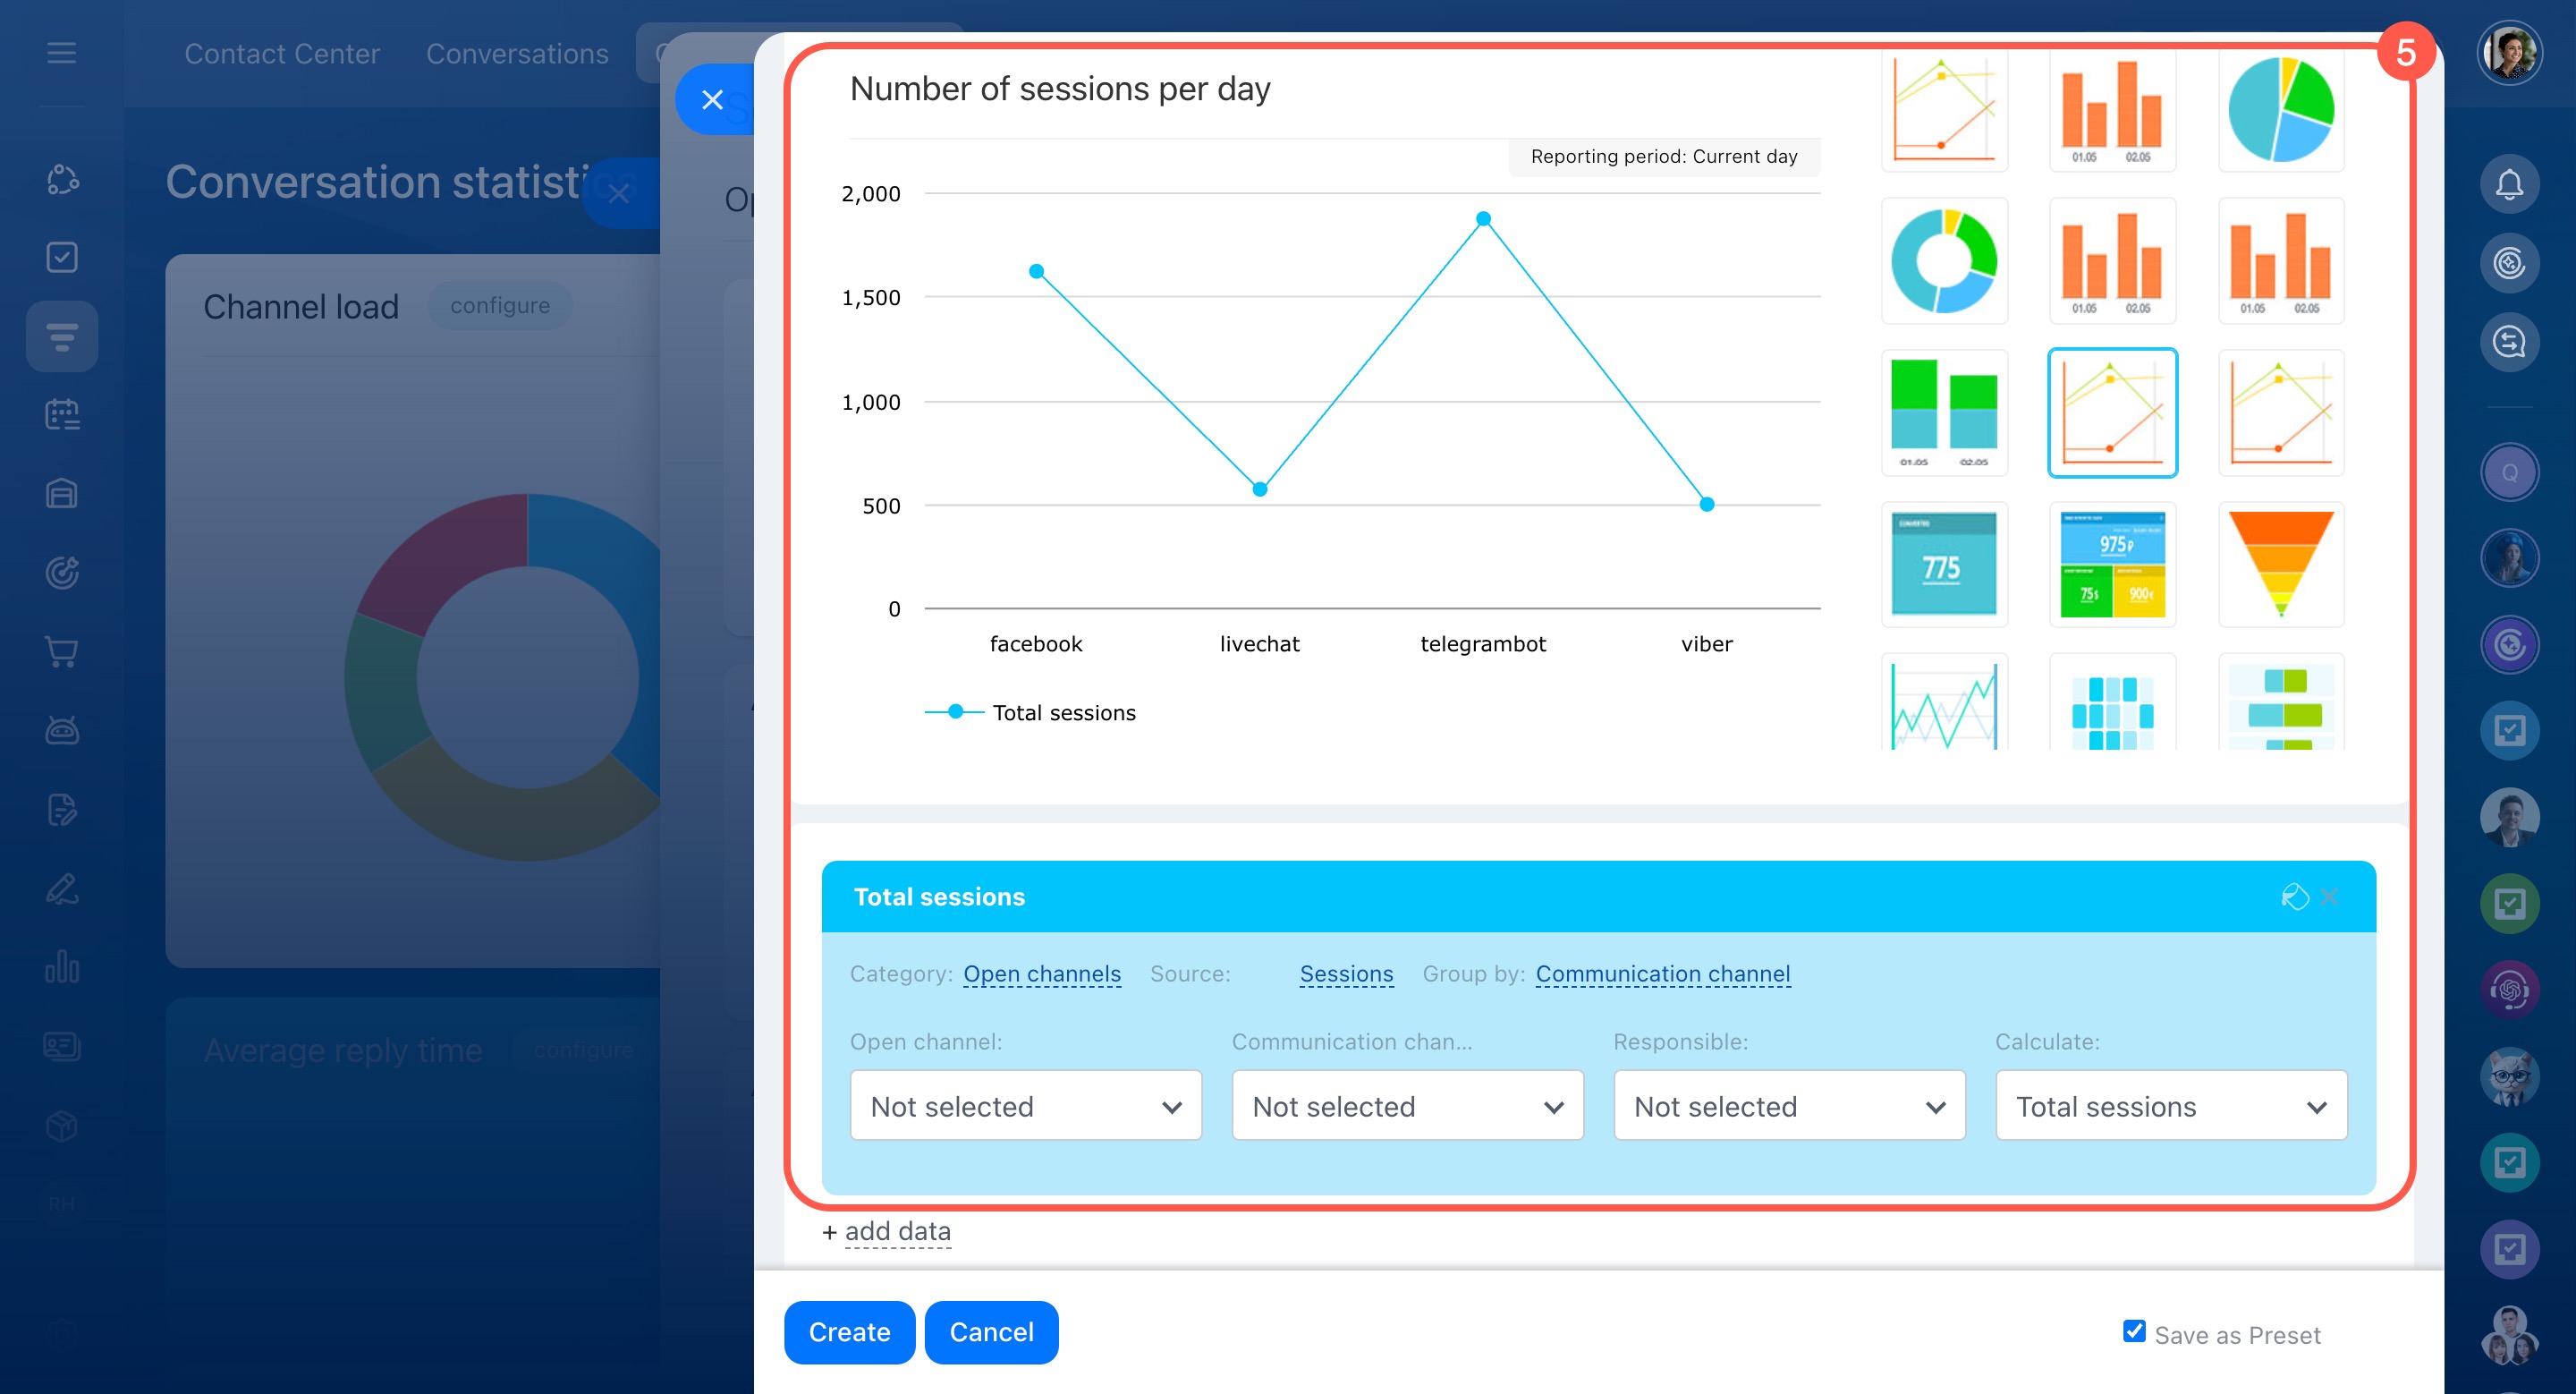
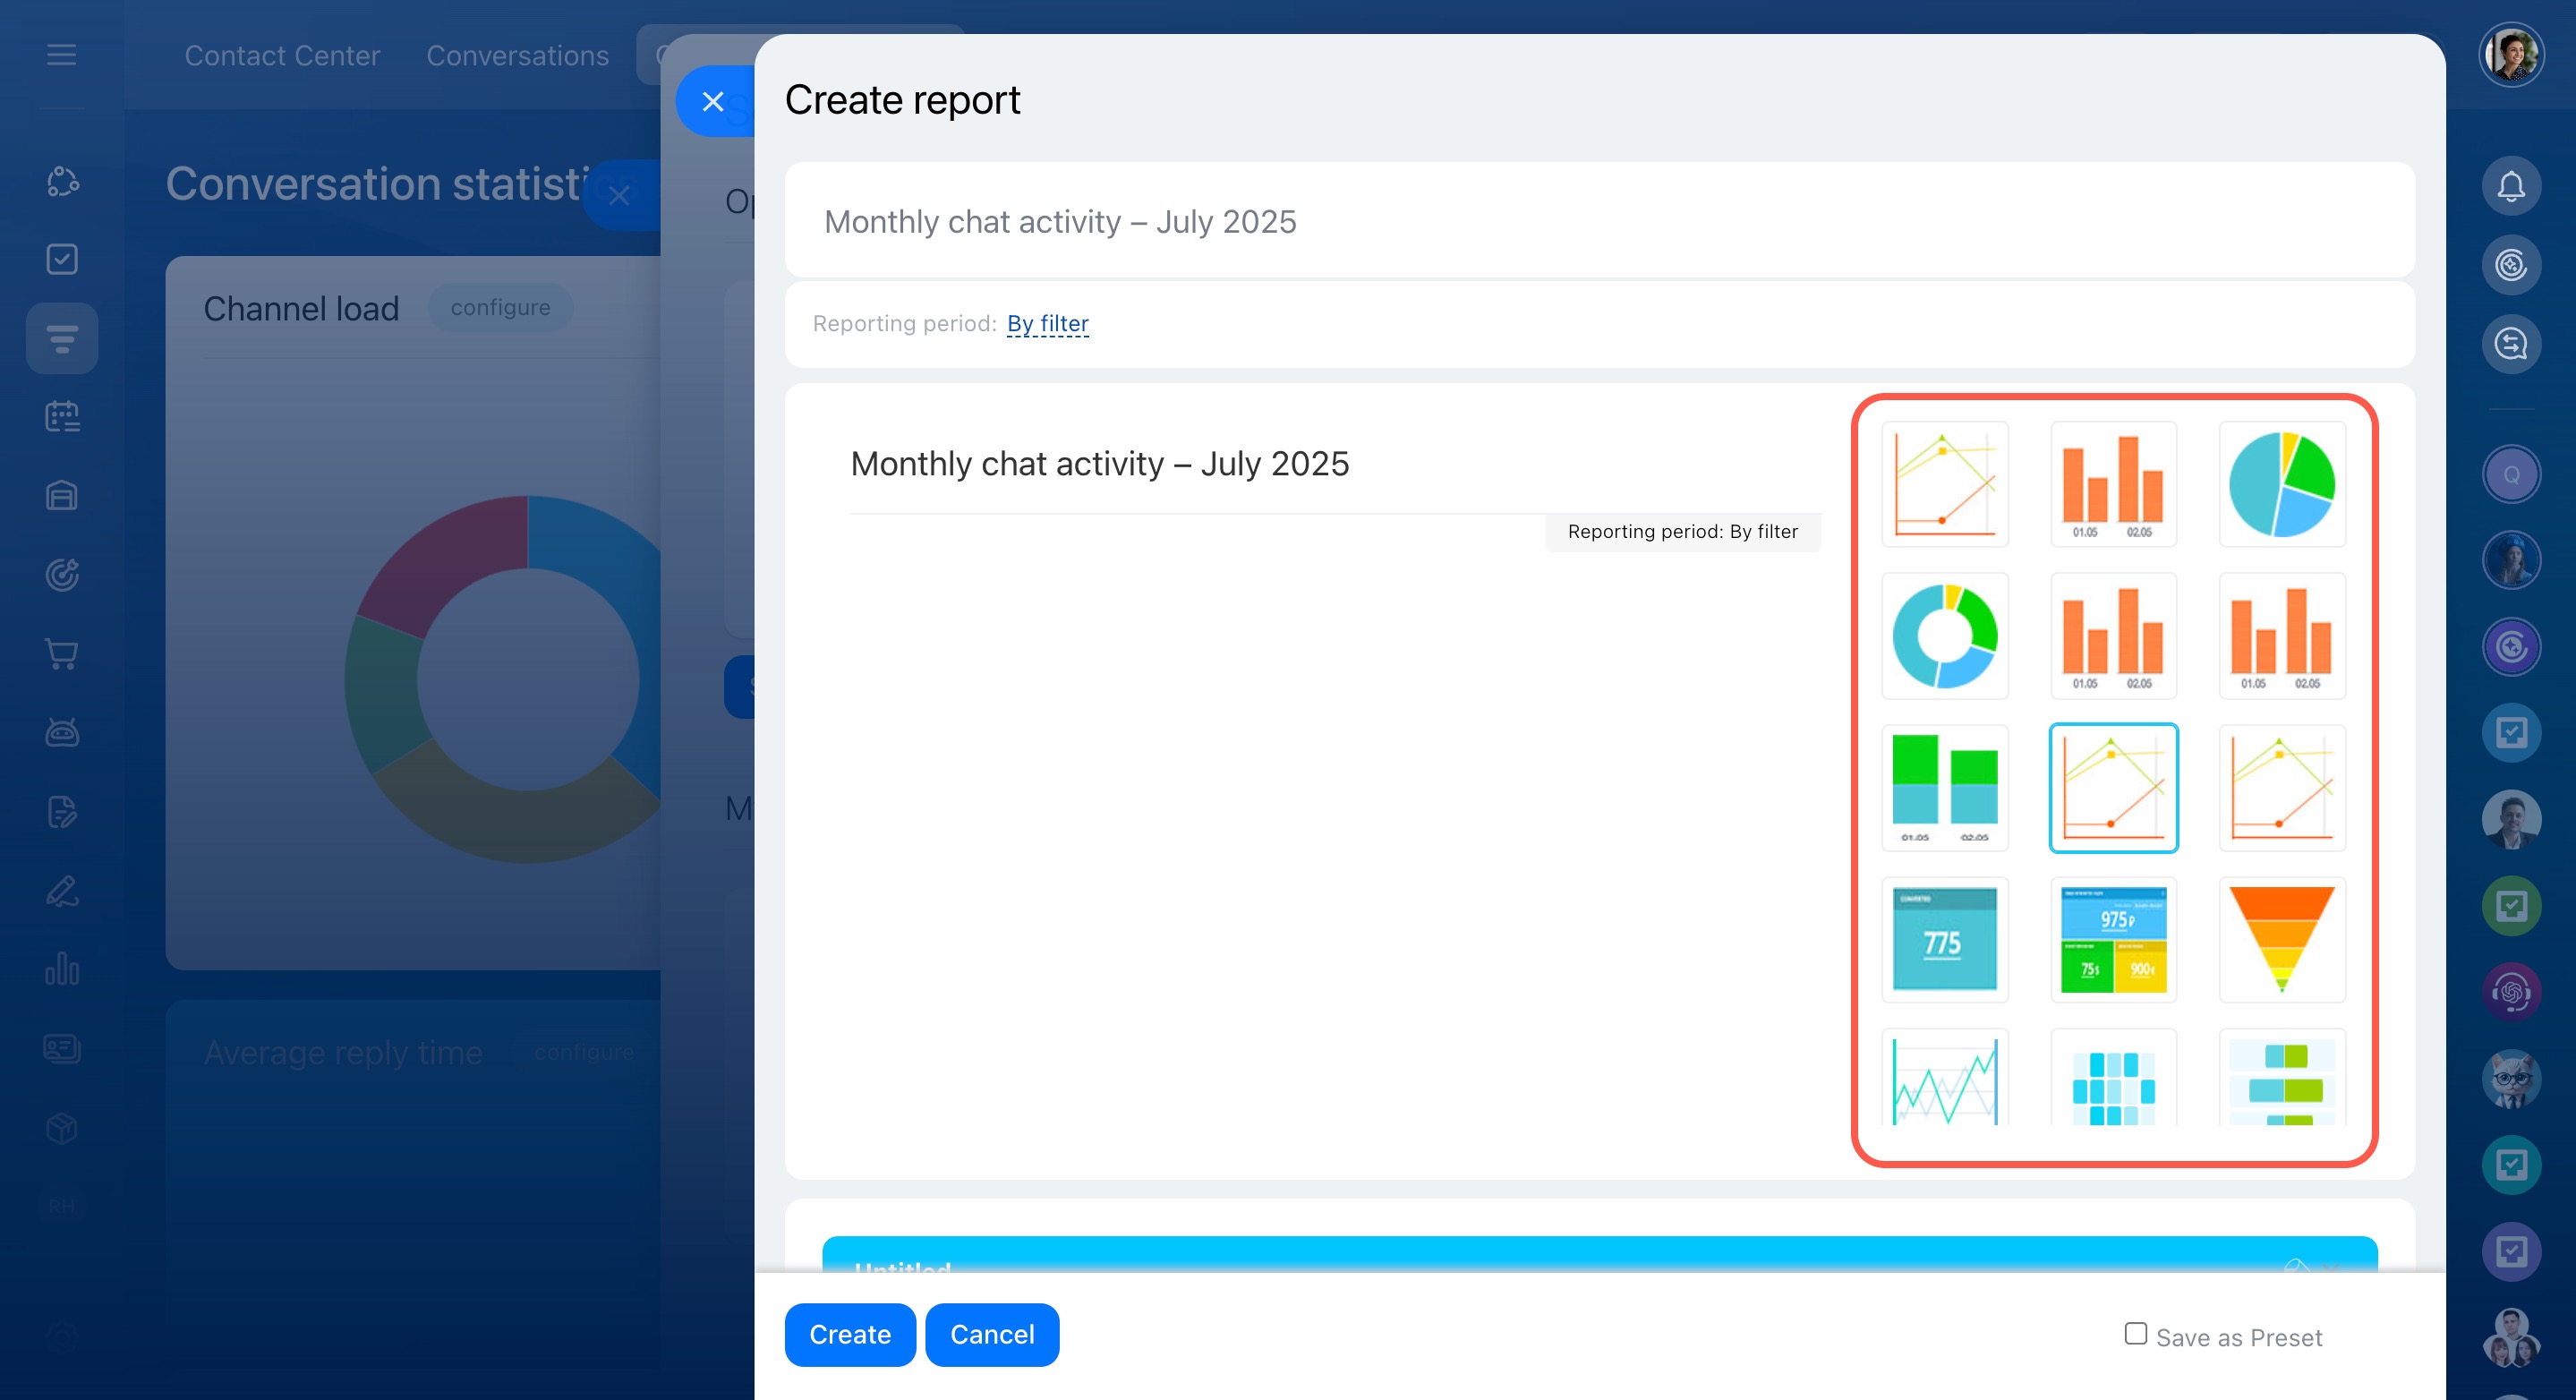
- Customize the report by choosing a display type and parameters.
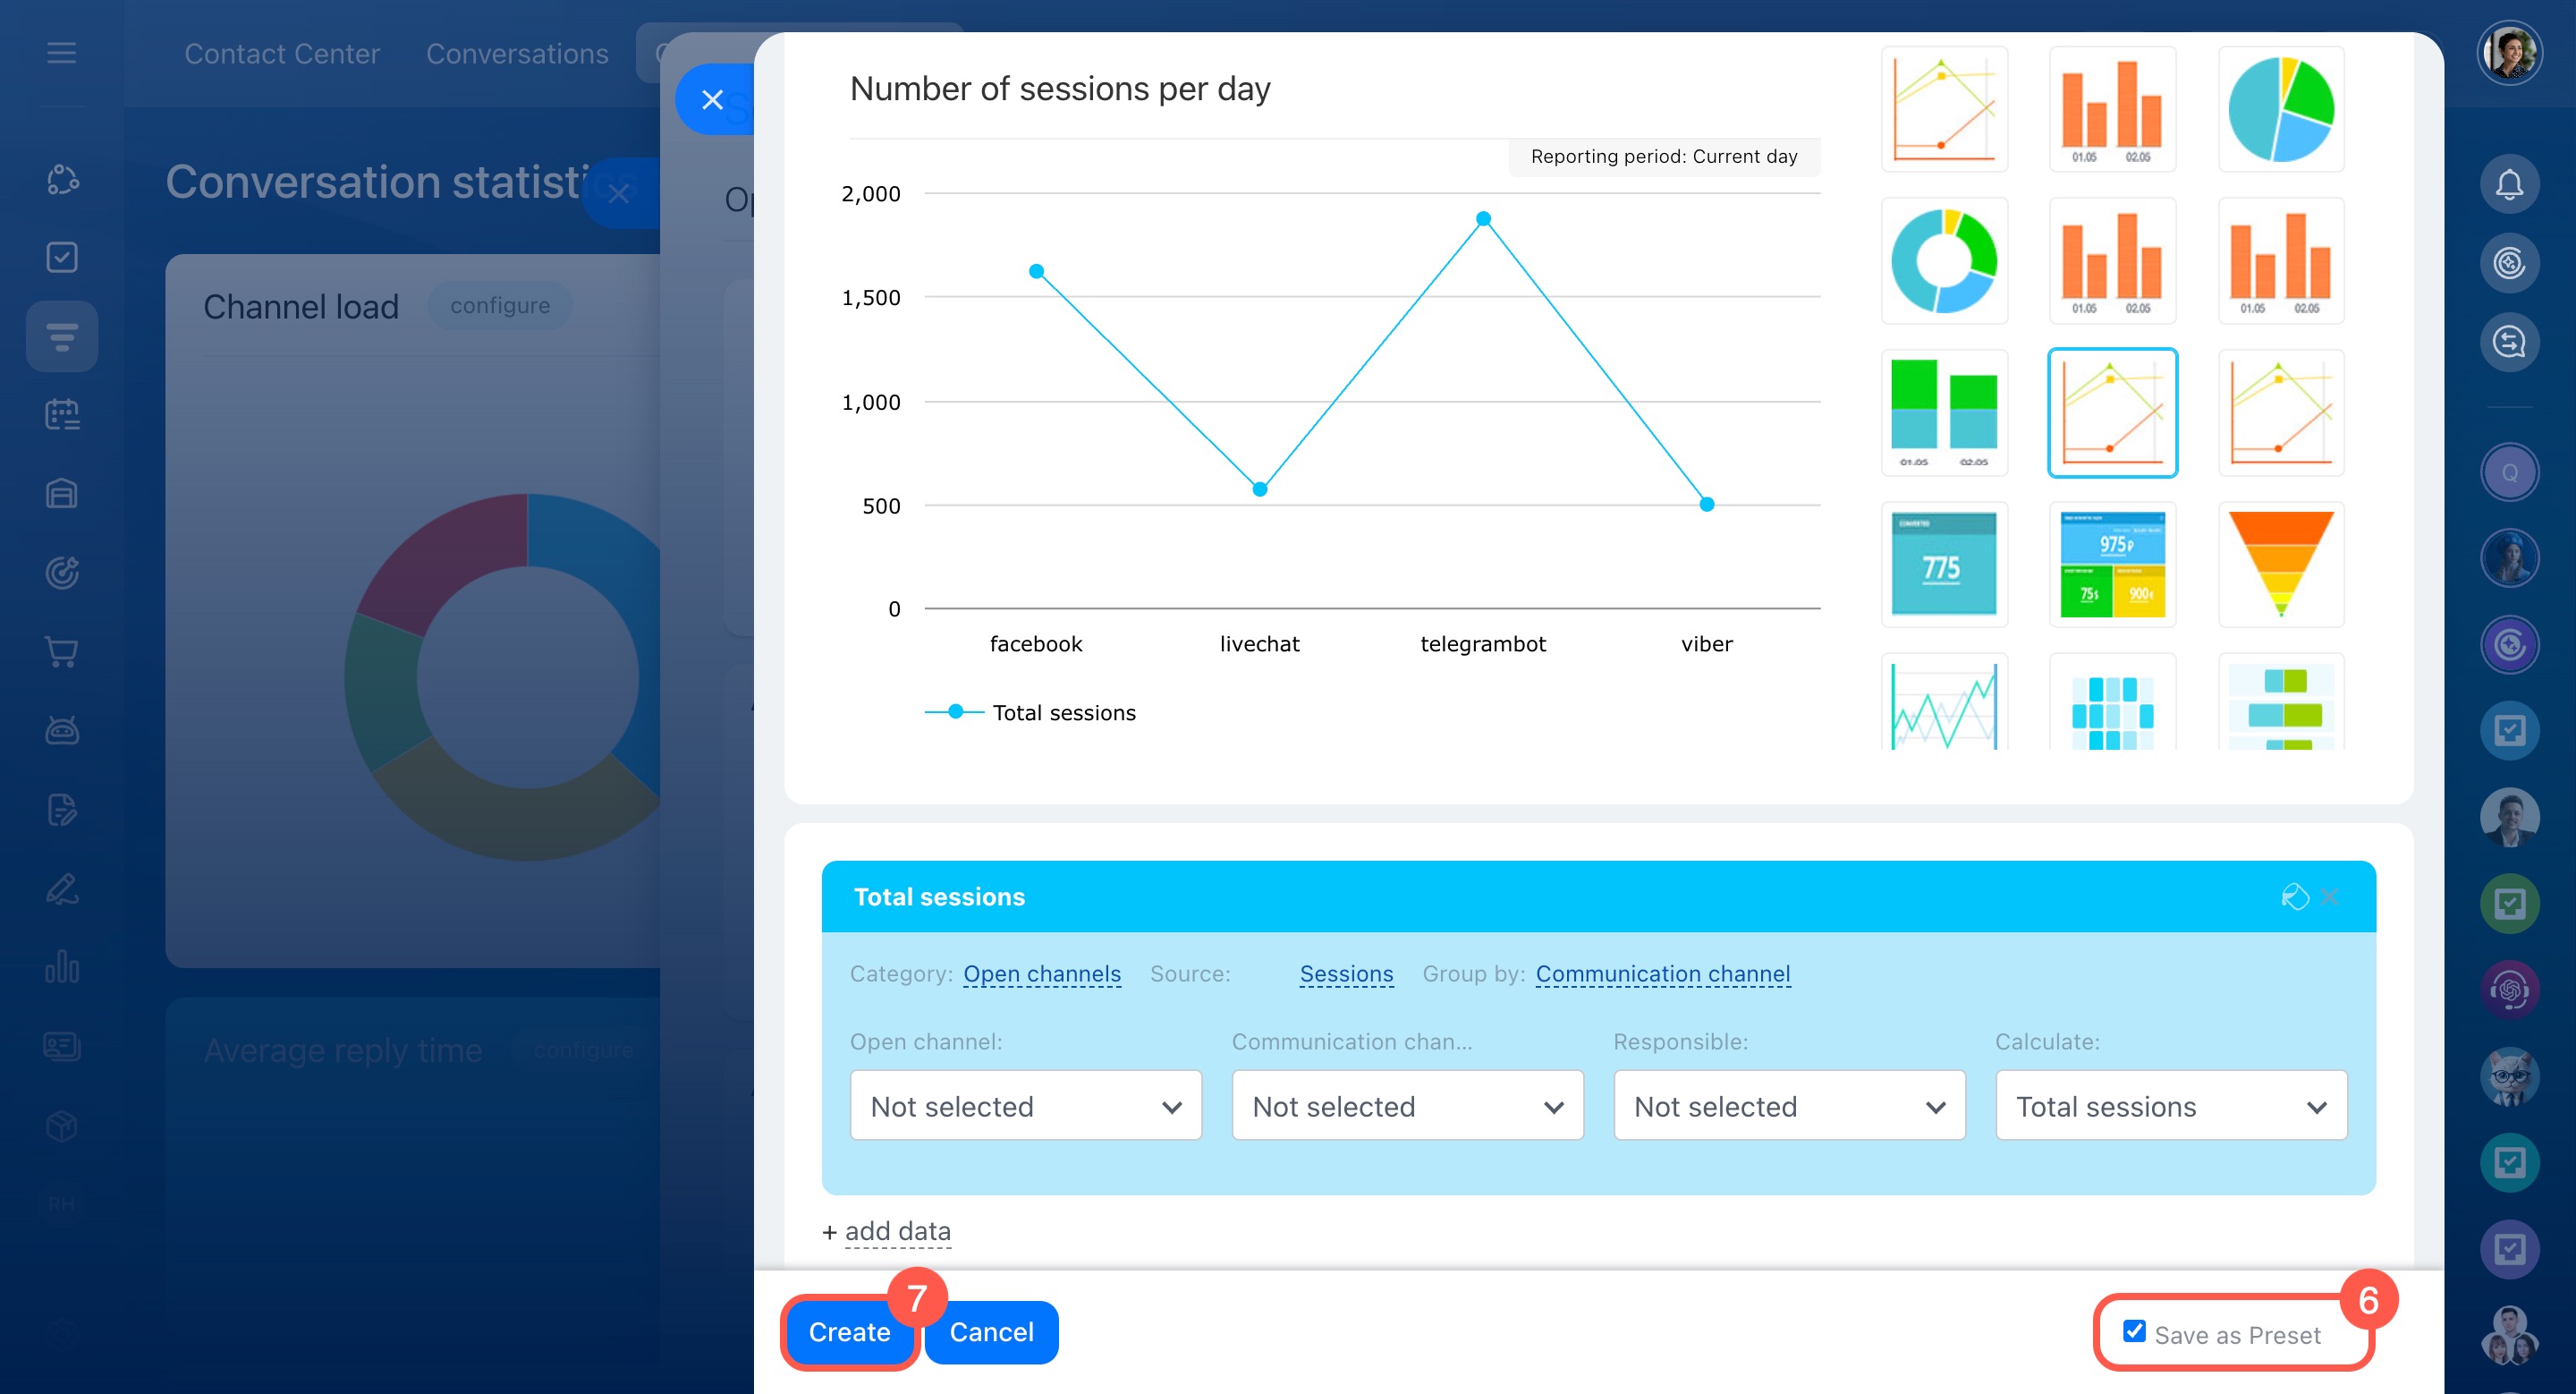
How to customize a report - Check Save as Preset to use the report as a template for future reports.
- Click Create to add the report to statistics.
Customize a report
To customize reports, choose your preferred display type, grouping method, and filters. This helps you learn which agent replies the fastest or which channels get the most messages.
To get started, click:
- Add widget – to create a report from scratch
- Configure – to edit an existing report
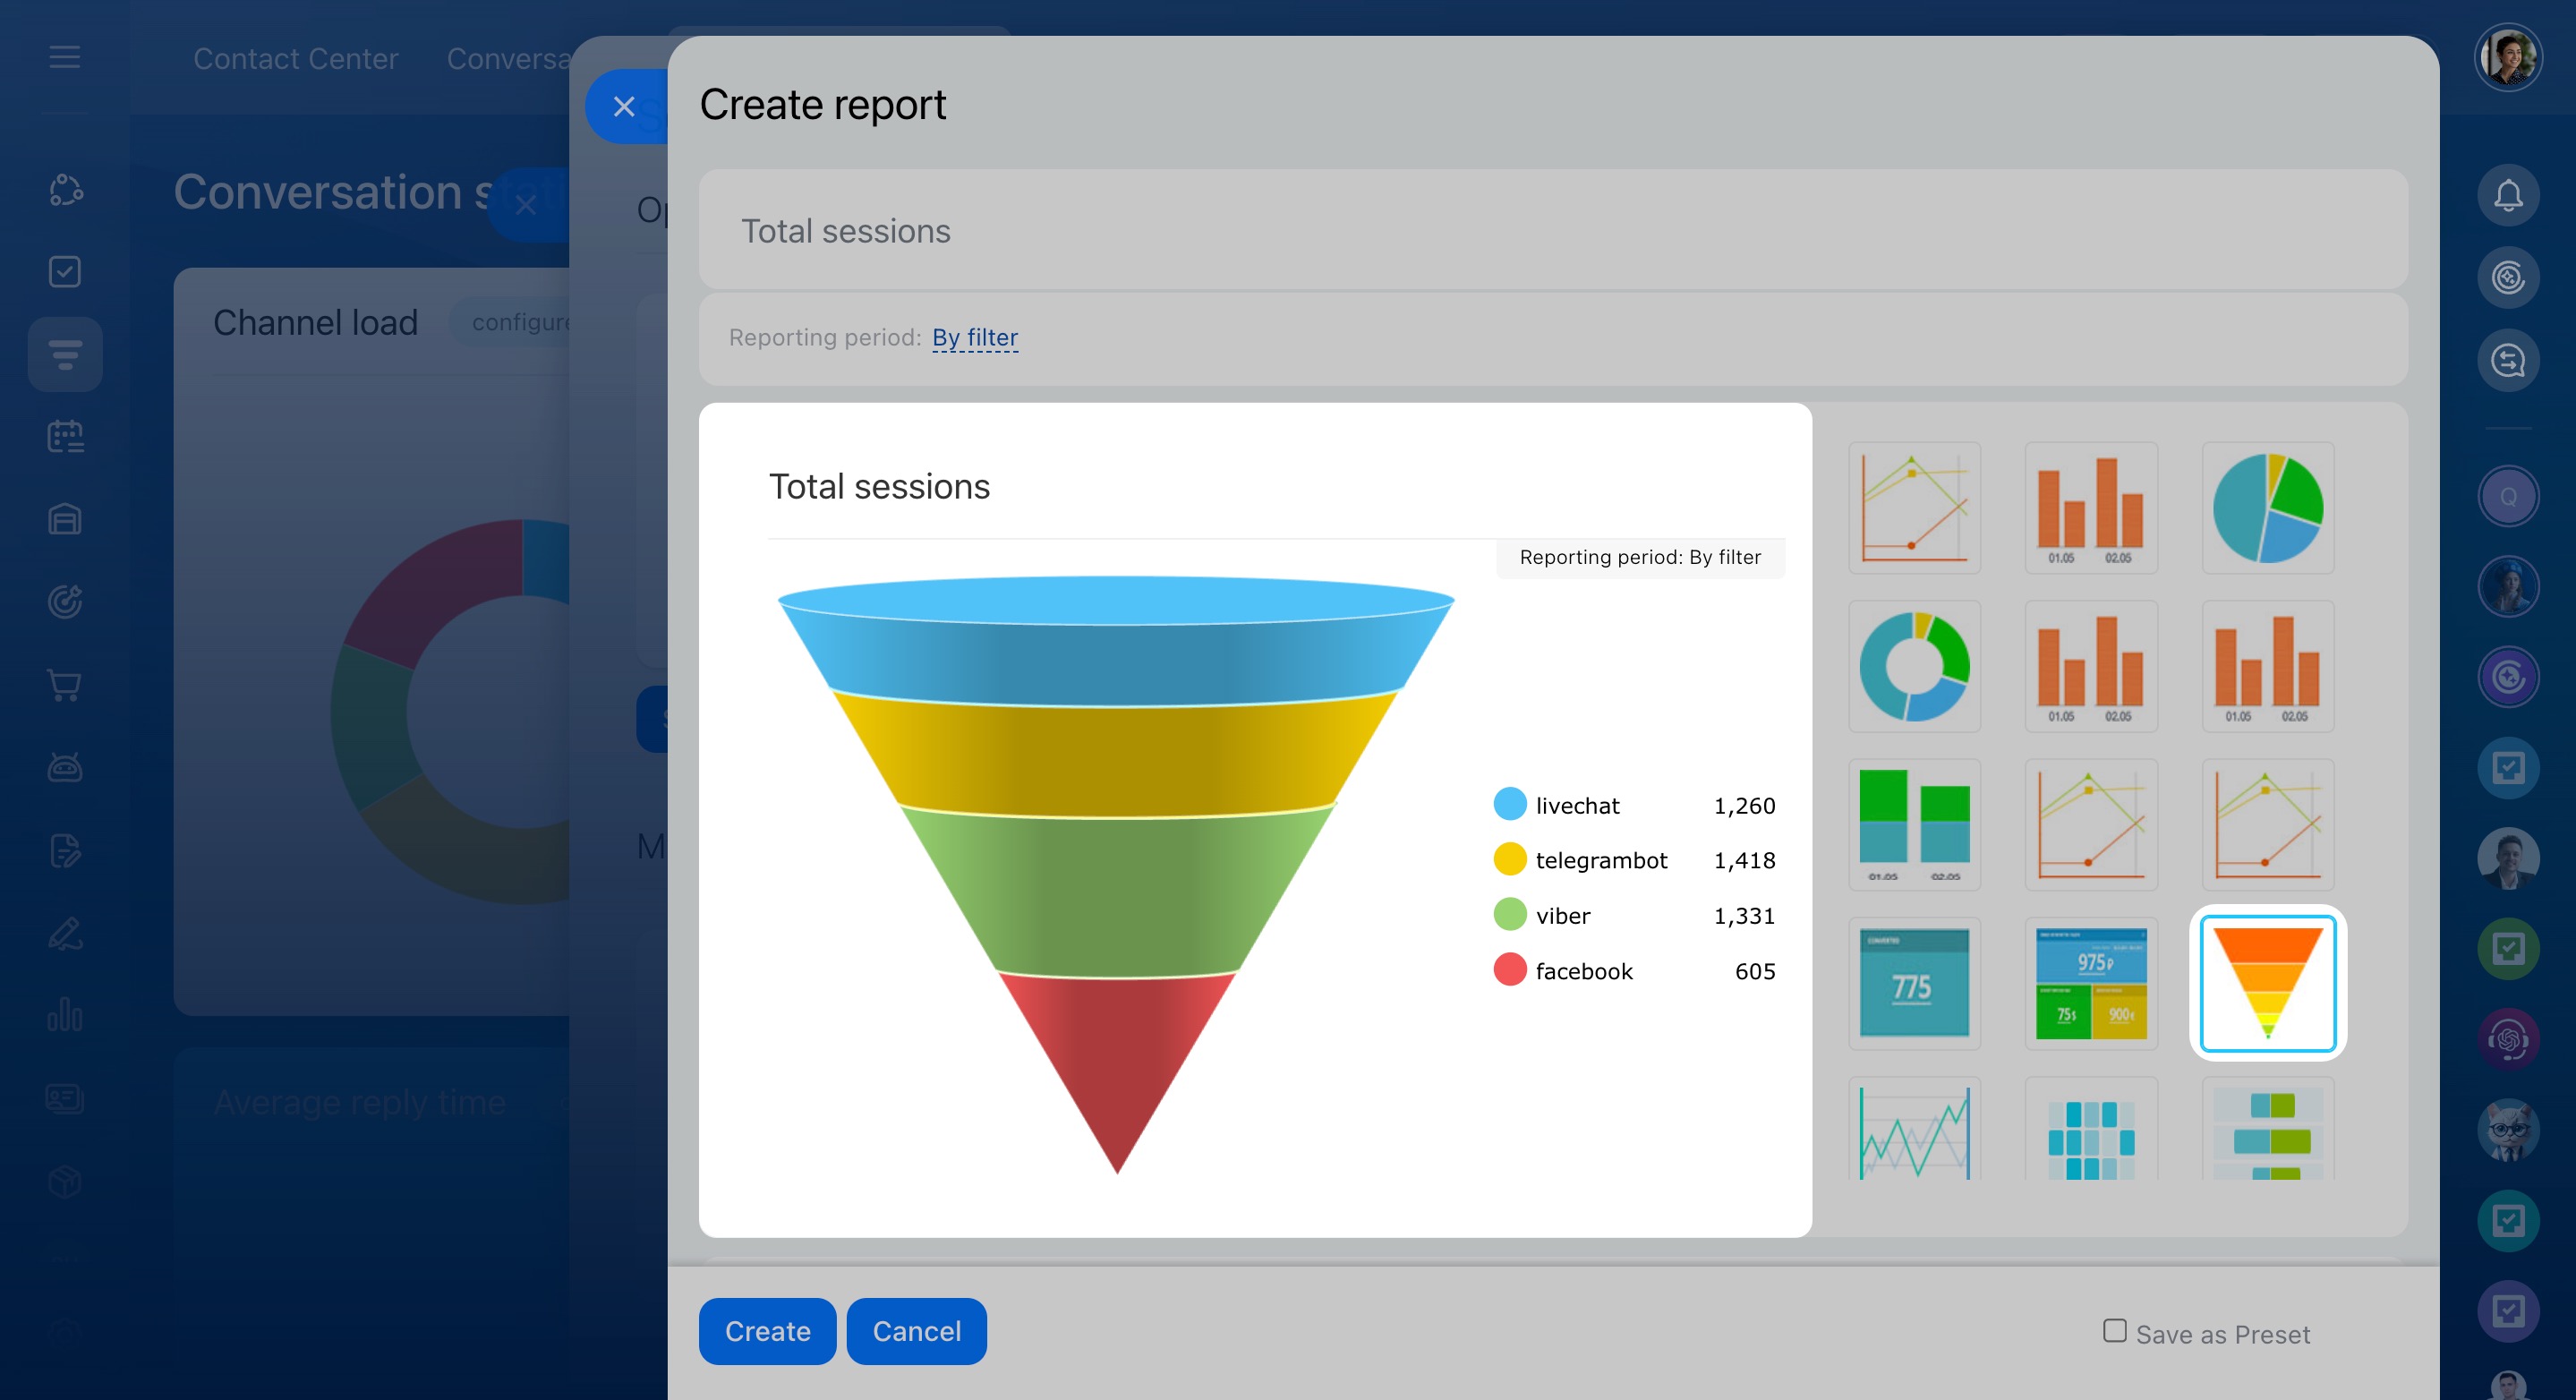
Select a display type
Bitrix24 reports offer various display types, including charts, tables, or numbers. Choose the one that best fits the data you want to analyze.
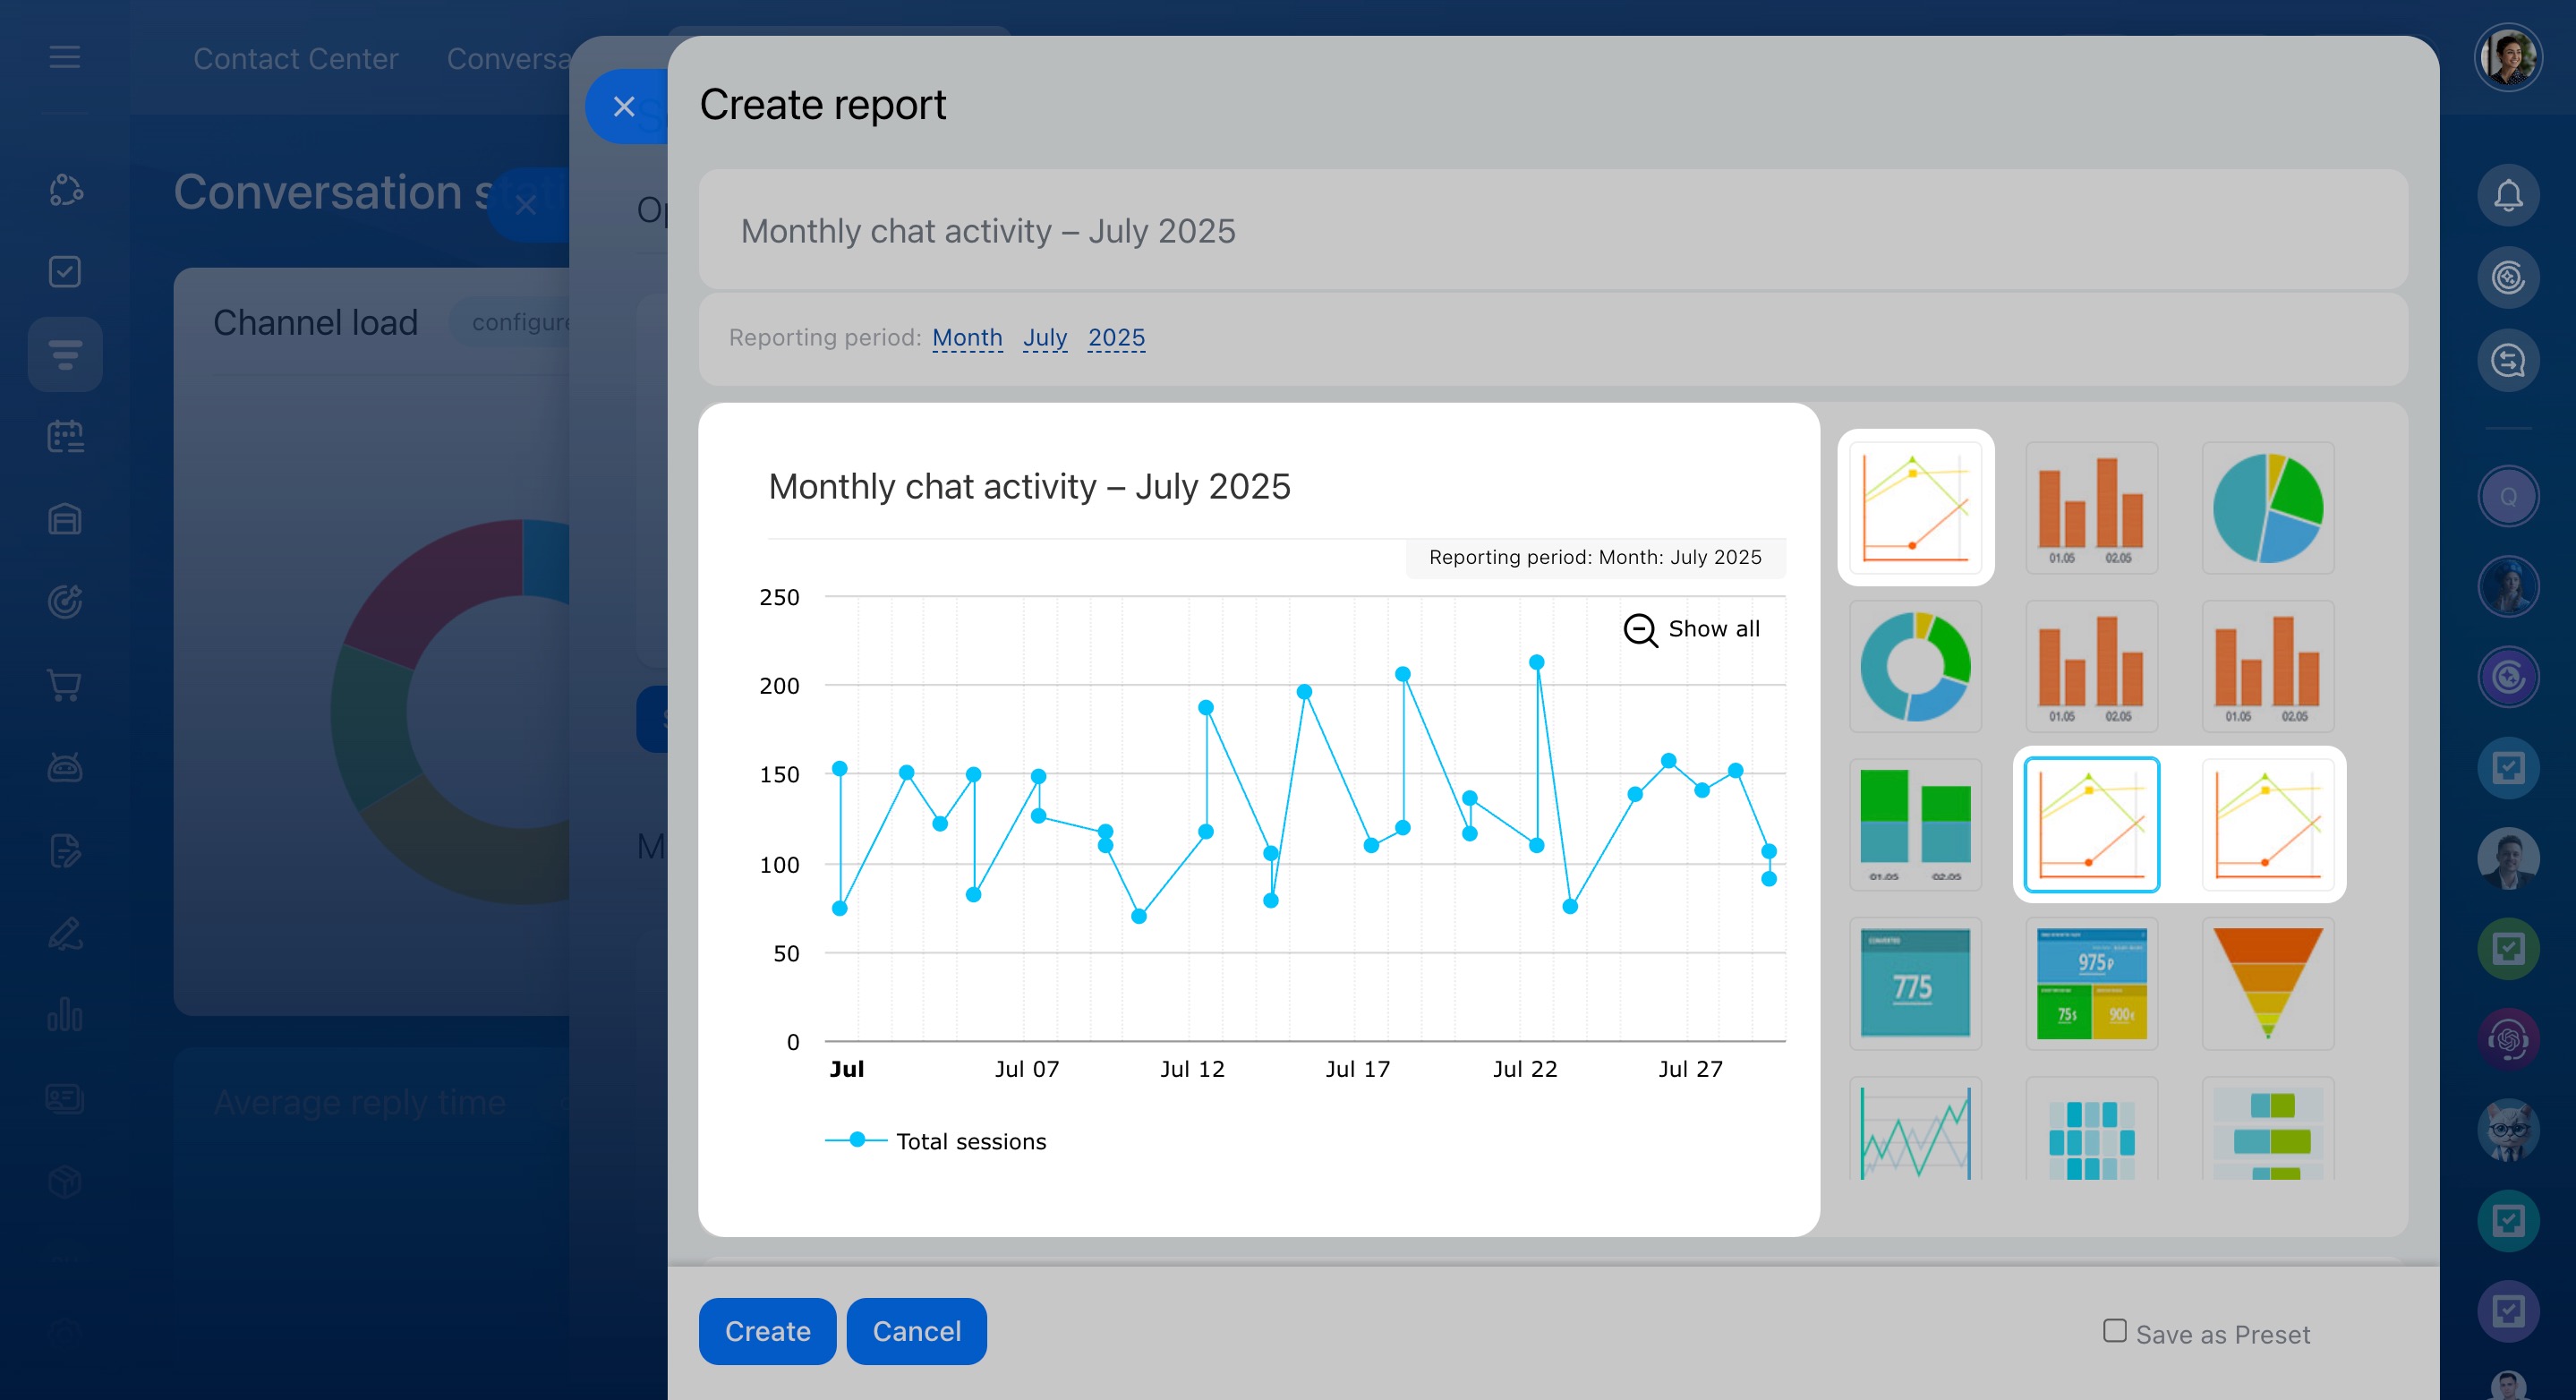
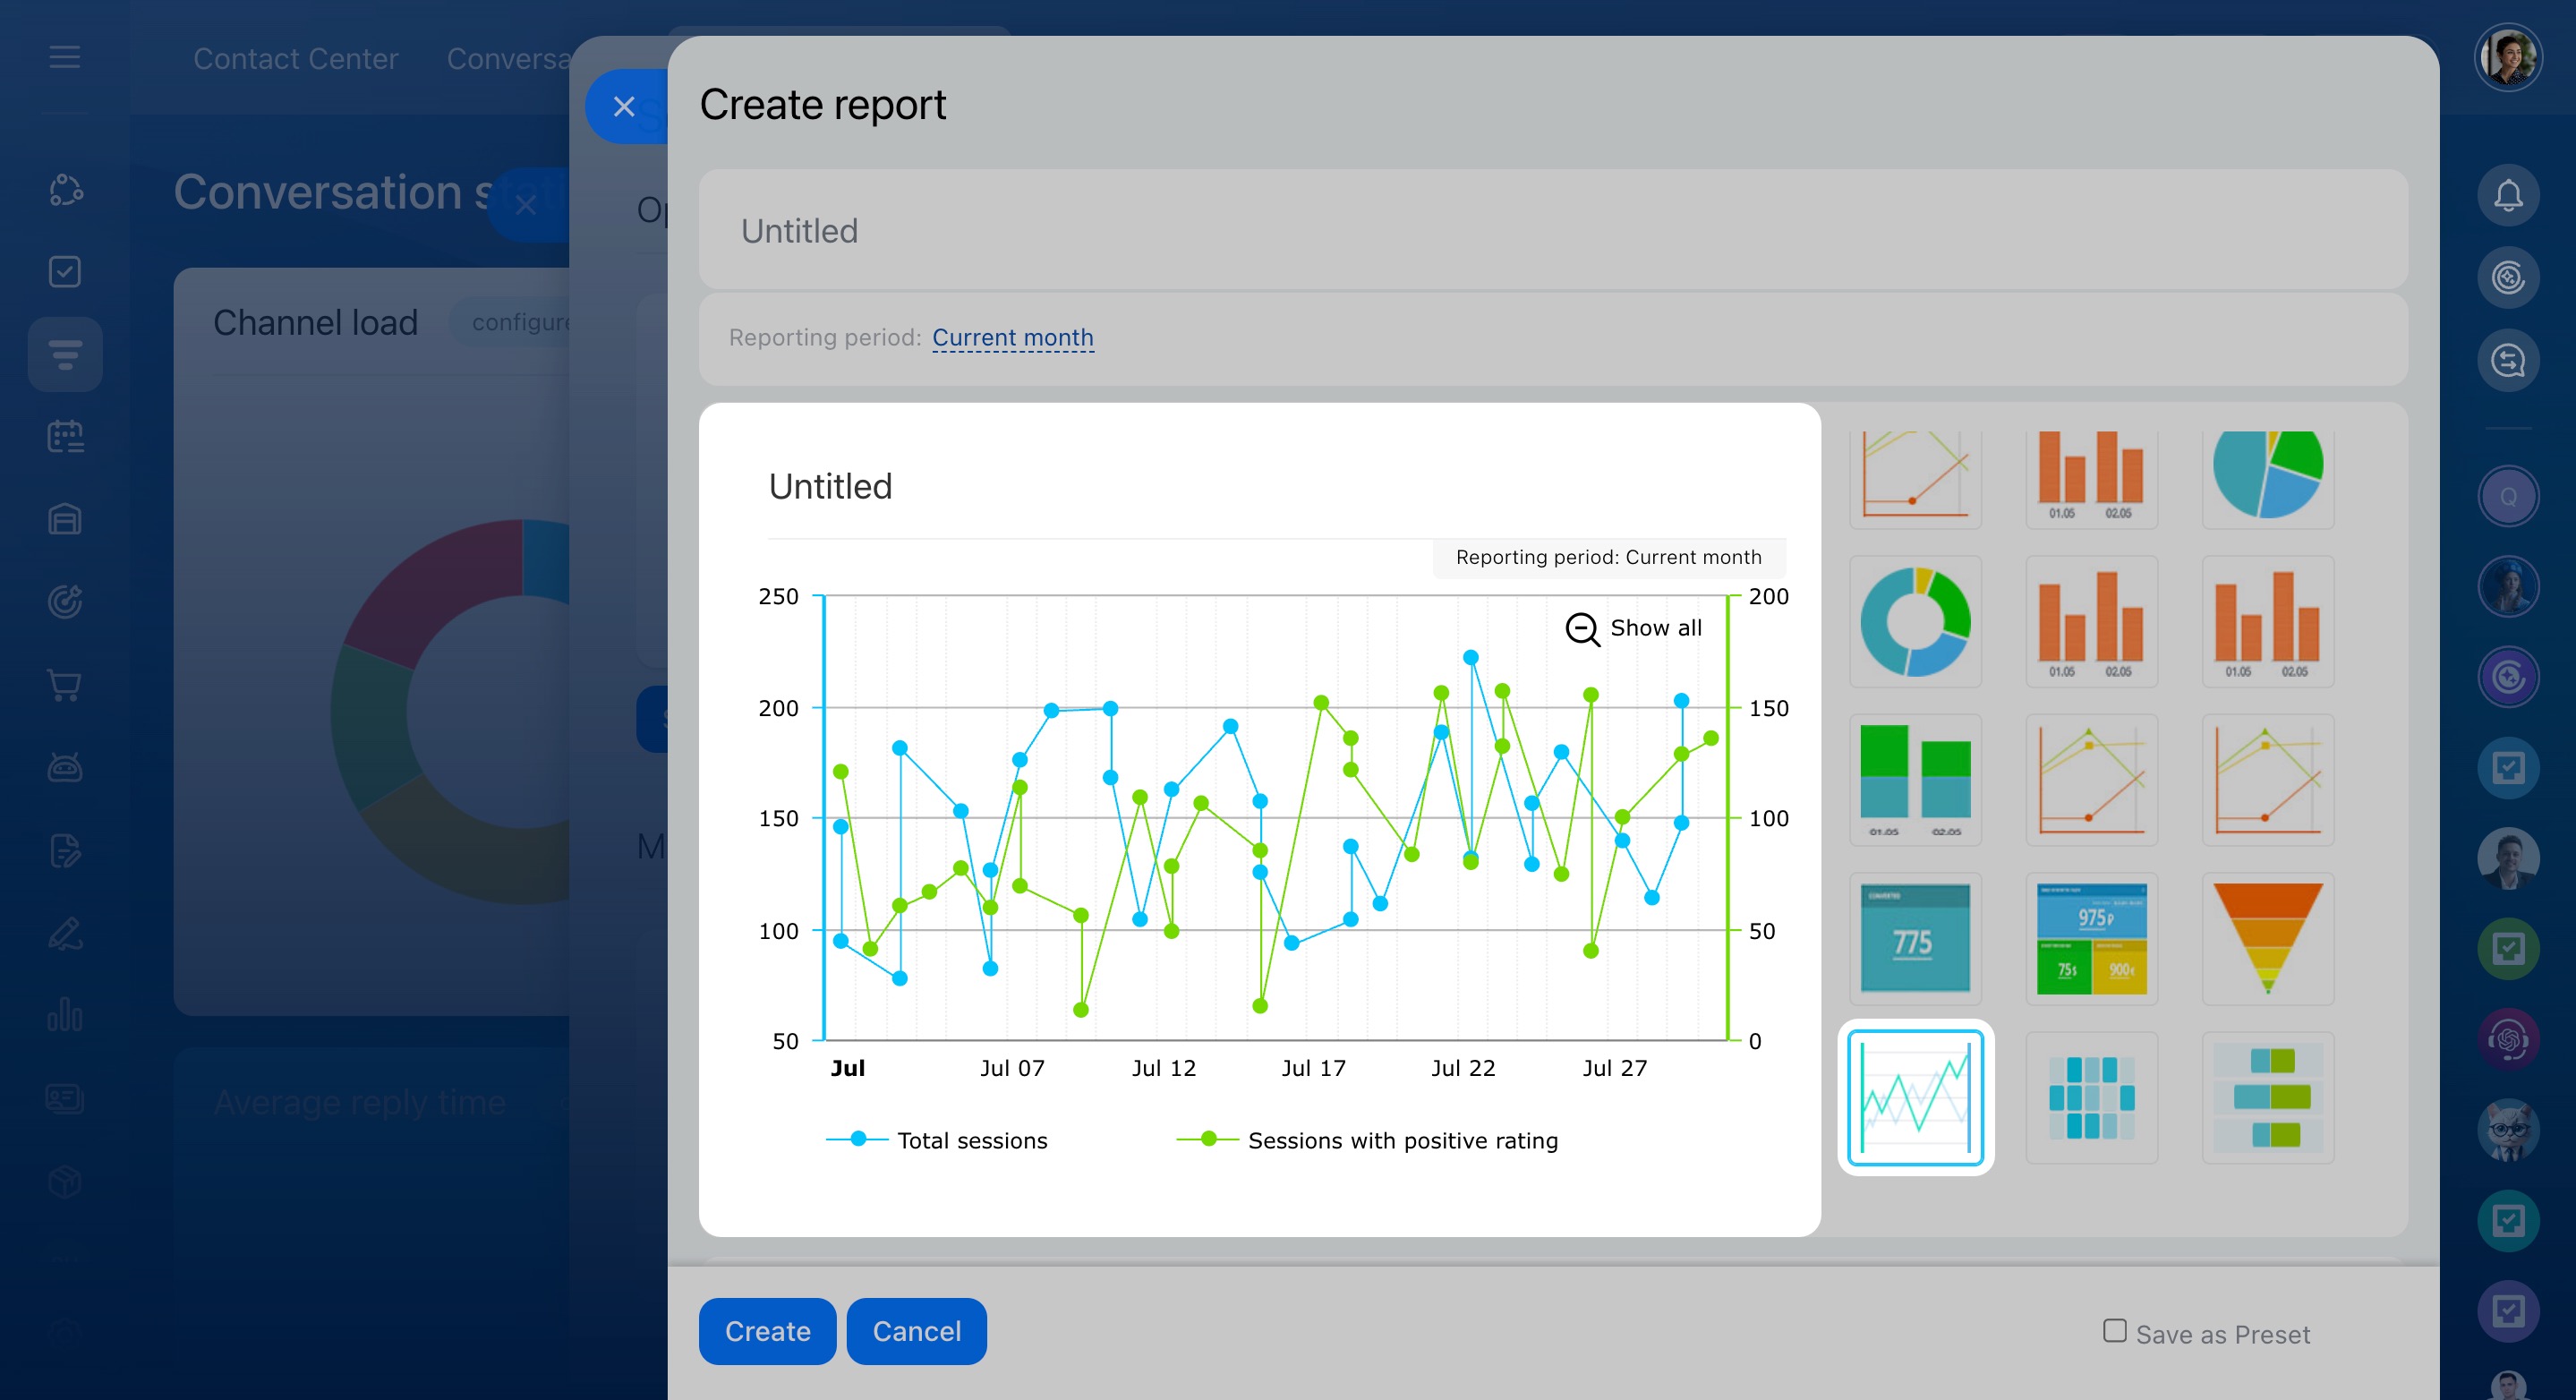
Track changes over time
Keep an eye on trends like daily chat volume or how response times improve.
- Line graph / Smoothed line graph: Displays changes over a selected period.
- Dual axis graph: Compares two metrics side by side.
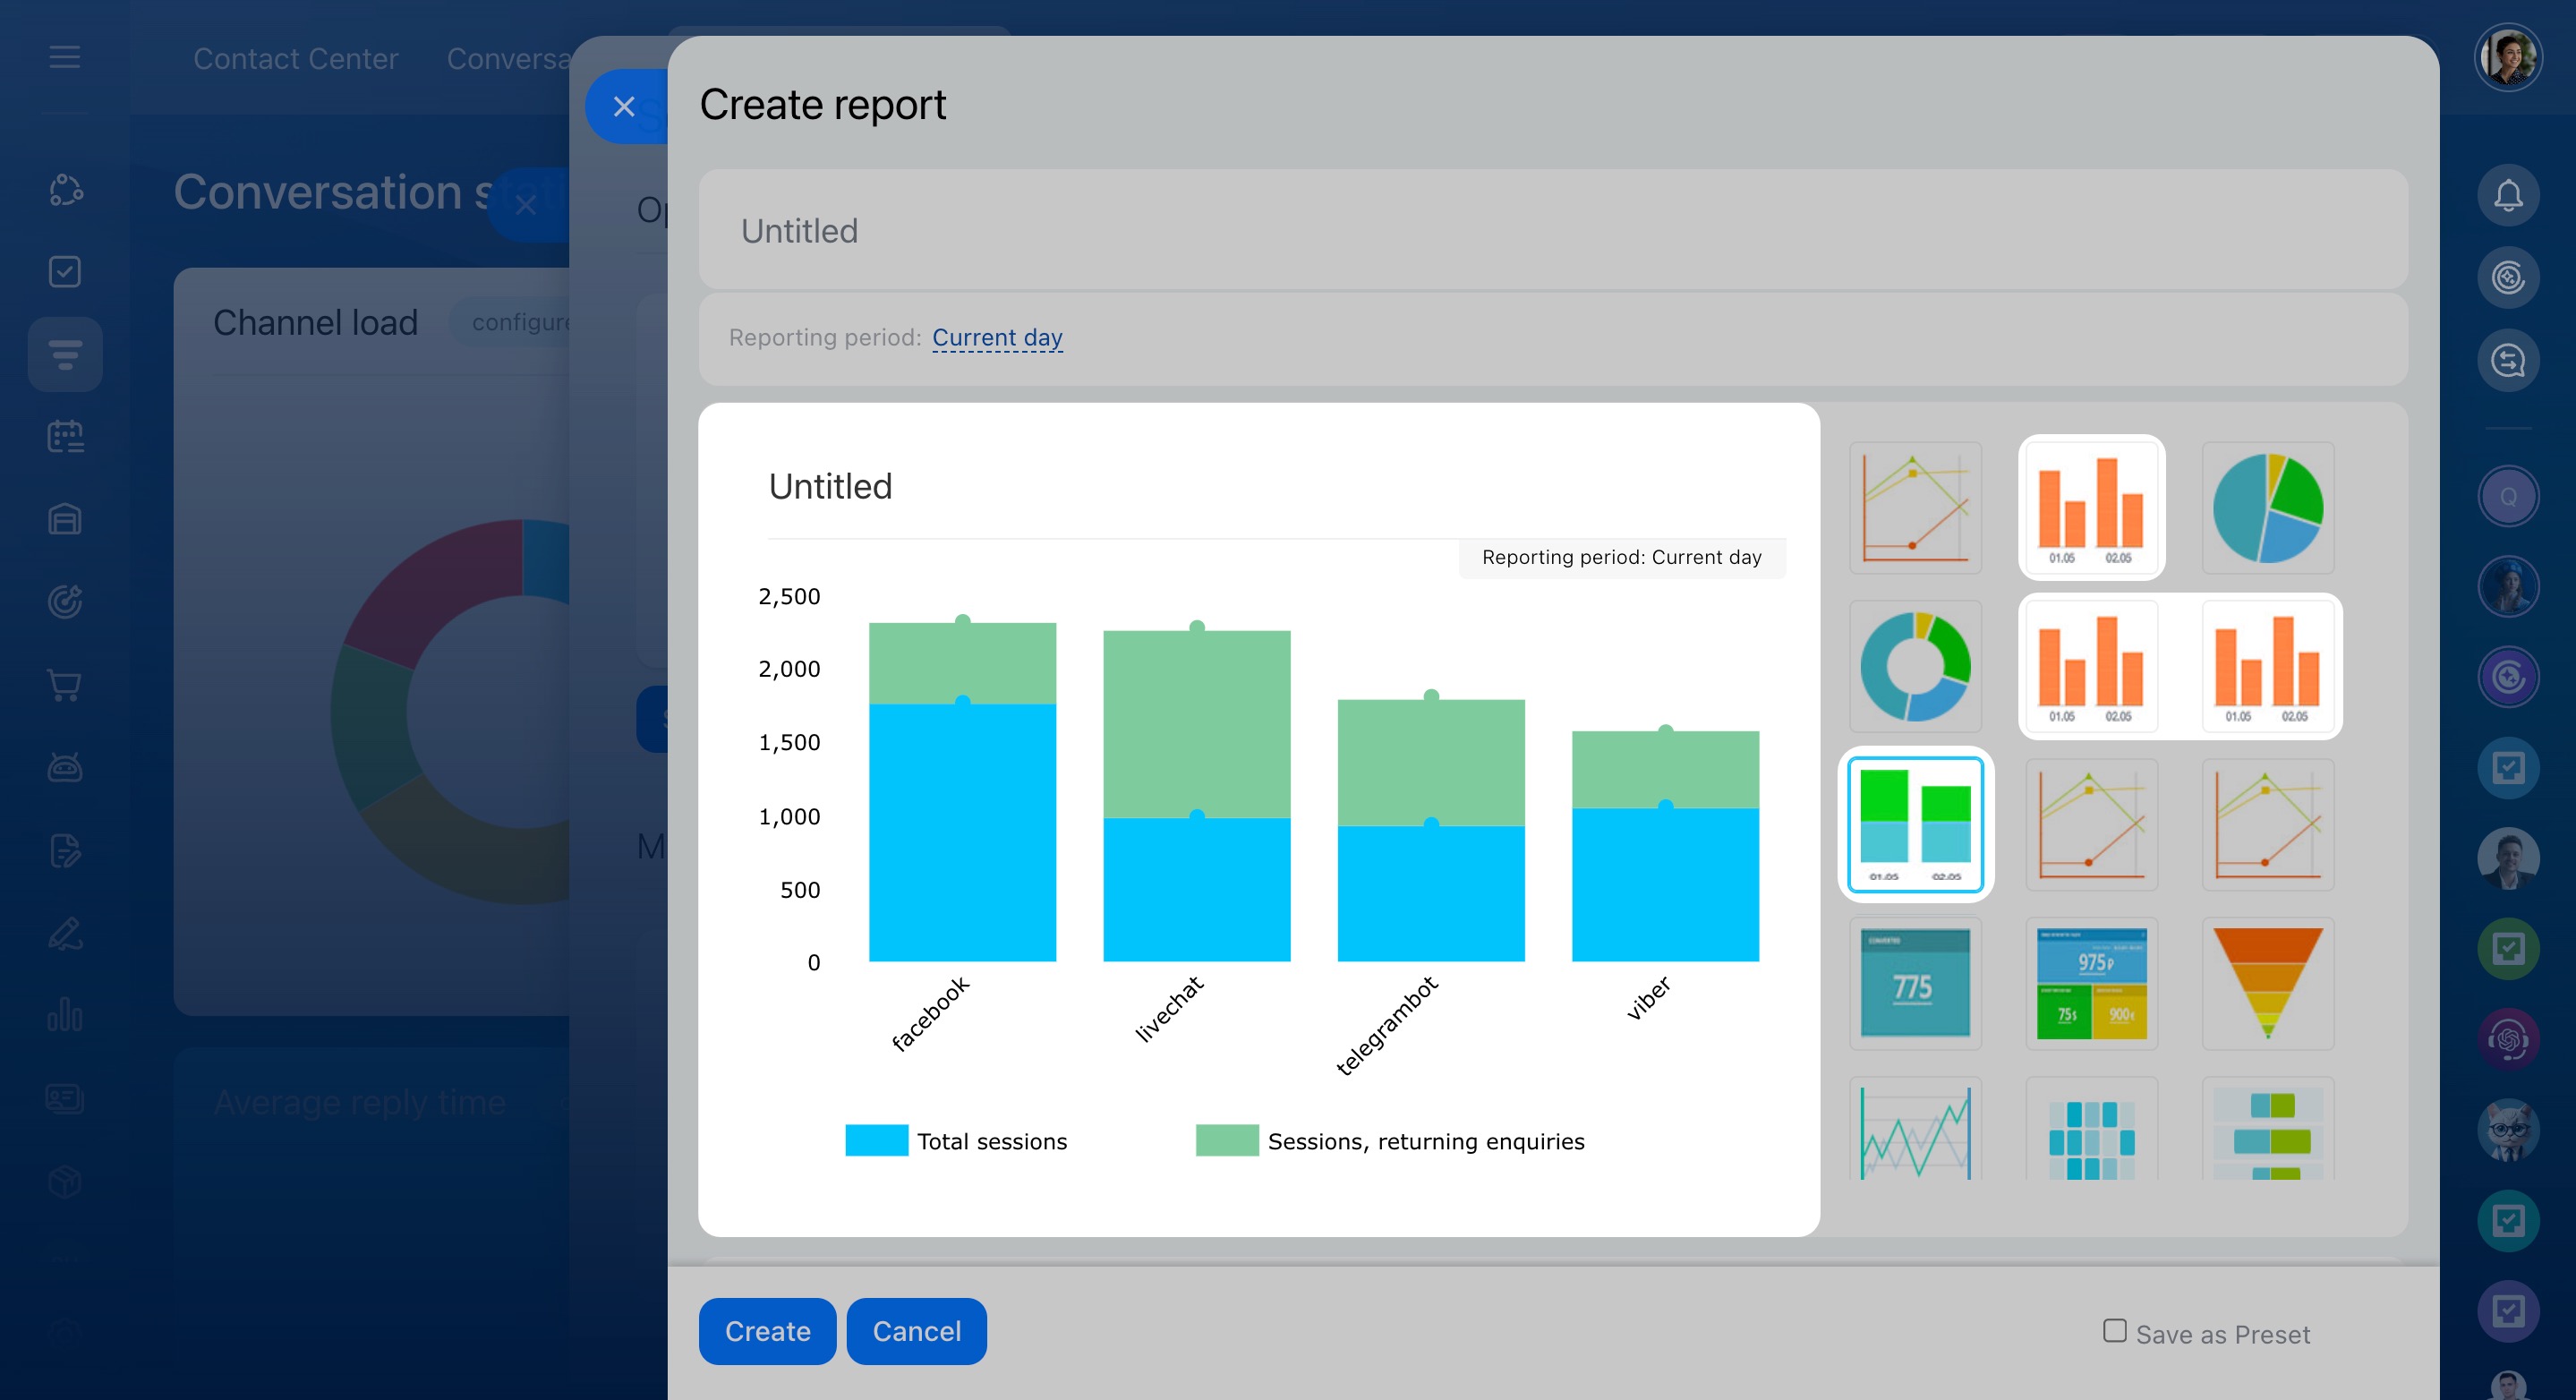
Compare agents or channels
Use these to find out who responds faster or which channel gets more traffic.
- Bar chart: Shows bars of different heights; taller bars mean larger values, like comparing new and repeat chats.
- Bar chart (log scale): Useful for large value differences, like when one agent answered 10 chats and another 1,000. The scale is adjusted to make the data easier to see.
- Stacked column chart: Breaks down totals into parts, like answered and skipped chats, with different color for each part.
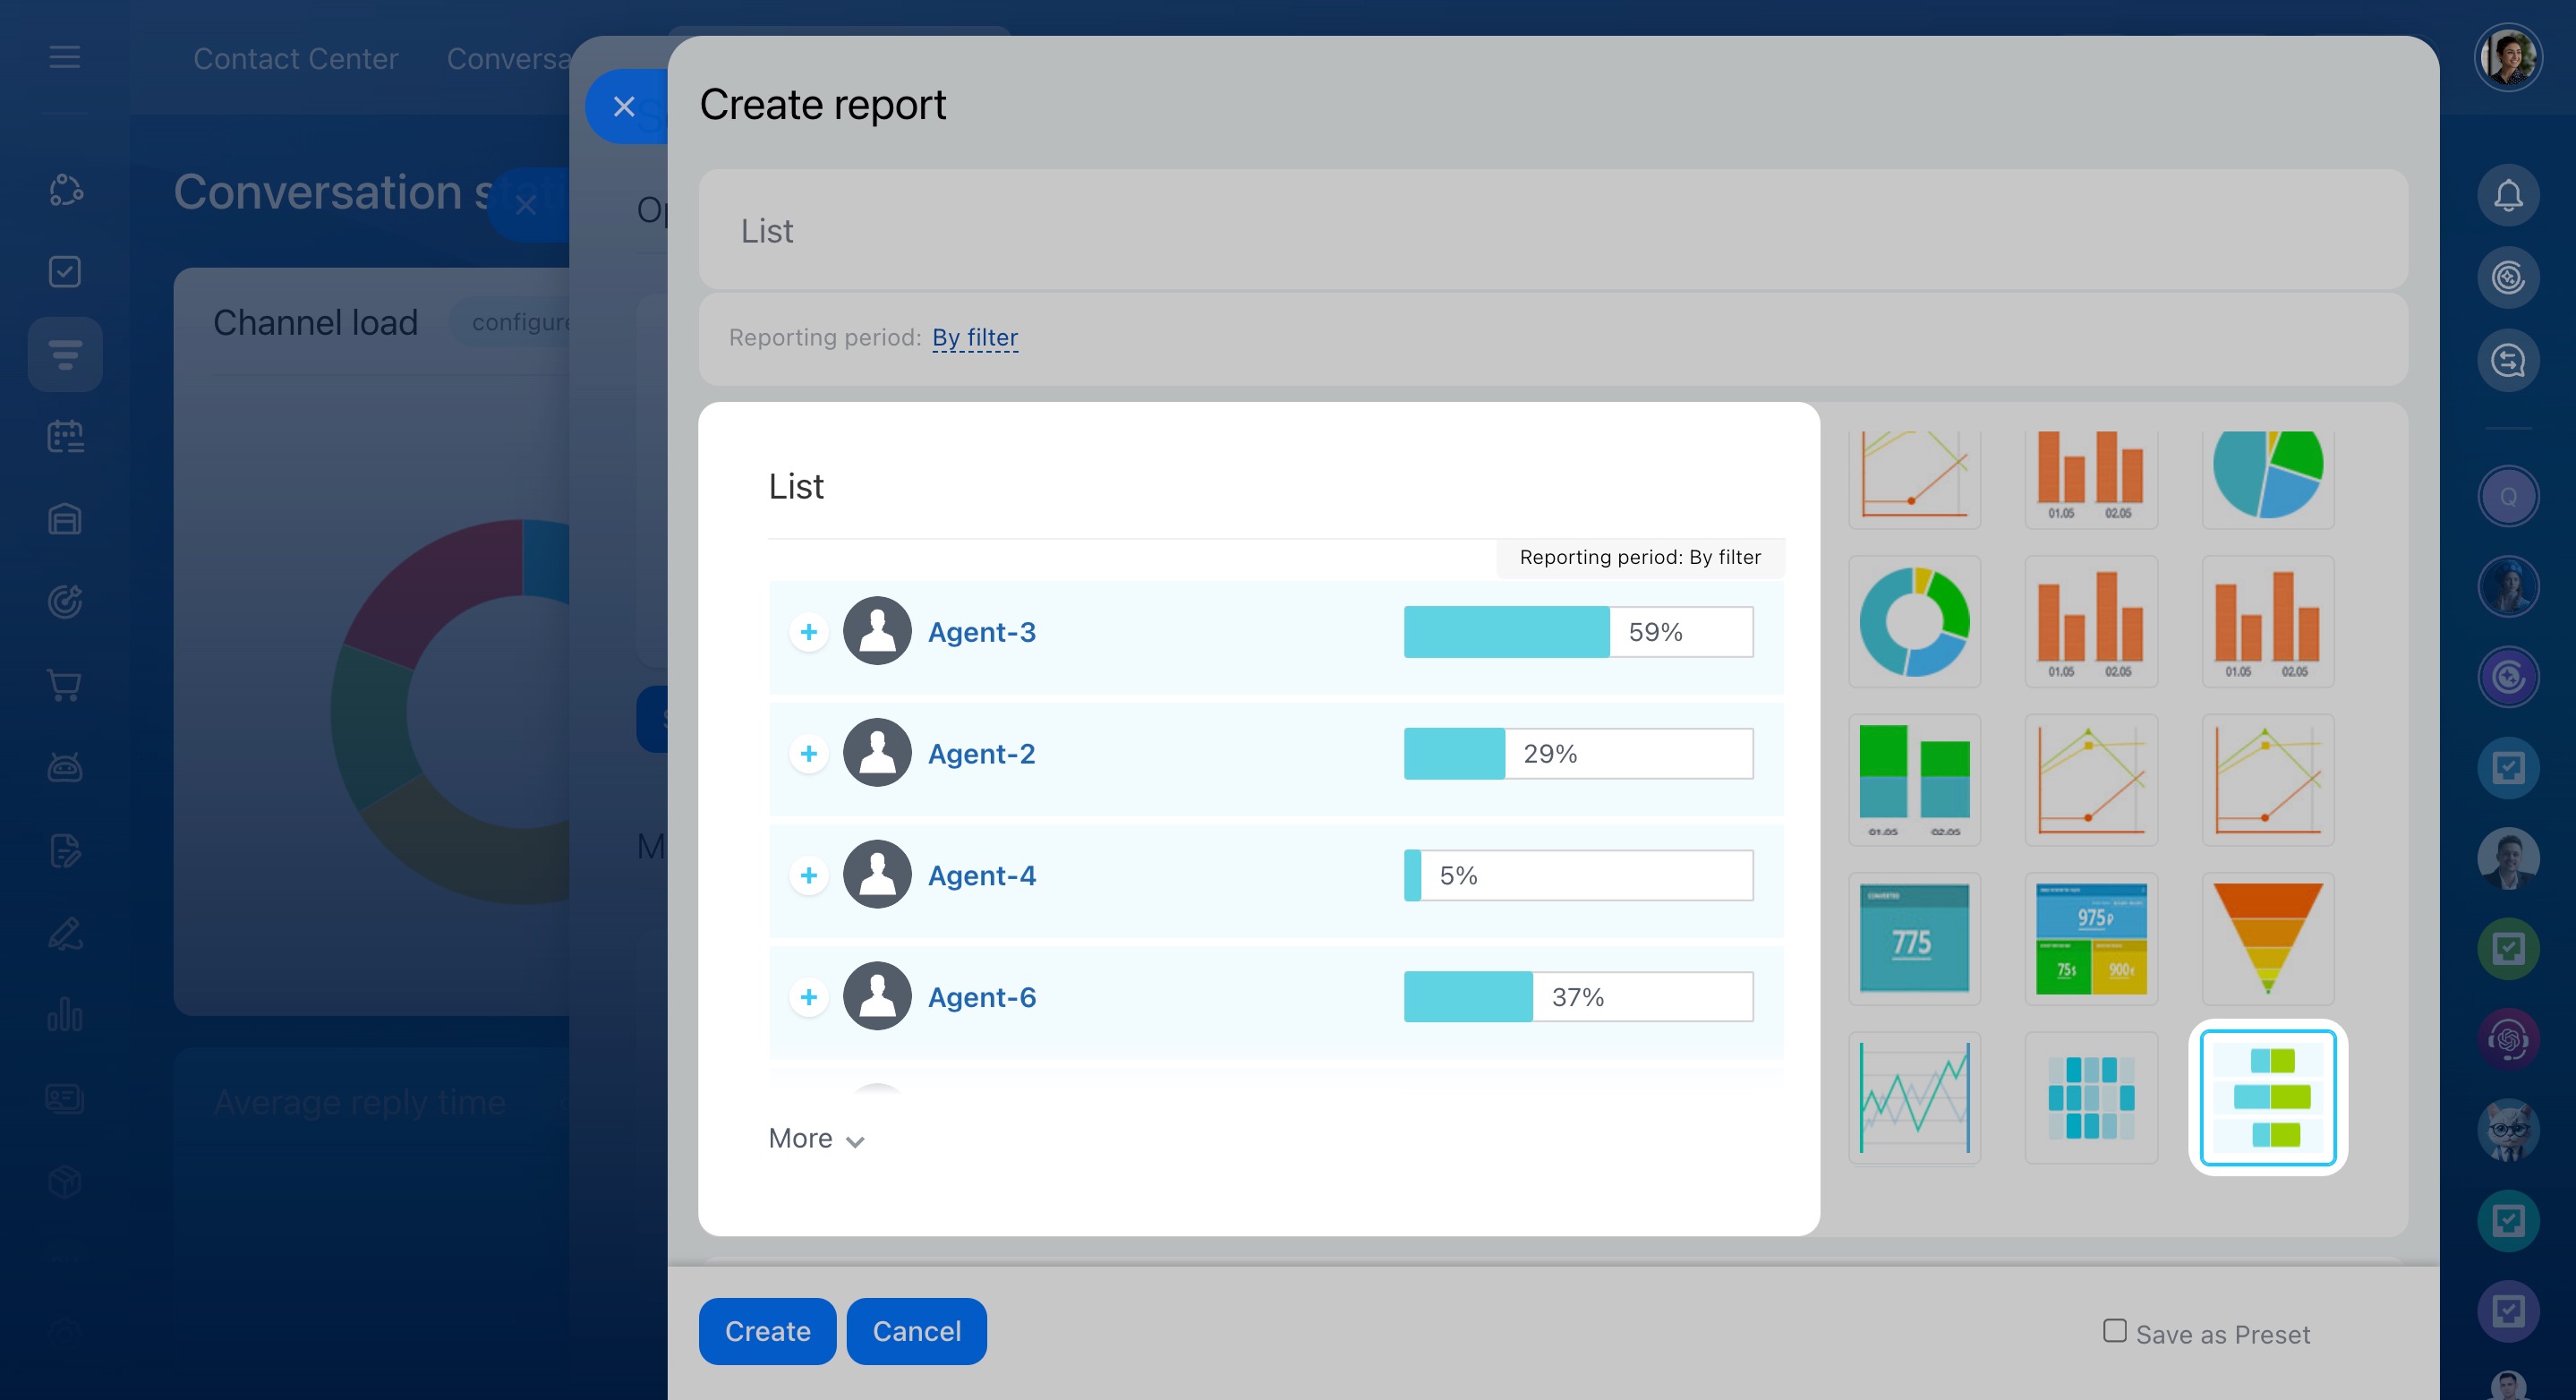
- List: Displays a table with session counts for each agent or channel, including skipped chats and customer satisfaction rates.
View key numbers at a glance
Quickly check important metrics like total sessions, returning enquiries, or satisfaction rates.
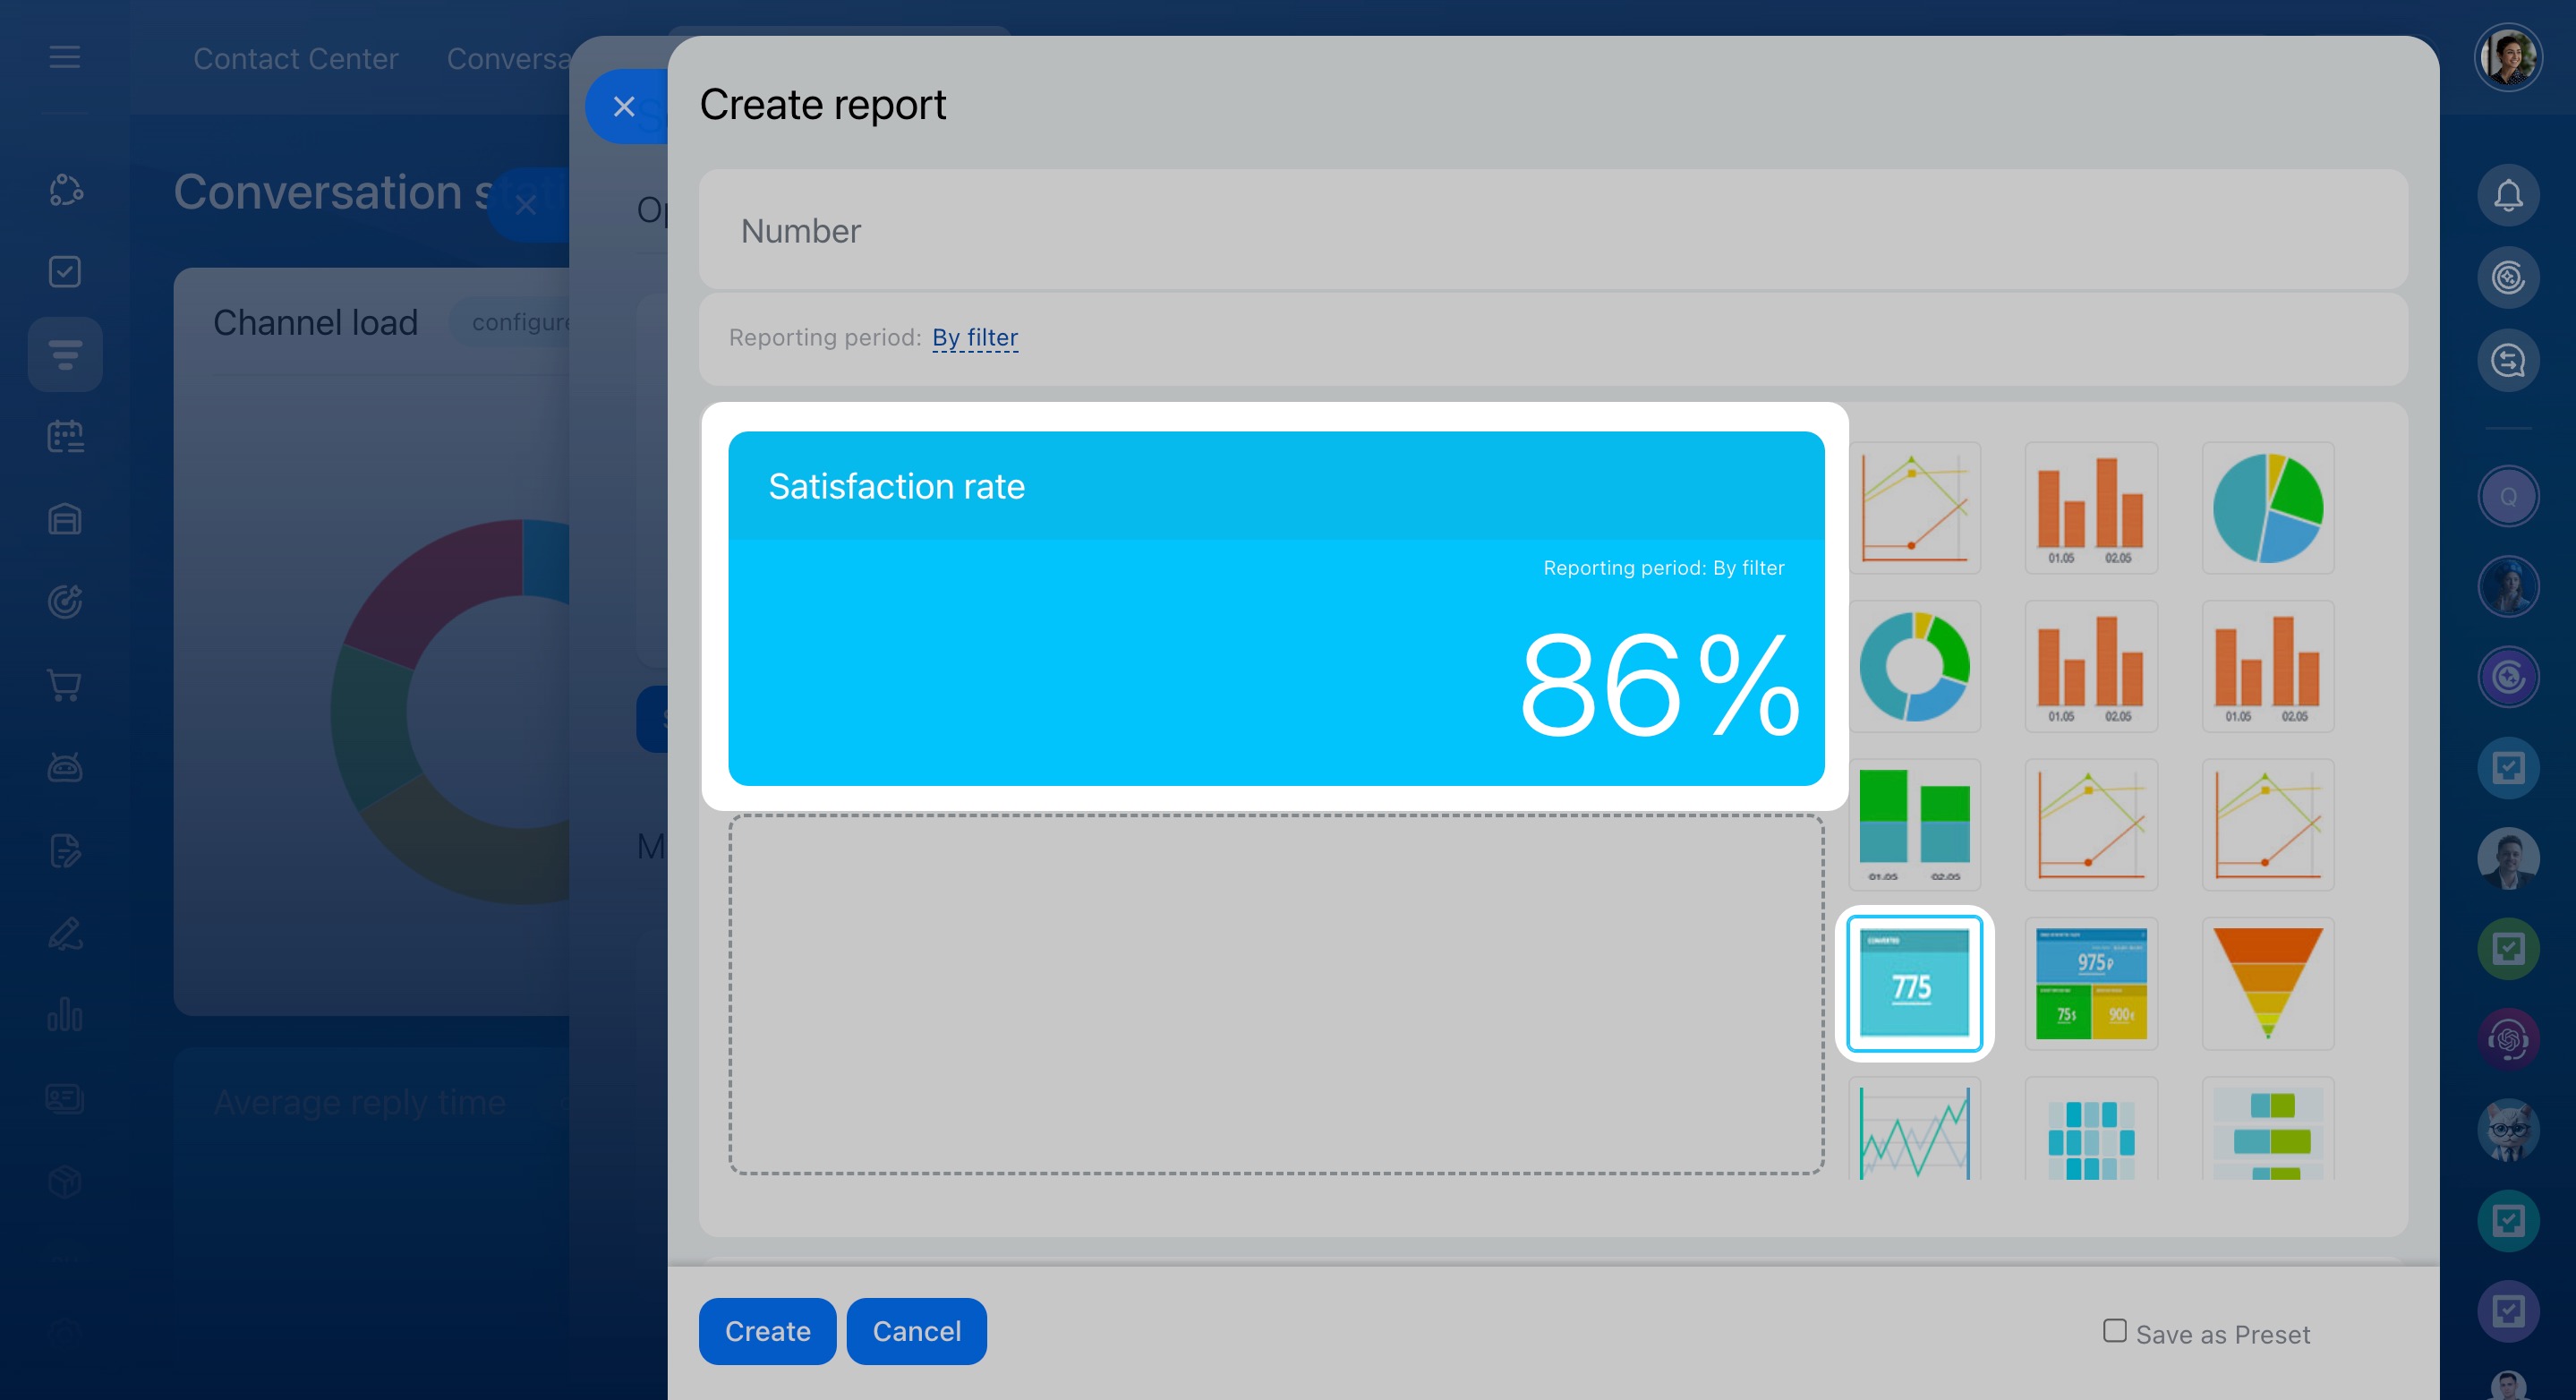
- Number: Shows one key metric, like a 74% customer satisfaction rate.
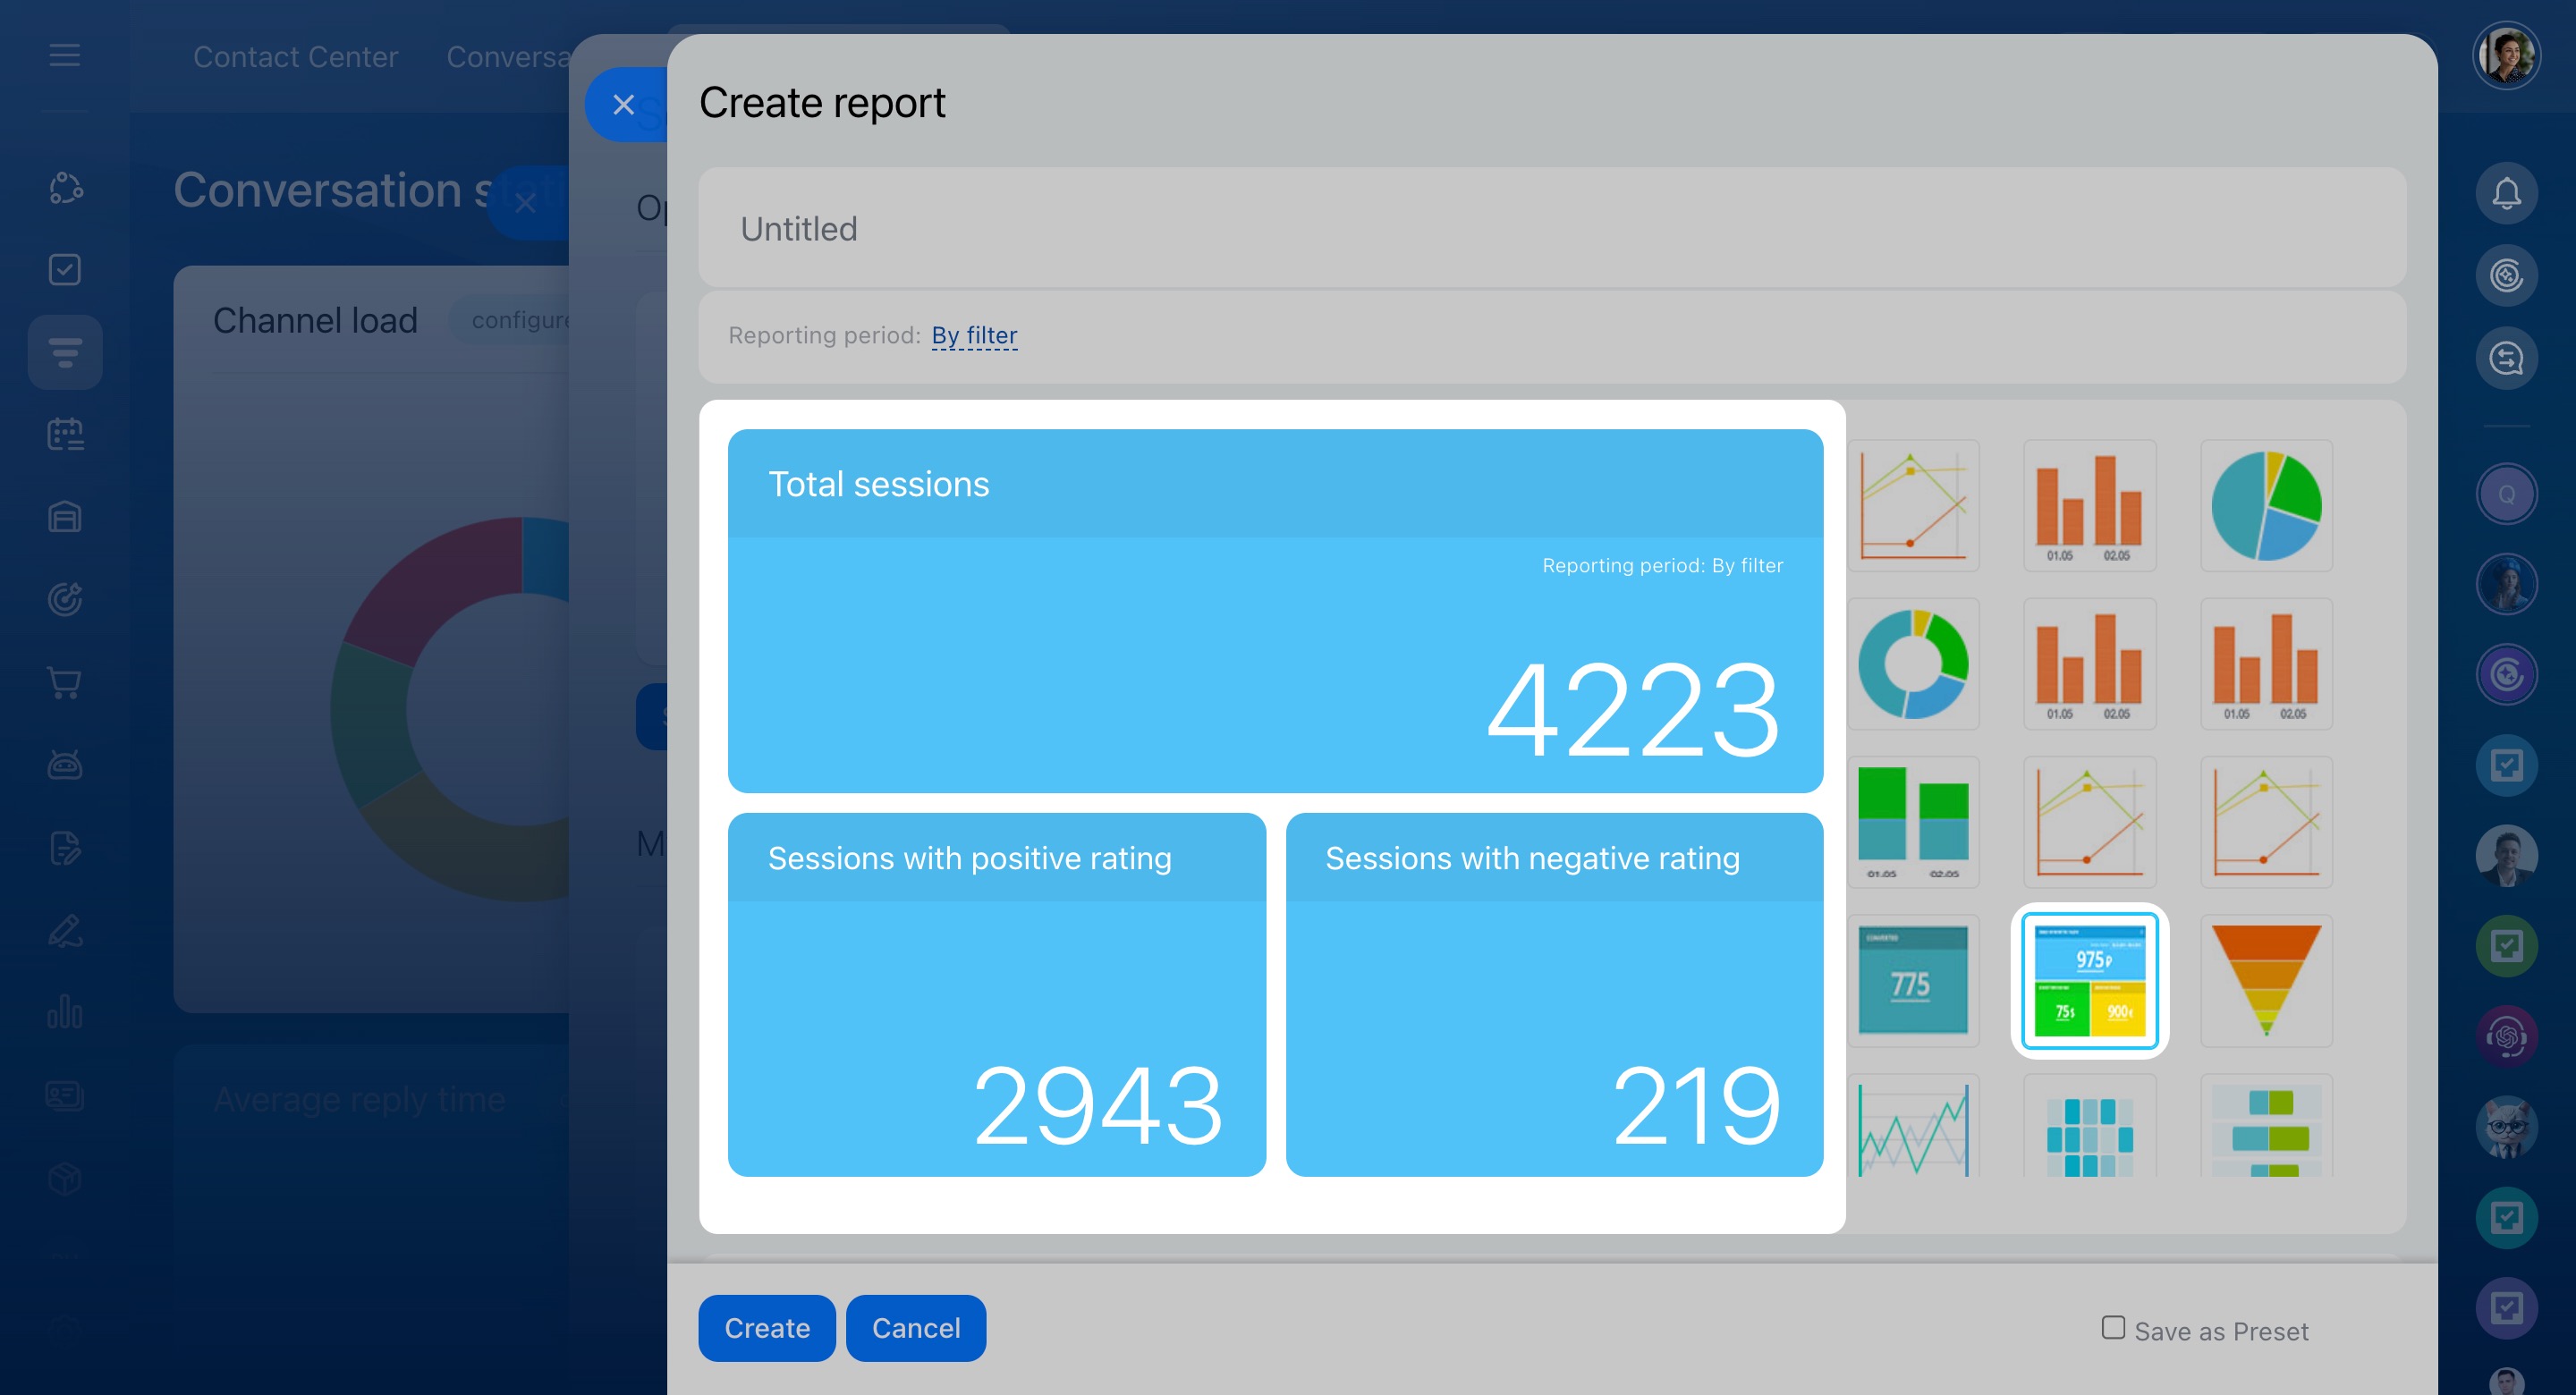
- Number block: Displays multiple metrics at once, like 1,200 total sessions, 800 new, and 400 returning enquiries.
See data distribution
Find out which agents or channels handle the most messages.
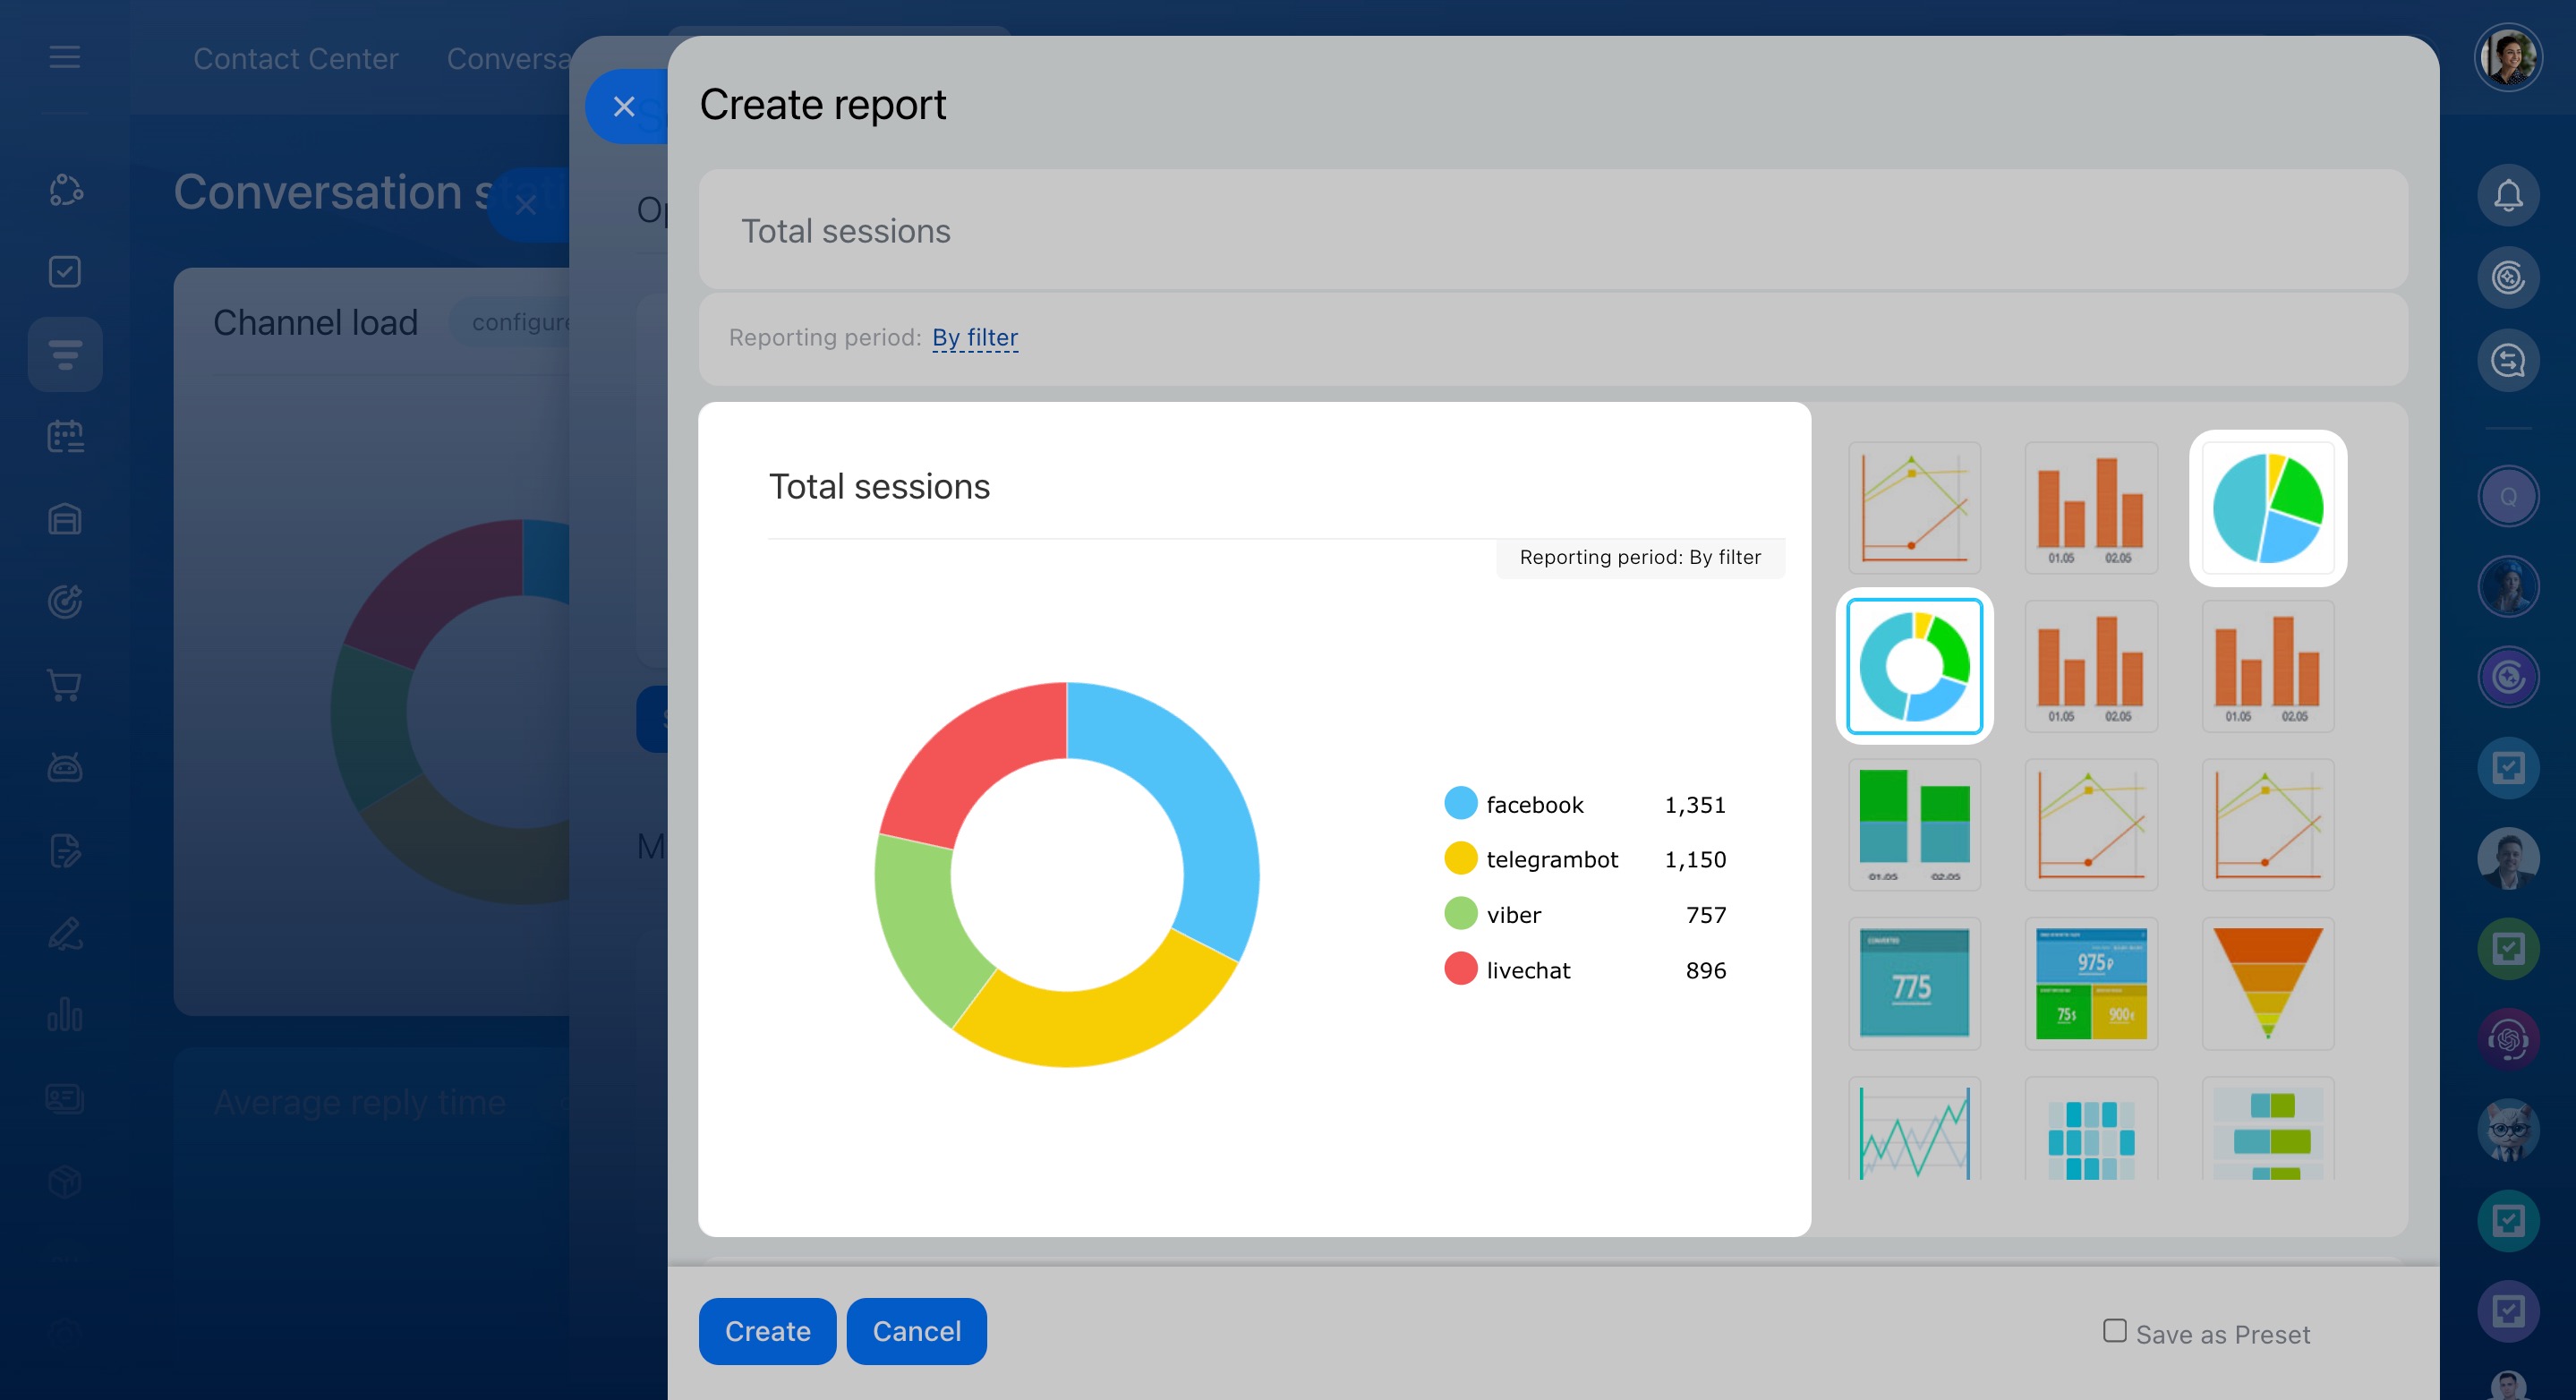
- Donut / Pie chart: Divides data into parts, each piece representing a portion of the whole.
- Funnel: Shows data in layers from largest to smallest.
Find peak enquiry times
Select the Activity chart to see when customers contact you most. This may help you organize agent schedules.
Configure parameters and filters
After choosing a display type, set the data source and presentation using the Parameters and Filters sections.
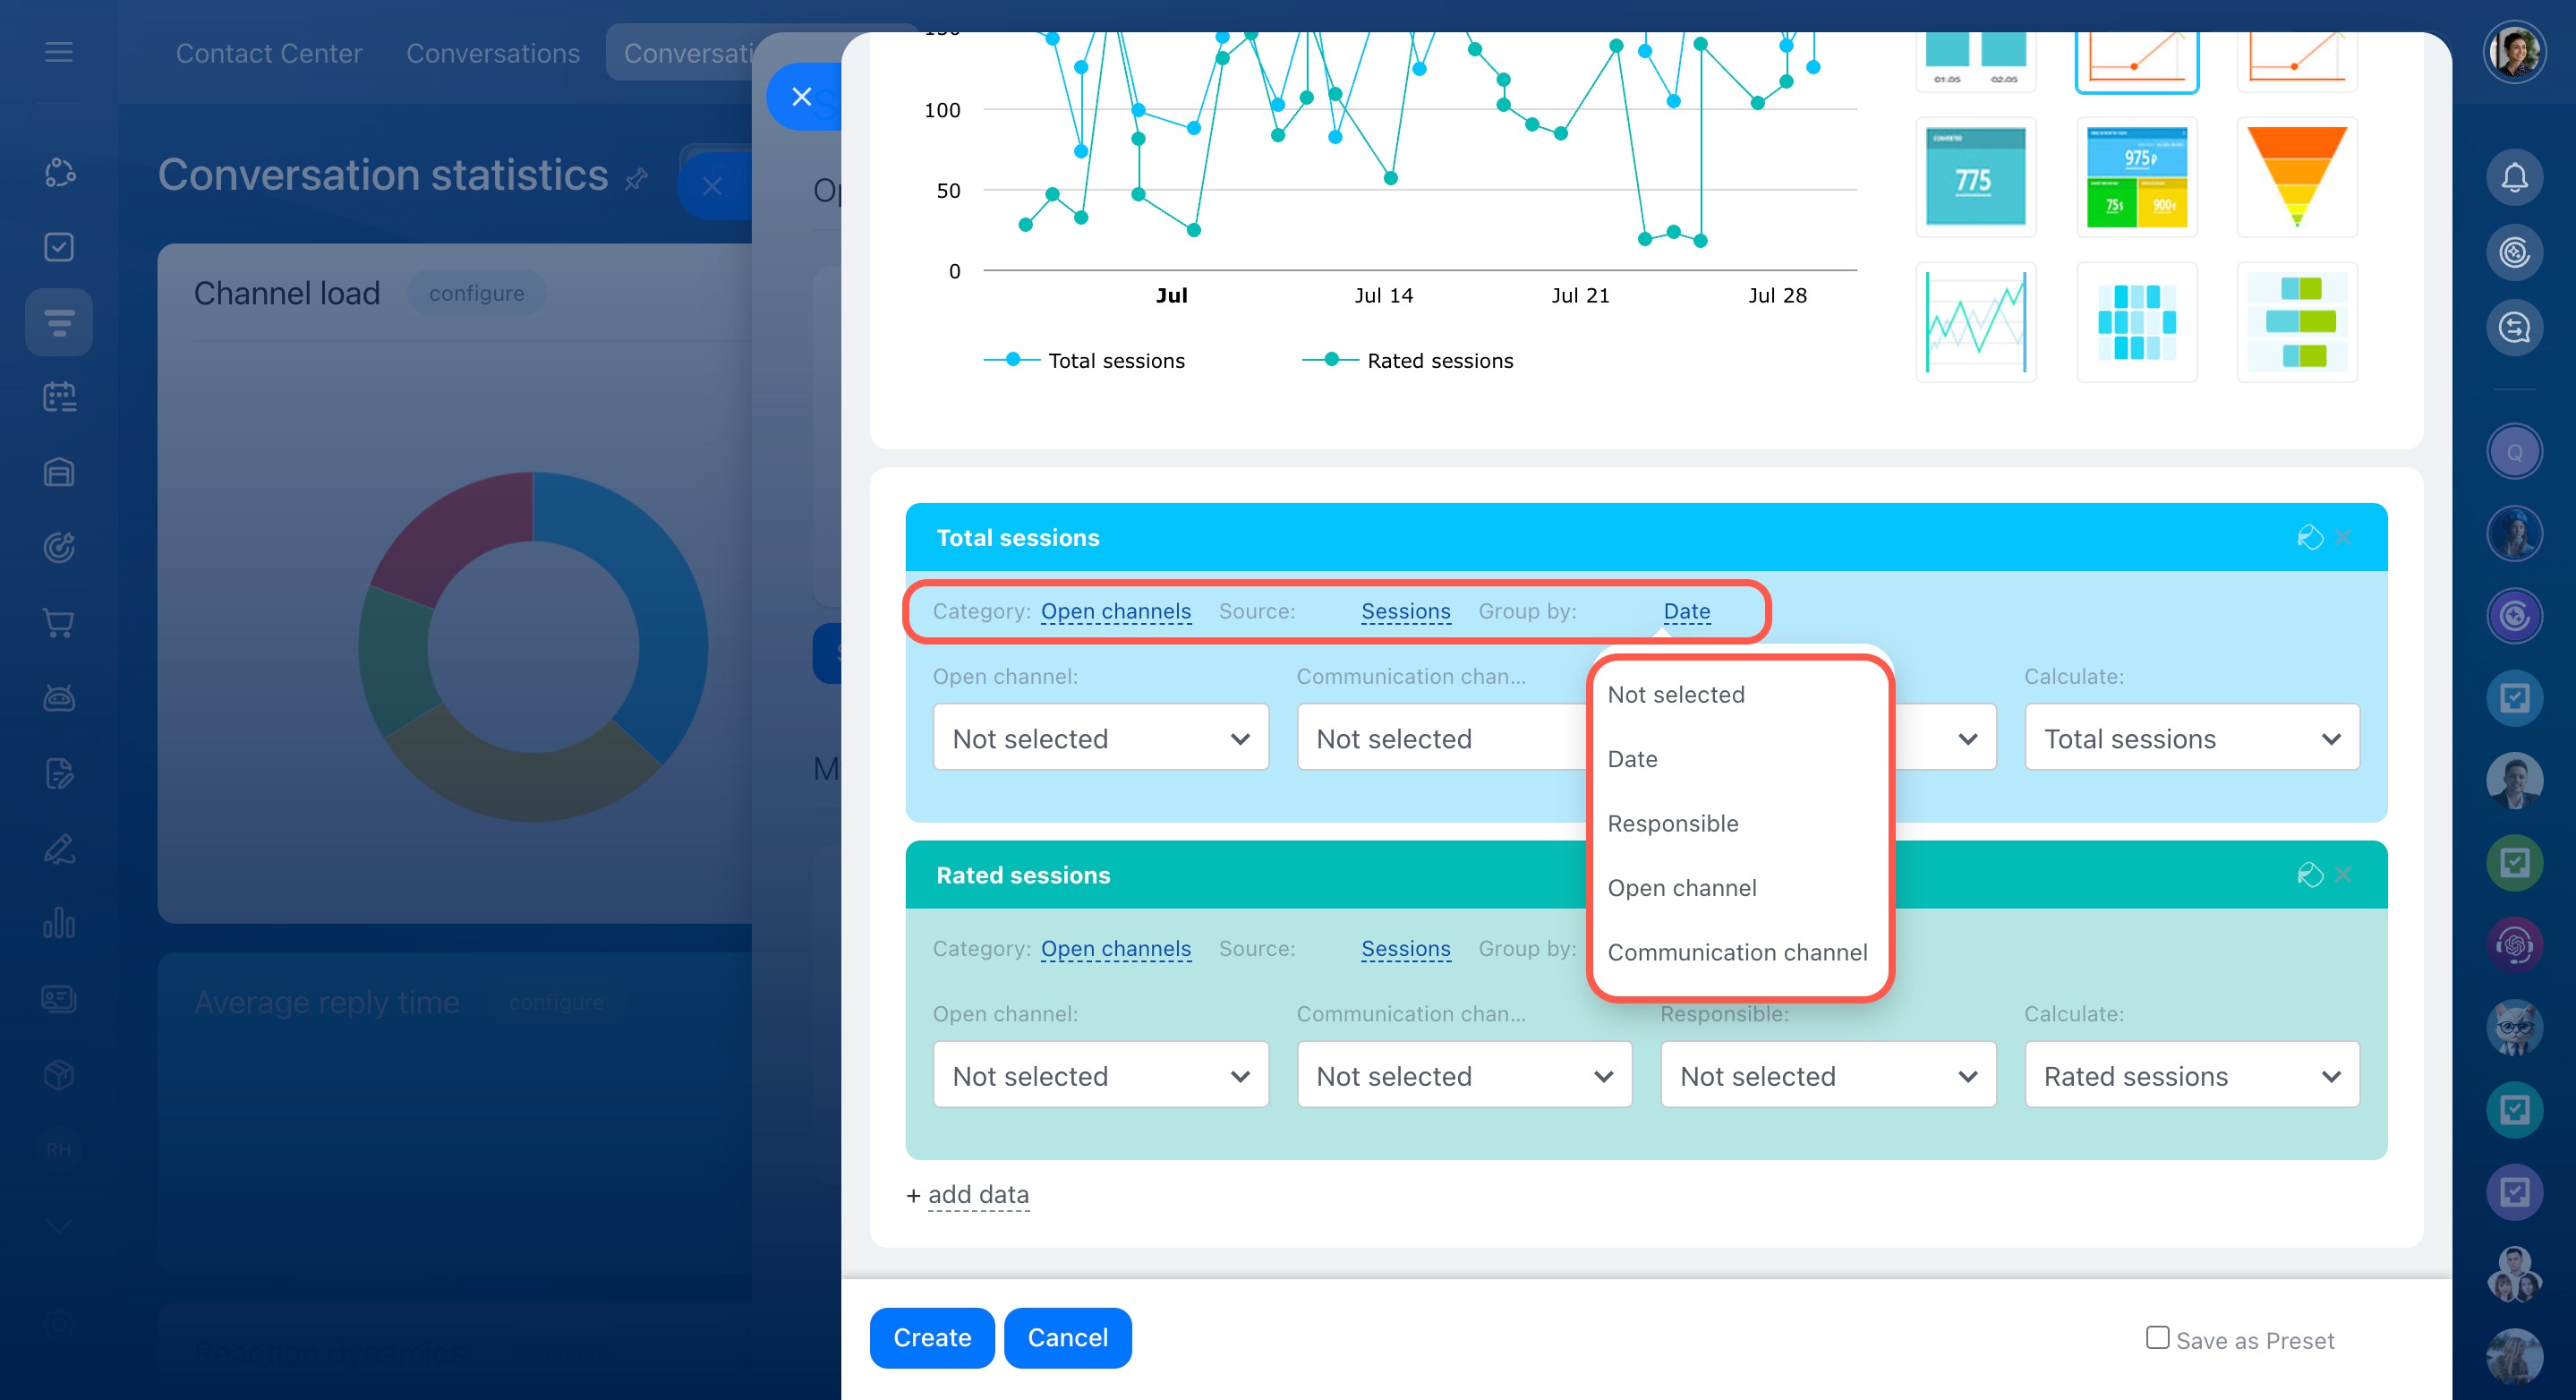
Parameters. Choose which data to include and how to group it.
- Category: The data source, set by default to Open Channels, which covers enquiries from Live chat, Telegram, Facebook, and other channels.
- Source: The specific data used in the report, set by default to Sessions for all incoming customer messages. For reply times, select Conversations to track how quickly agents respond.
- Group by: The categories used to organize data, shown on the chart’s X-axis or as sections of a diagram, such as:
- Date: Session volume by day, week, or hour.
- Responsible: To evaluate employee performance.
- Open channel: Enquiry counts from Live chat, Telegram, Facebook, or others.
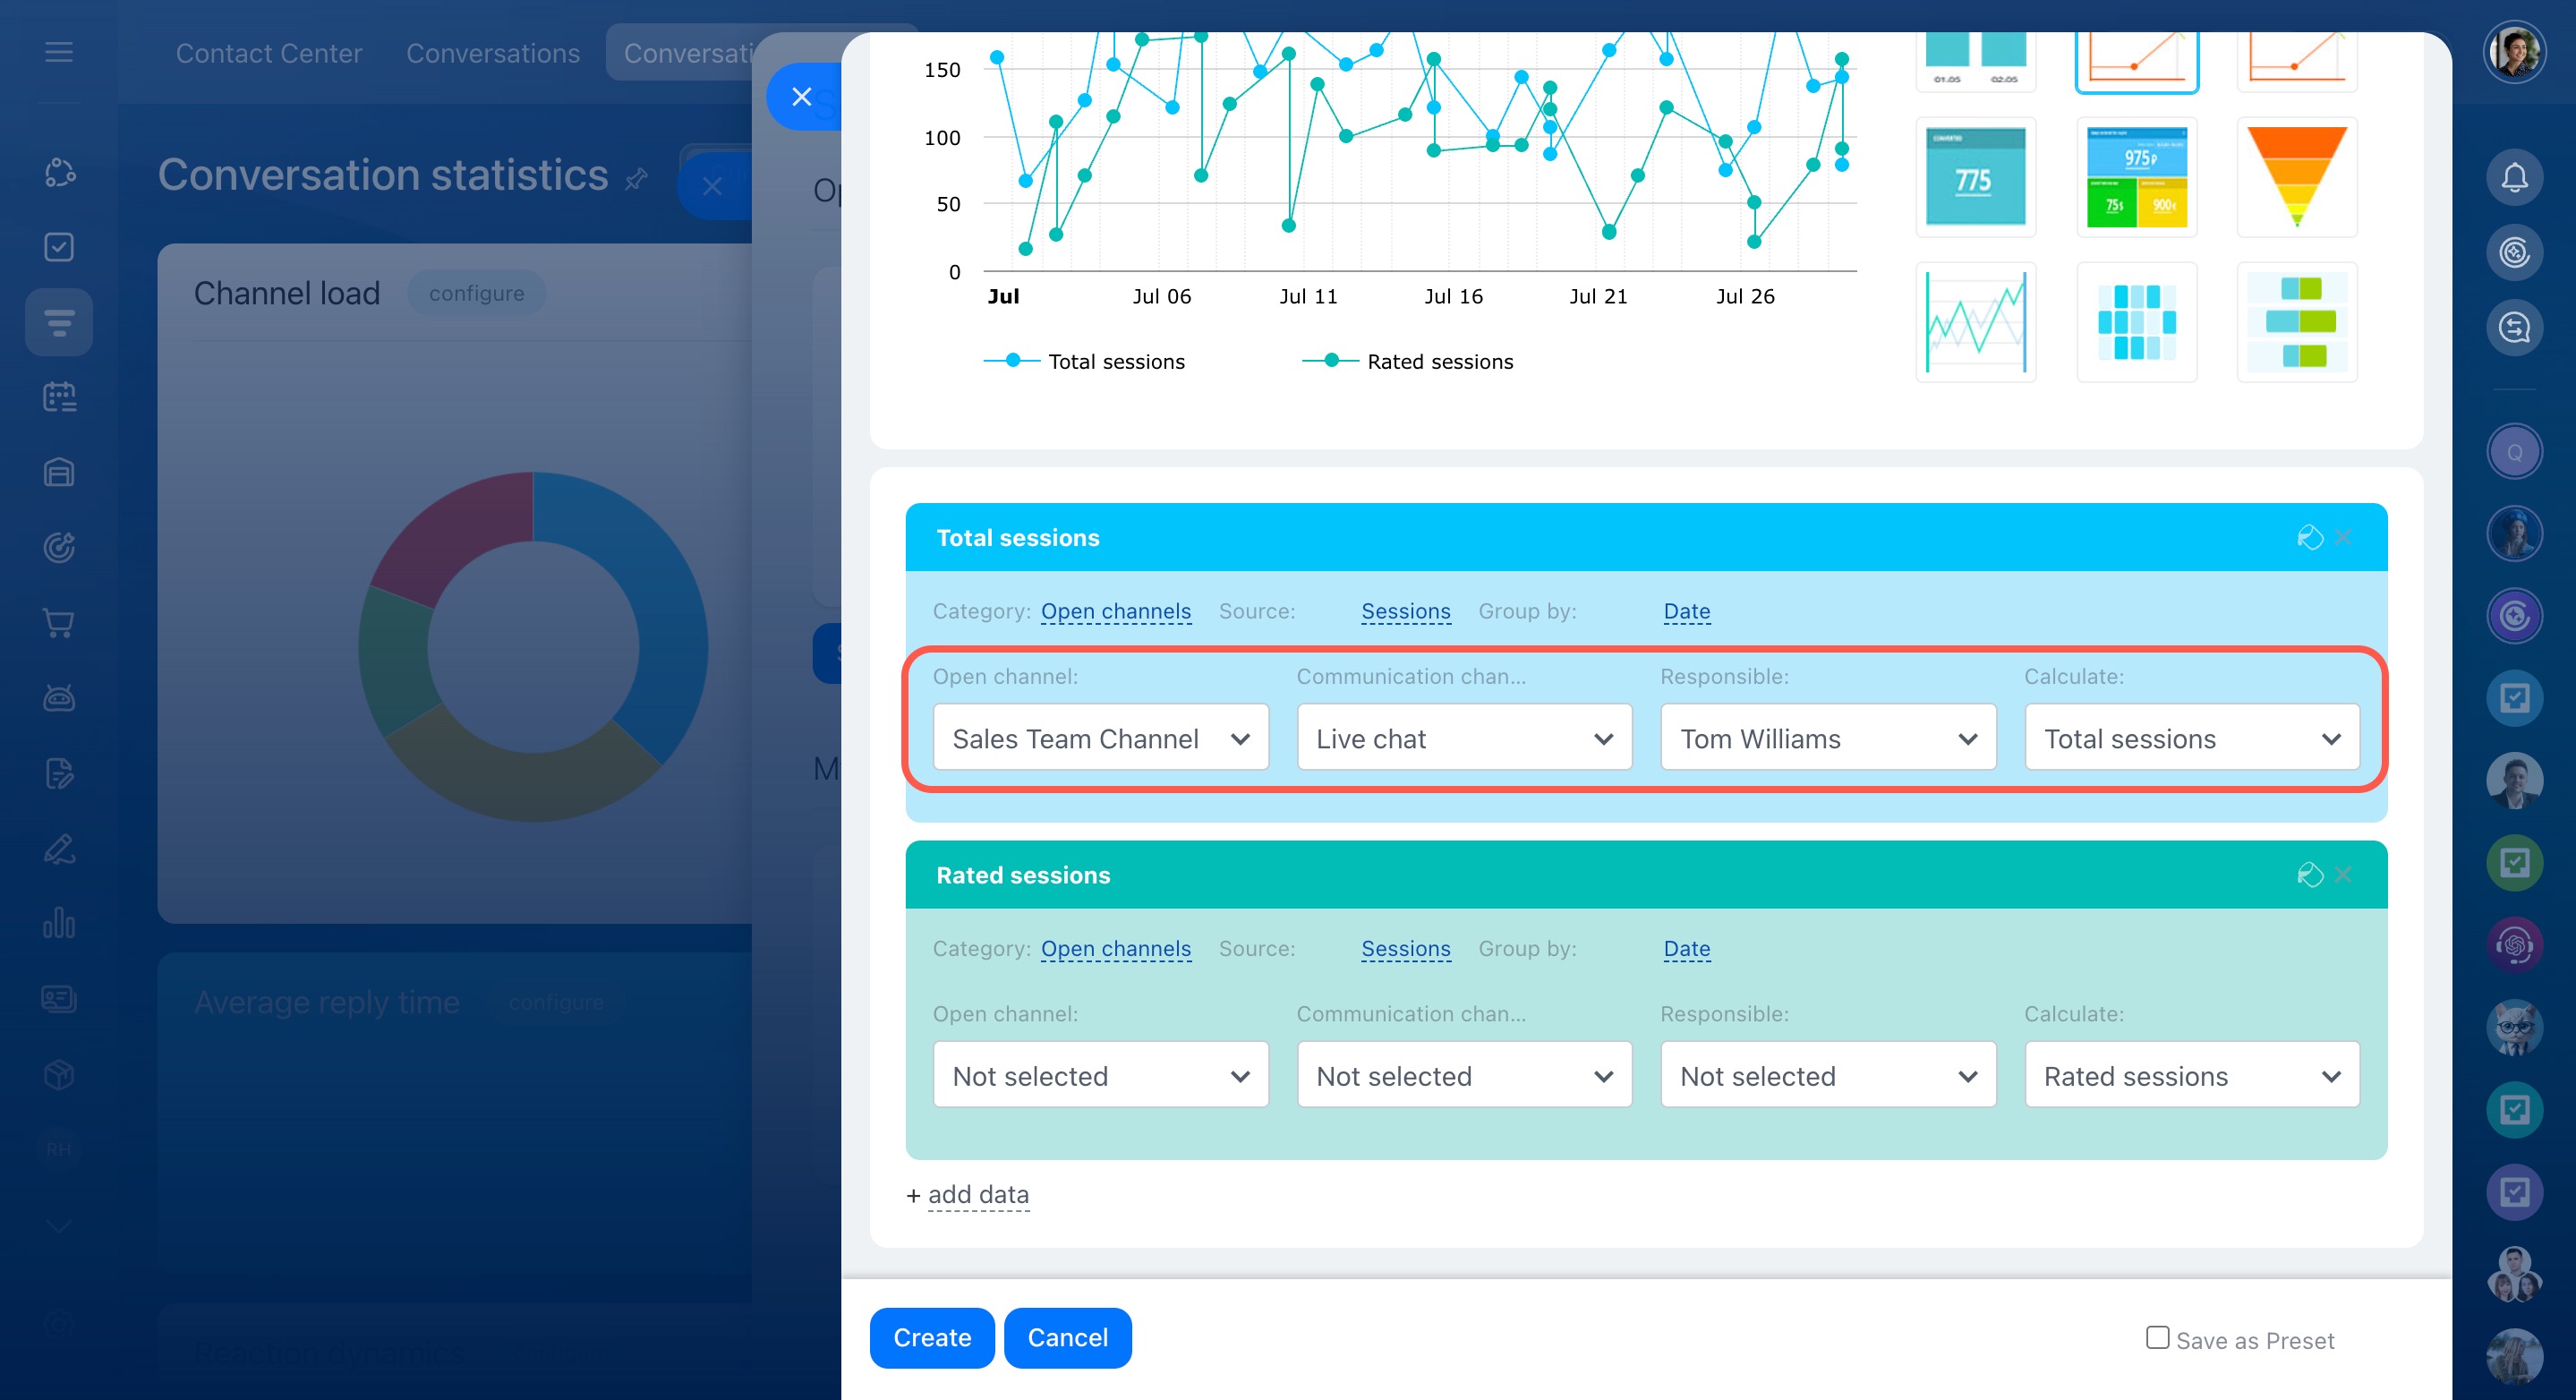
Filters. Narrow down data to focus on specific metrics, like a single agent, channel, or Open channel.
- Communication channel: Select a specific channel, like Live chat, Telegram, or Facebook, to analyze its enquiries.
- Responsible: Choose an employee to review their workload, reply time, or ratings.
- Calculate: Select a metric, like total sessions or customer satisfaction rate.
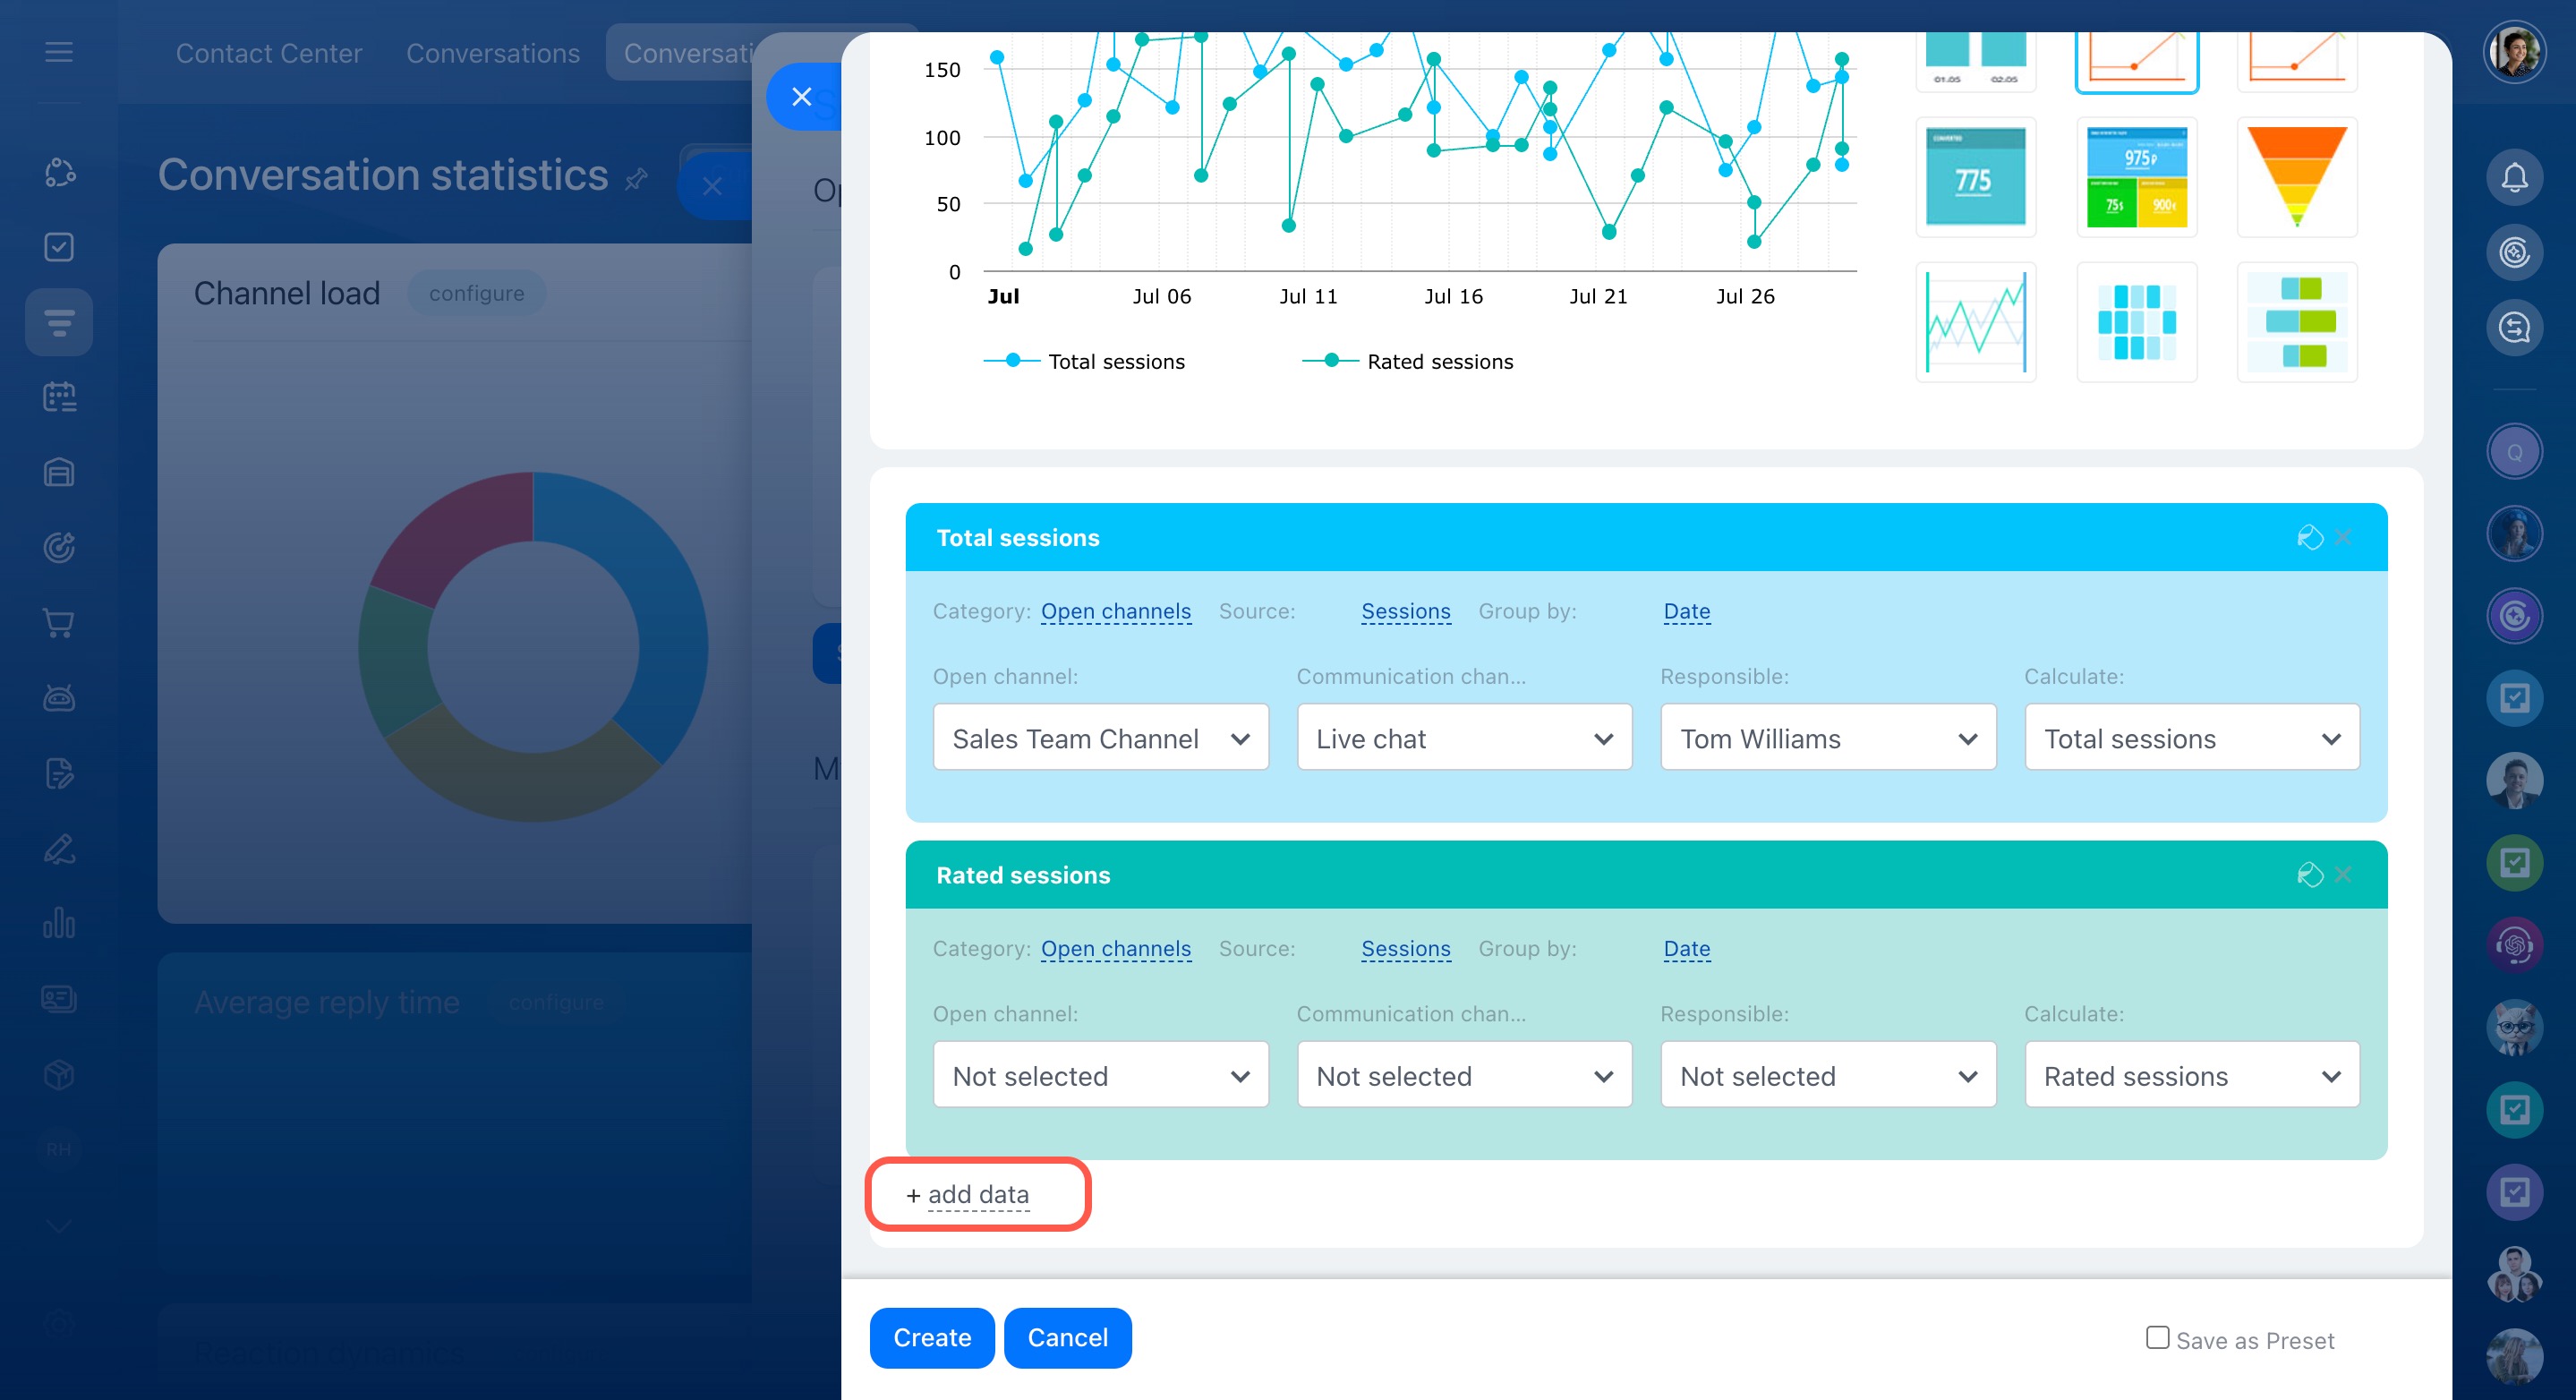
Add more data
You can compare multiple metrics, like an agent’s sessions and their reply times. Here 's how:
- Create a chart report, set the source to Sessions, group by Date, filter by Responsible, and choose the Total sessions metric.
- Then click Add data, select the Conversations source, and choose the Average reply time metric.
Adjust report appearance
Organize your reports and use colors to make key important information easier to find.
Reorder reports
Select a report, hold, and drag it to a new position. For example, it's great to place essential reports at the top.
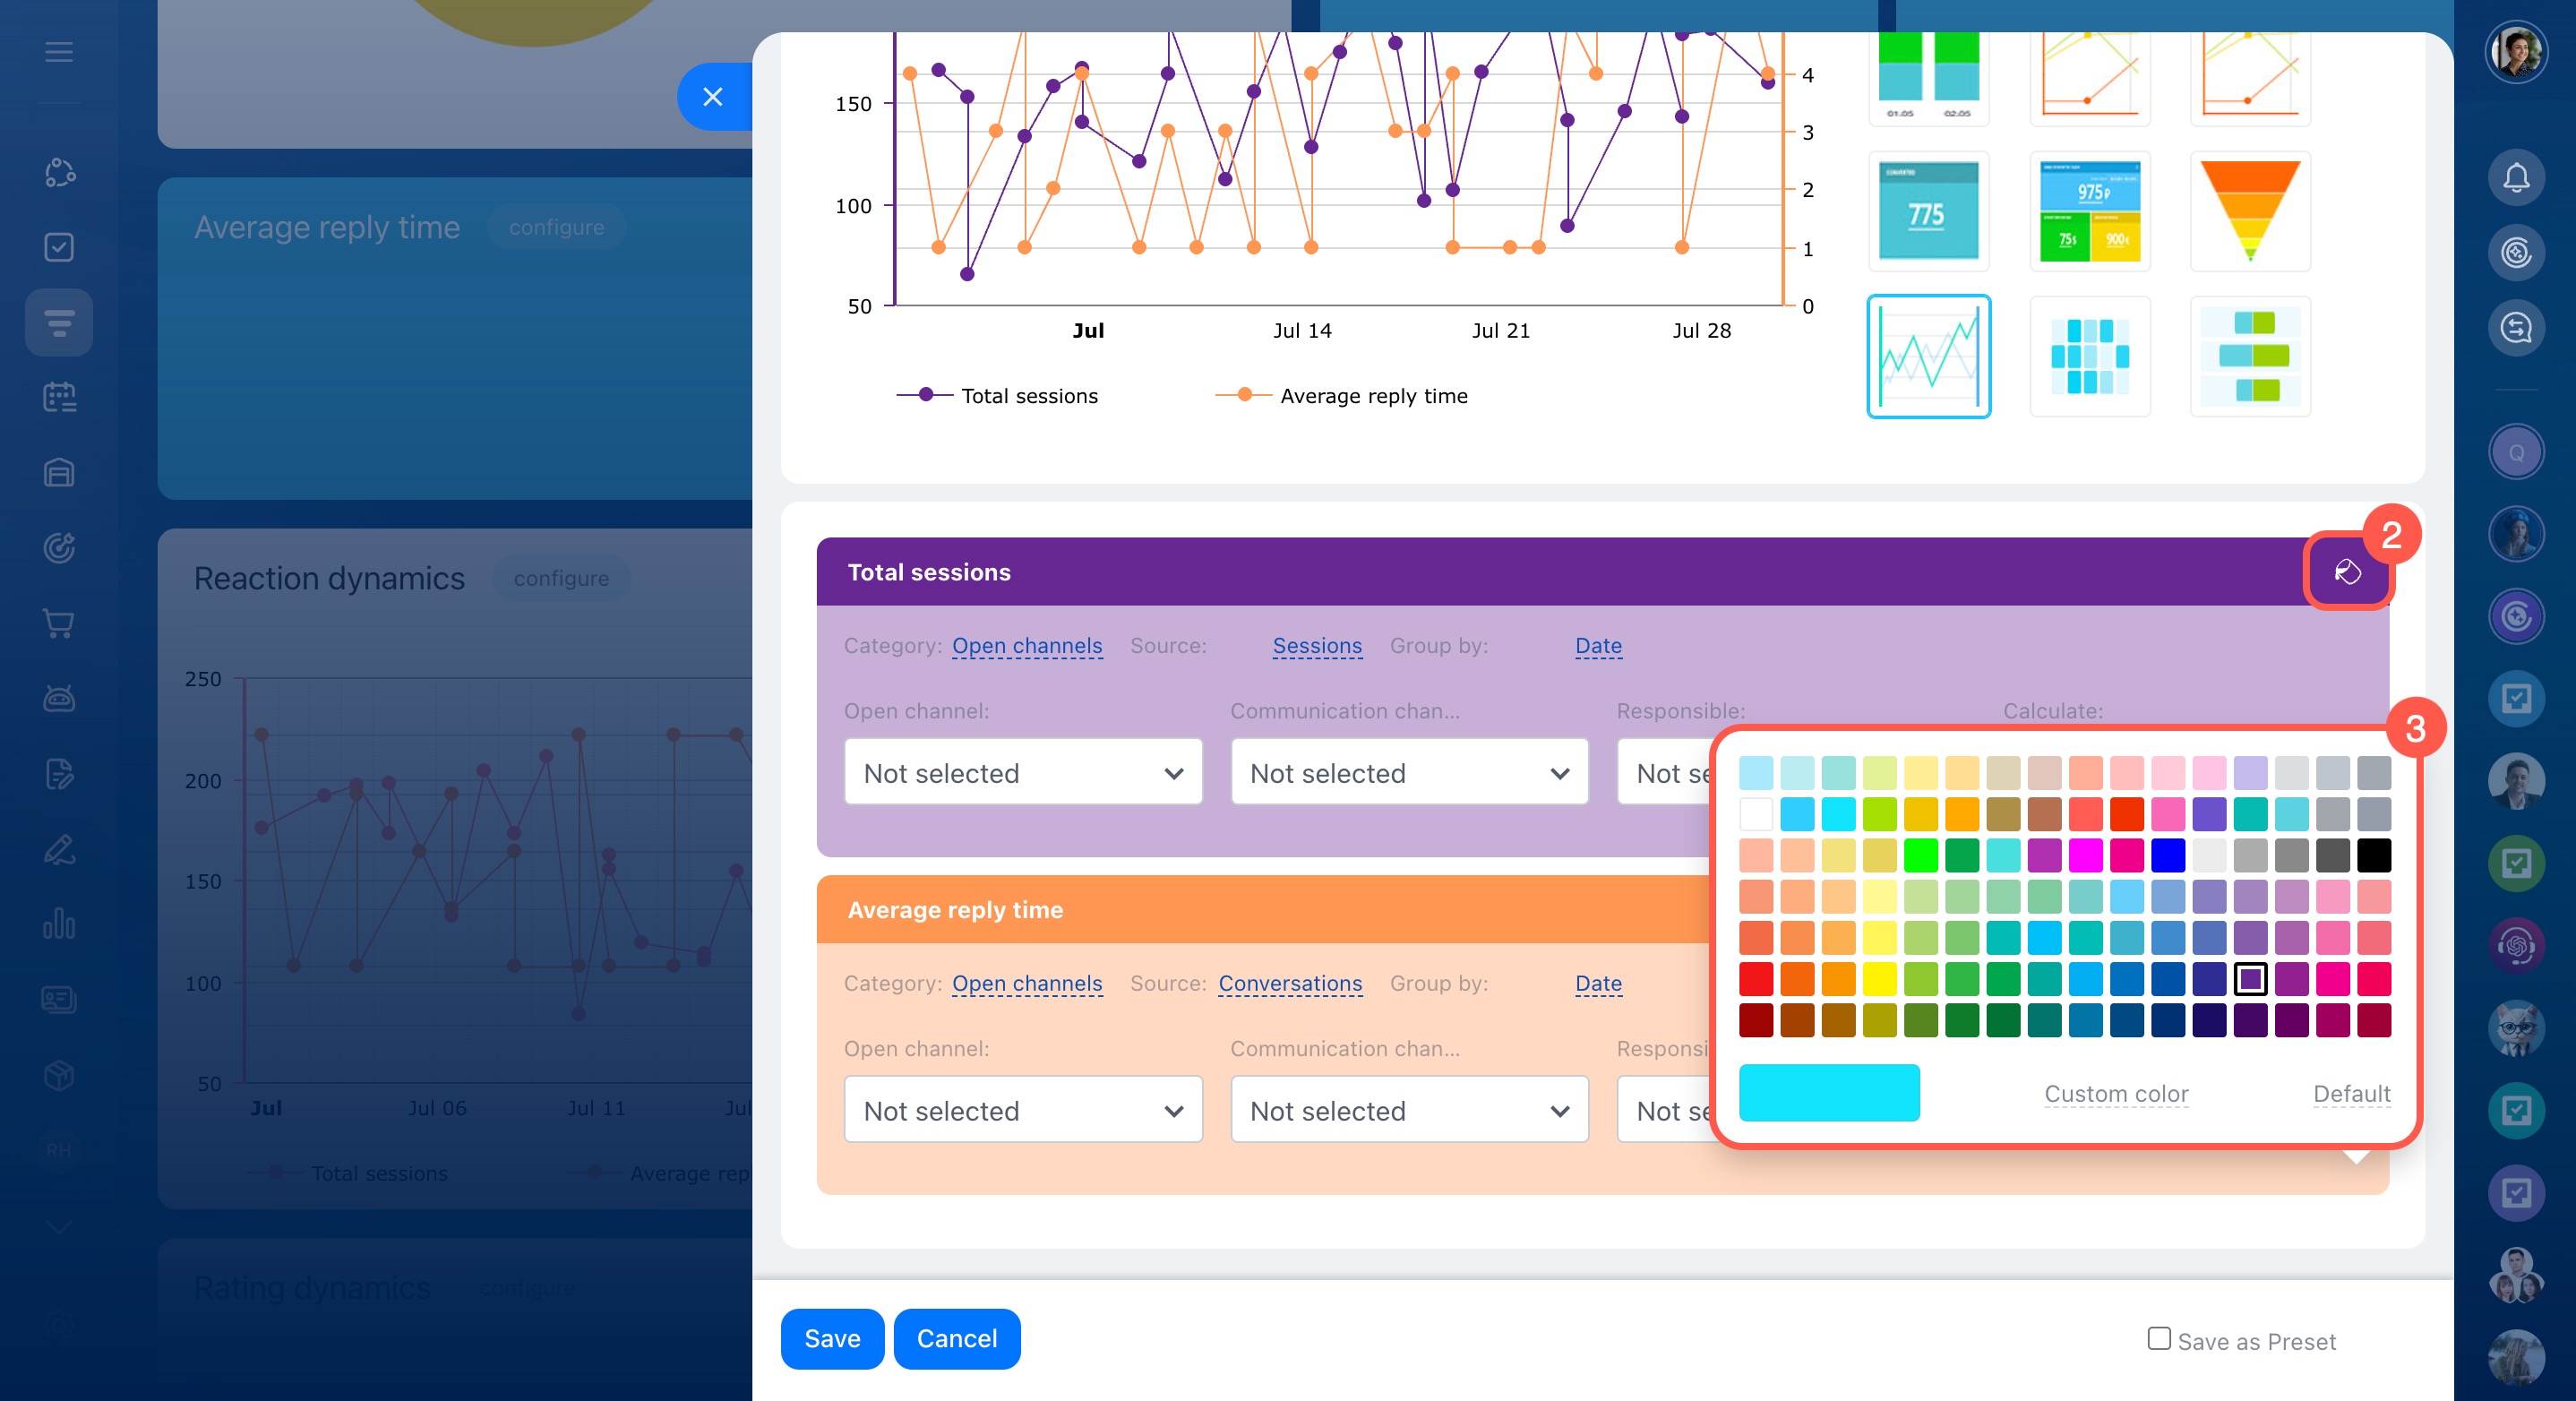
Change colors
Use different colors to organize reports and metrics. For example, assign blue to new enquiries and green to returning customers.
- Click Configure next to the report name.
- Click the fill icon (
 ).
). - Choose a color from the palette or enter a color code.
Restore default settings
If you don't need your custom reports anymore, you can quickly reset the page to its default settings. If you’re just starting and don’t have data yet, enable demo mode to see sample reports and set them up in advance.
- Click Settings (⚙️).
- Choose an option:
- Reset to default: Restore the report panel to its original setup.
- Enable demo mode: Use demo data to test and configure reports before real enquiries come in.
Delete a report
To remove a report you no longer need:
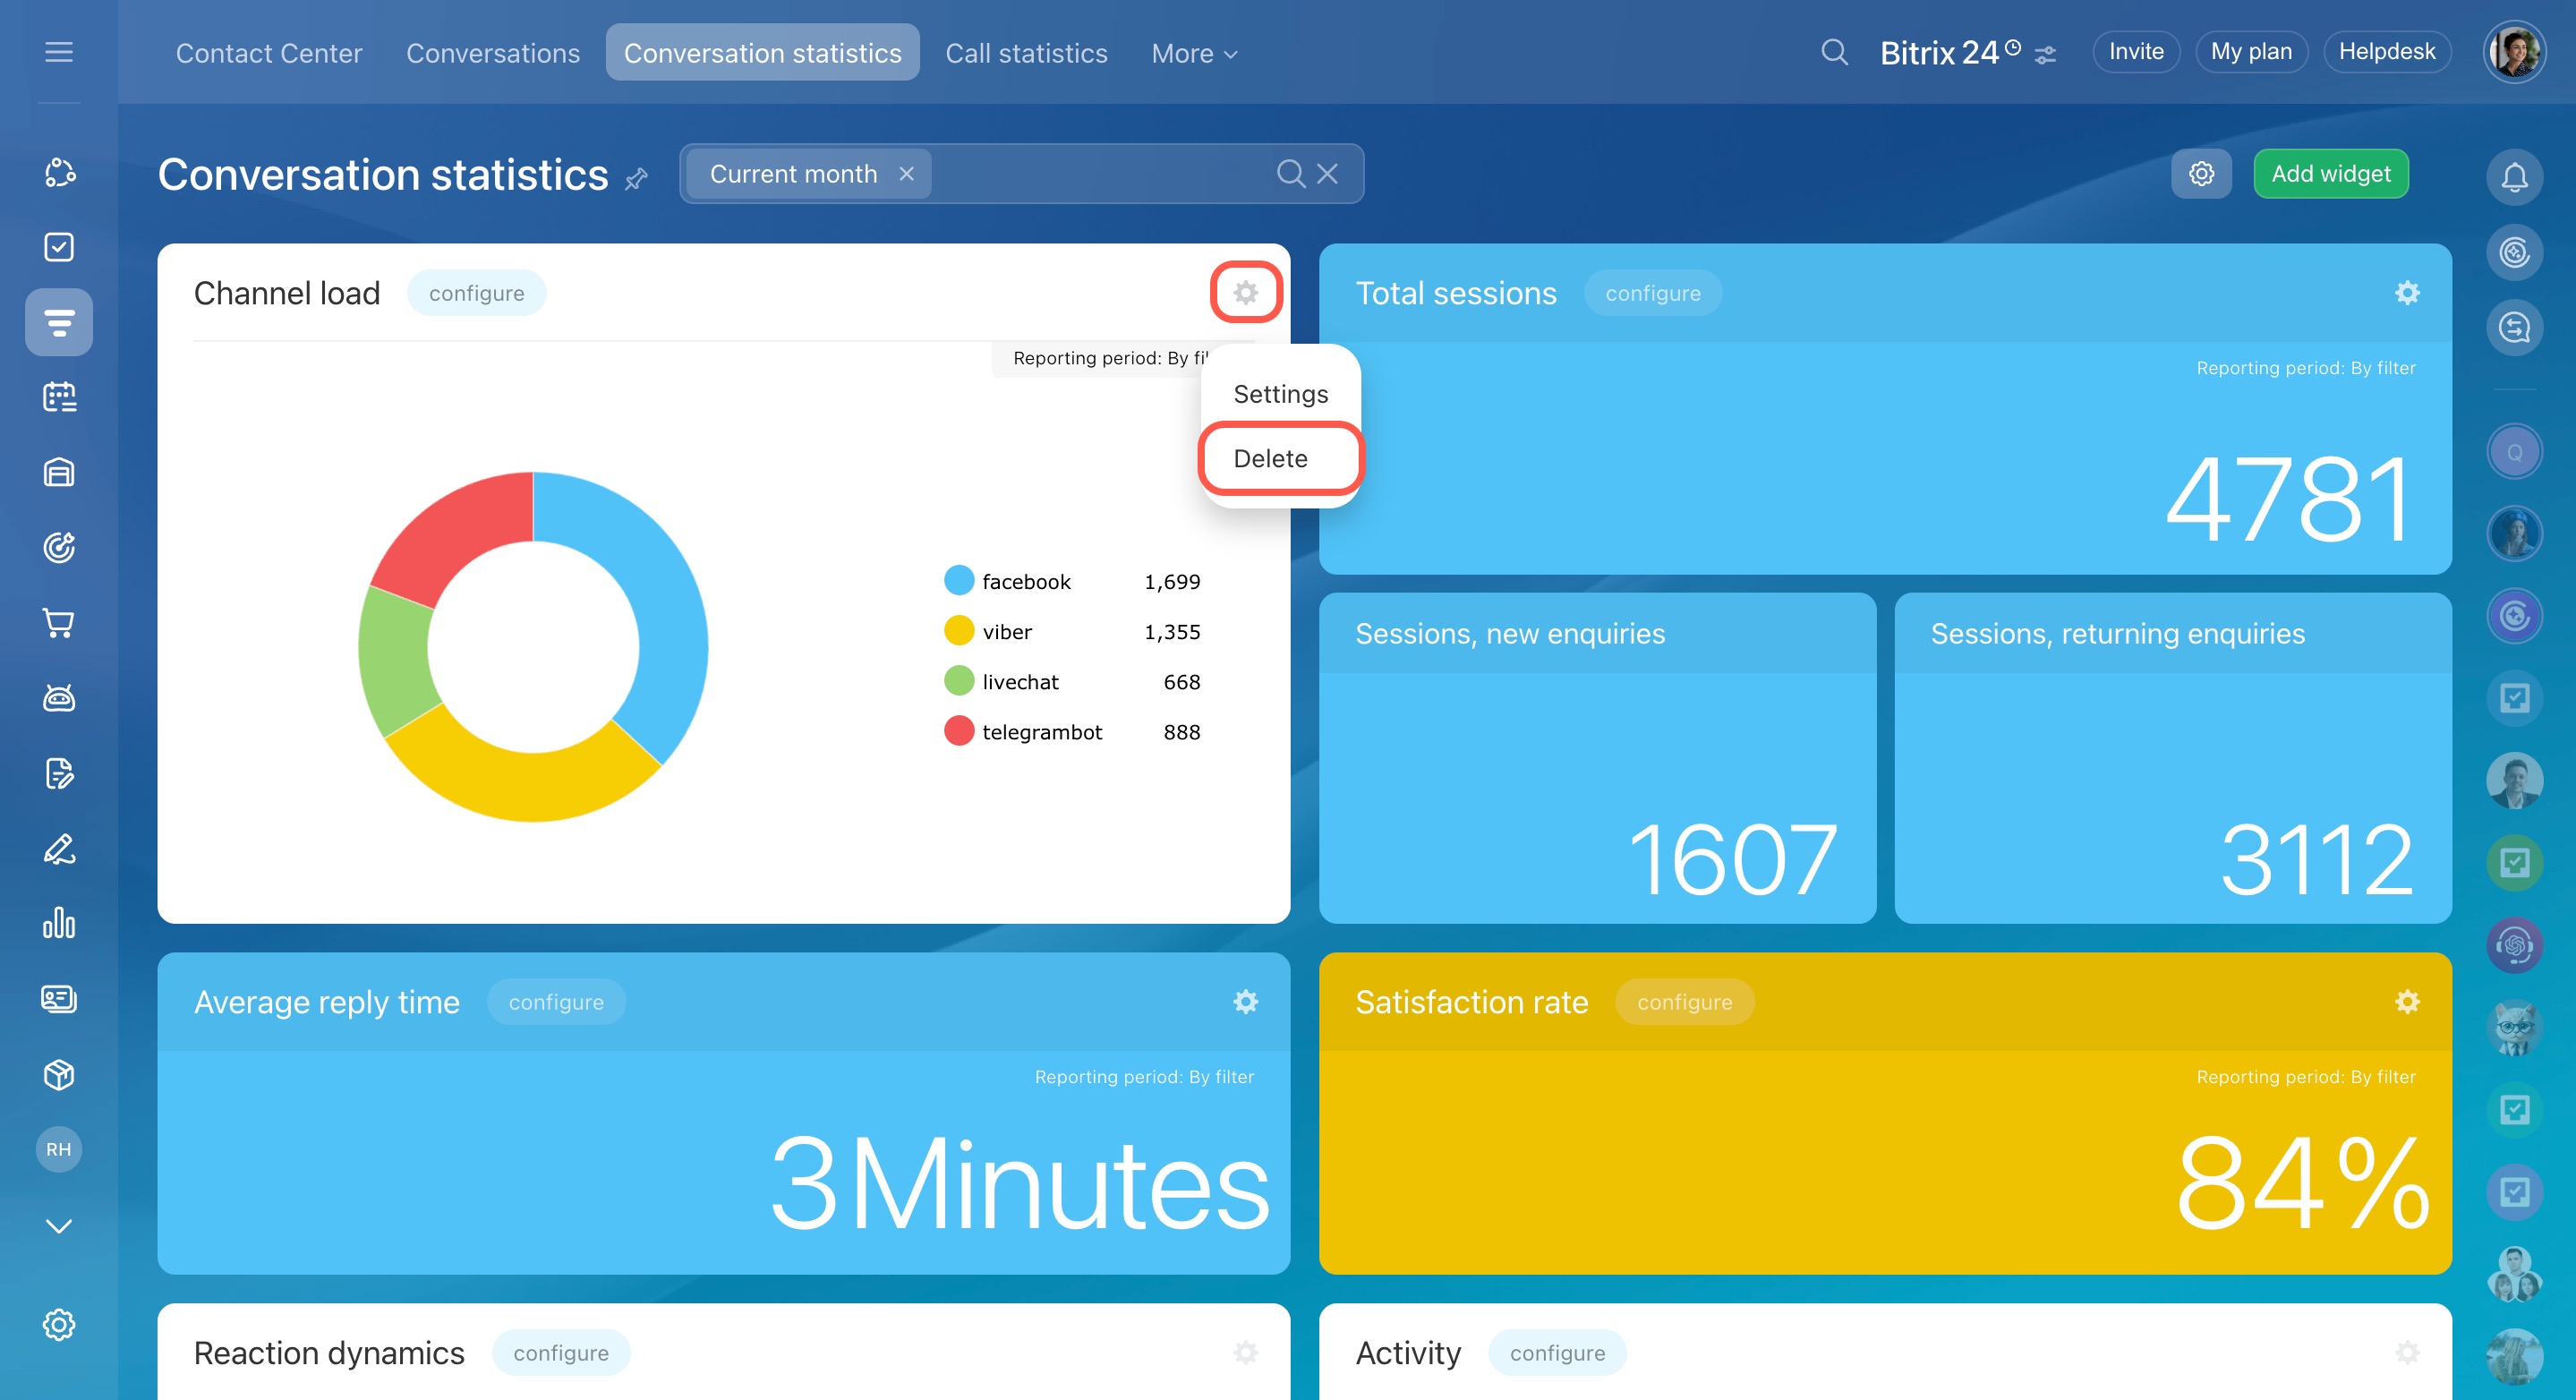
- Click Settings (⚙️) next to the report.
- Select Delete.
In brief
-
Conversation statistics provide an overview of your team's interactions with customers in chats, including reply times, customer ratings, and the most-used communication channels.
-
Access statistics in CRM > Customers > Contact center > Conversation statistics. The first time you open it, demo data will be shown instead of real enquiries.
-
Built-in reports highlight key metrics like agent workload, reply time, and customer ratings. These reports are ready to use or customize.
-
The Total sessions metric counts only conversations where an agent responded. Transferred conversations are counted multiple times if each agent replies.
-
All reports use the same period by default, but you can set different periods for each report as needed.
-
Create custom reports to compare agent workloads or monitor daily reply time trends.
-
Customize reports with display types, grouping methods, and filters to find out which agent responds the fastest or which channels are used most.
-
Reorder reports or assign colors to quickly find the information you need.
-
Reset the page to default settings if custom reports are no longer needed, or enable demo mode to preview functionality.
-
Delete reports you don't need to keep your workspace organized.

