The Gantt chart is a type of bar chart developed especially for illustrating a project schedule (task duration, deadlines, and dependencies). It comes in handy when planning tasks that need to be done in a specific order but do not have any definite deadlines.
How to use Gantt chart
Go to the Tasks and Projects section and select the Gantt view.
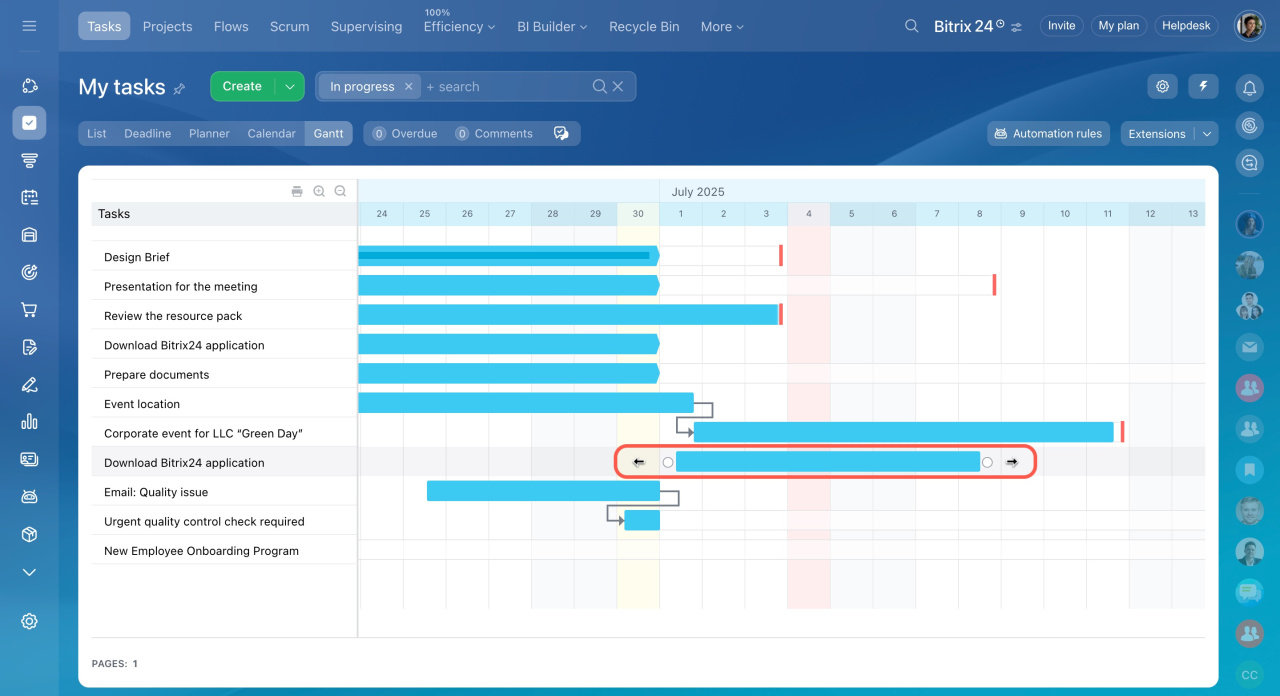
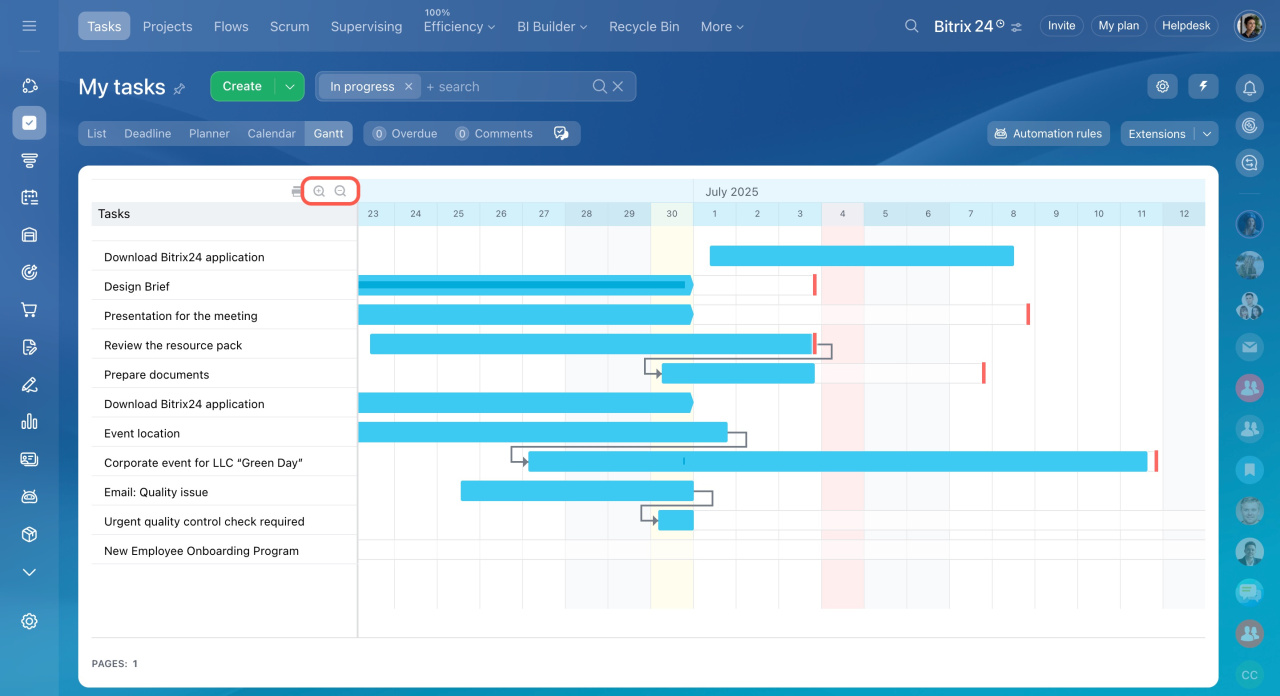
The chart provides a mechanism for the visual editing of the task schedule using task bars. Each task has the Start date, End date, and Deadline.
-
The left edge of the bar represents Start date.
-
The right edge of the bar determines End date.
-
The vertical red line displays Deadline.
Drag the sides of the blue task bar to change the Start date or End date. Or drag and move the whole task bar across the chart to shift the period for performing a task.
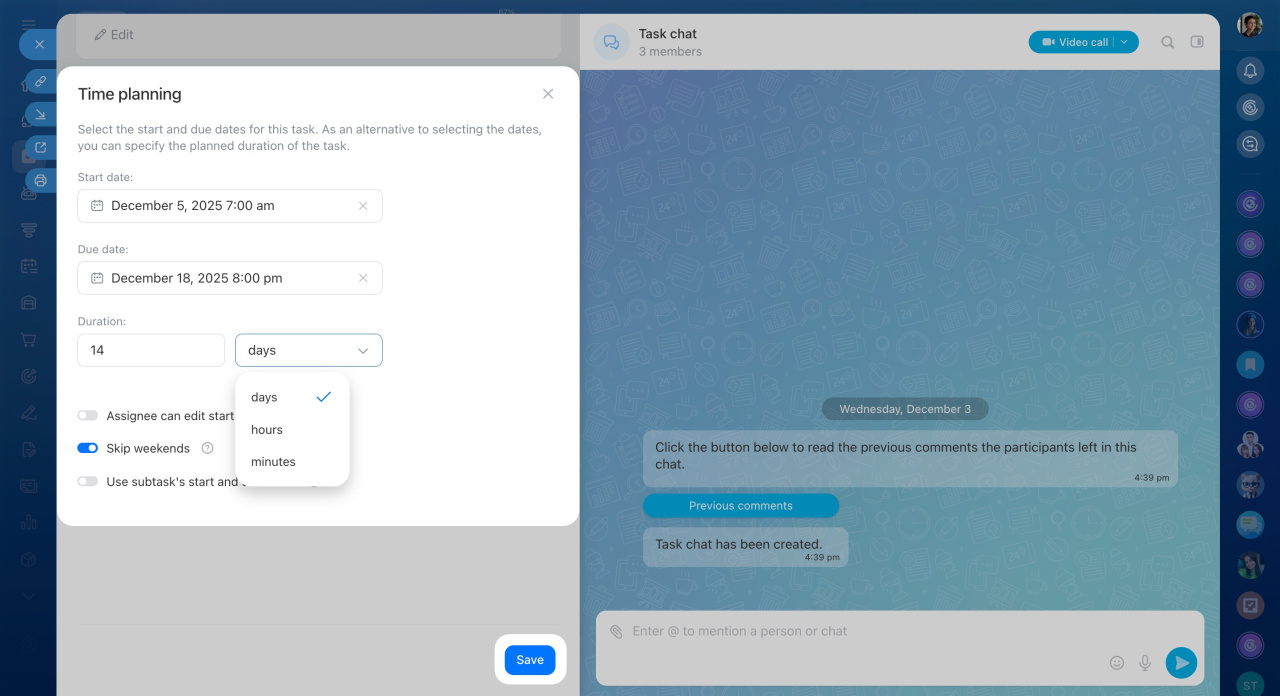
You can set the Start date and End date inside the task form in the Time planning section.
If you don't specify the End date, the task bar will be shown in the form of a pentagon.
Also, the task bars display the following details:
-
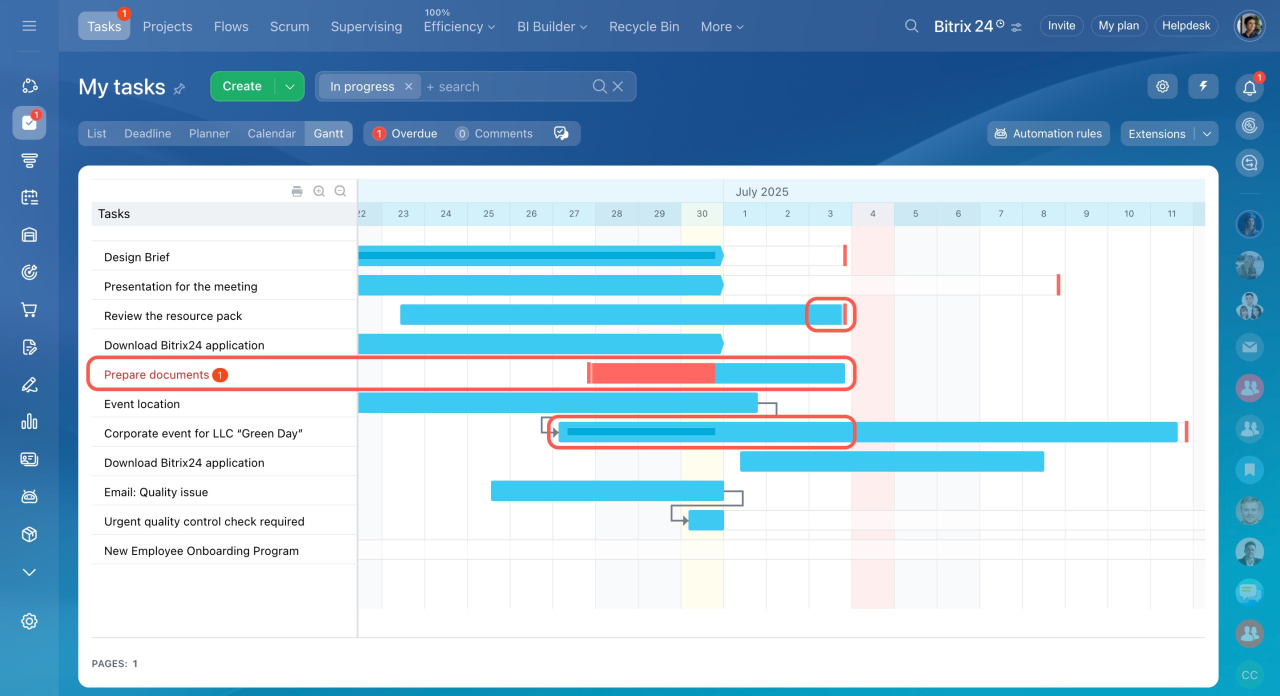
The task bar is partly marked in red if the task is overdue.
-
The vertical red line displays the task's deadline.
-
The dark thin line on the task bar displays the period when you worked on the task.
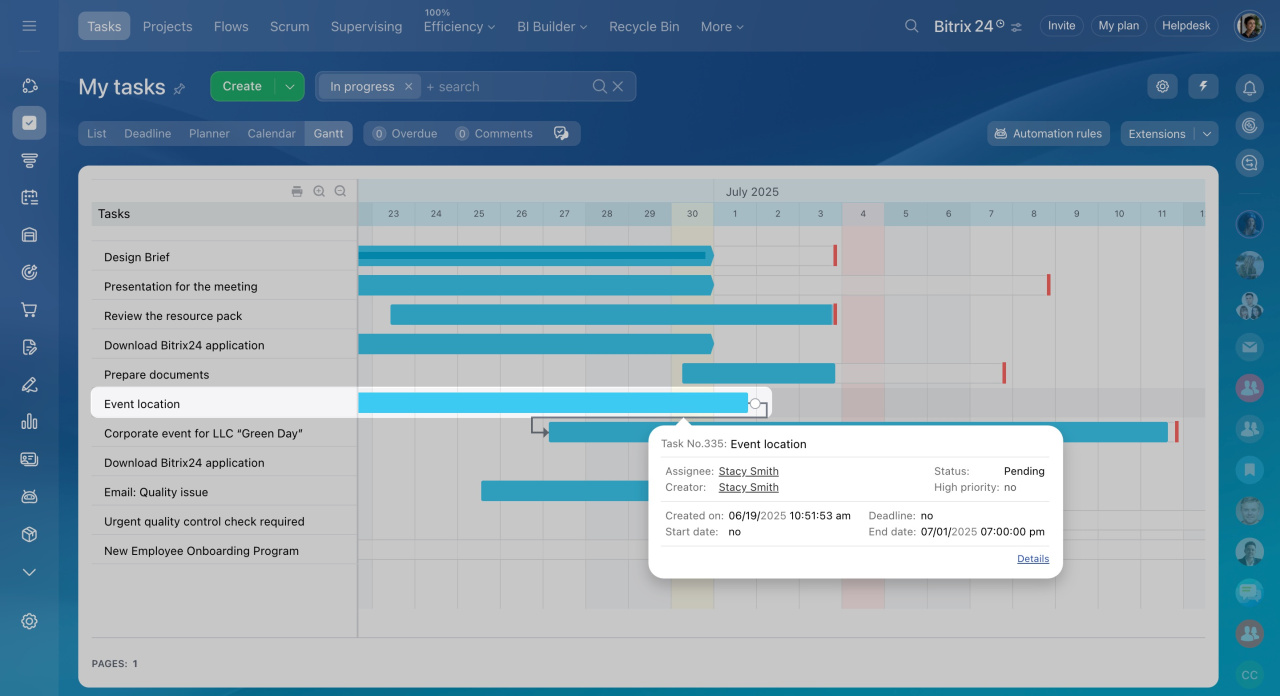
Hover the cursor over the task bar to see general information about it.
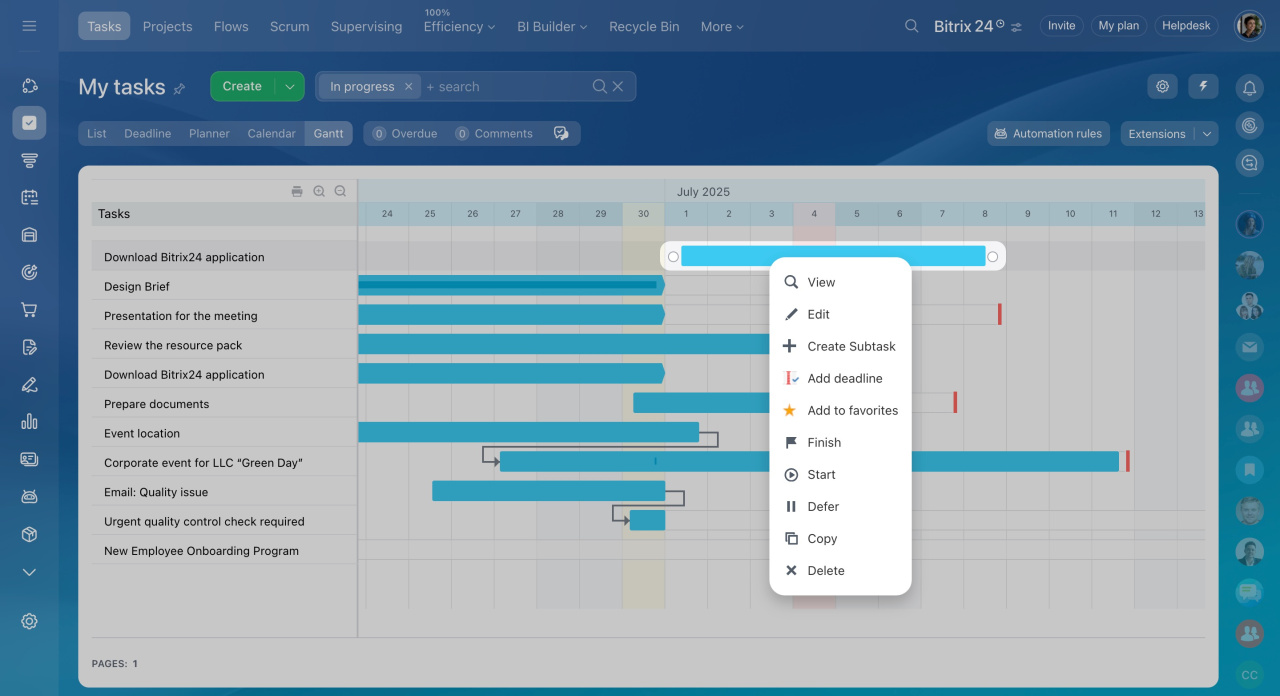
To edit the task, right-click the task bar and select an action from the drop-down menu. Also, you can double-click the task bar to open the full task form view.
To scale the chart, use the + and - icons on the left.
How to create task dependencies in Gantt chart
Task dependencies determine the order in which tasks need to be performed. Thus, you can visually indicate which tasks are primary and which ones are dependent.
Create a dependency between the tasks by dragging the line between them. For instance, you can use the Finish-to-Start dependency type. In this case, when moving the End date of the main task, the Start date of the dependent task will be changed accordingly.
Task dependencies in Gantt chart
In brief
-
Gantt chart is a type of bar chart developed especially for illustrating a project schedule.
-
Tasks are represented as blue bars on the chart. Each task has the Start date and End date that indicate the approximate dates and times for performing a task.
-
You can create dependencies between the tasks. They help keep the sequence of tasks if you change the Start date and End date of the parent task.


