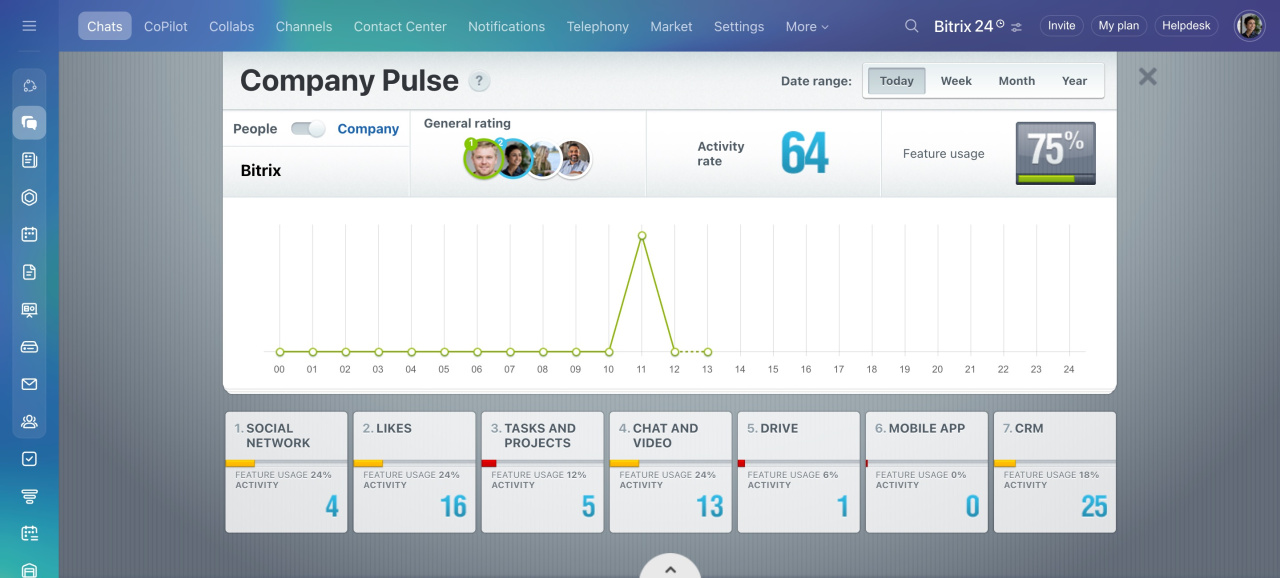
Company Pulse is an overall activity of users in your account. It helps you see how well Bitrix24 is being used in your company’s daily work. The statistics cover overall activity and break it down by tools. The data is calculated based on the selected period, user, and feature.
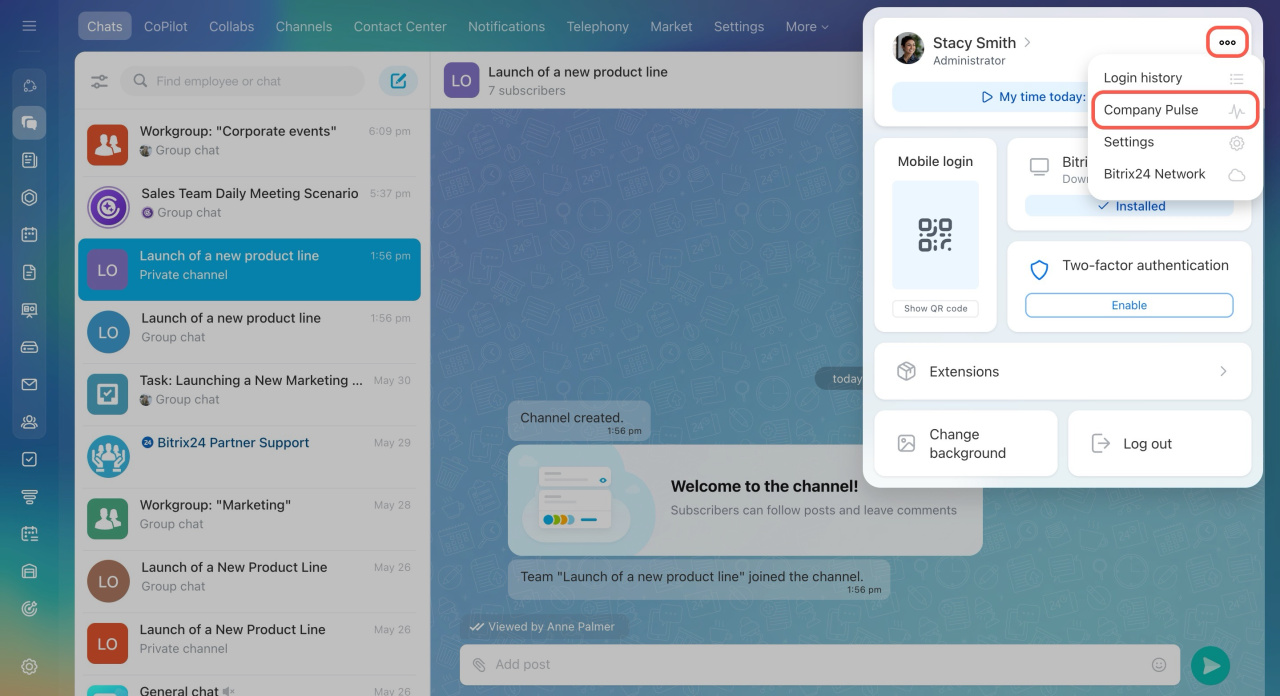
To access the Company Pulse:
- Click your photo in the top right corner.
- Open the three-dot menu (...).
- Select Company Pulse.
Learn what indicators the chart provides and how to interpret the Company Pulse statistics.
Main Bitrix24 tools
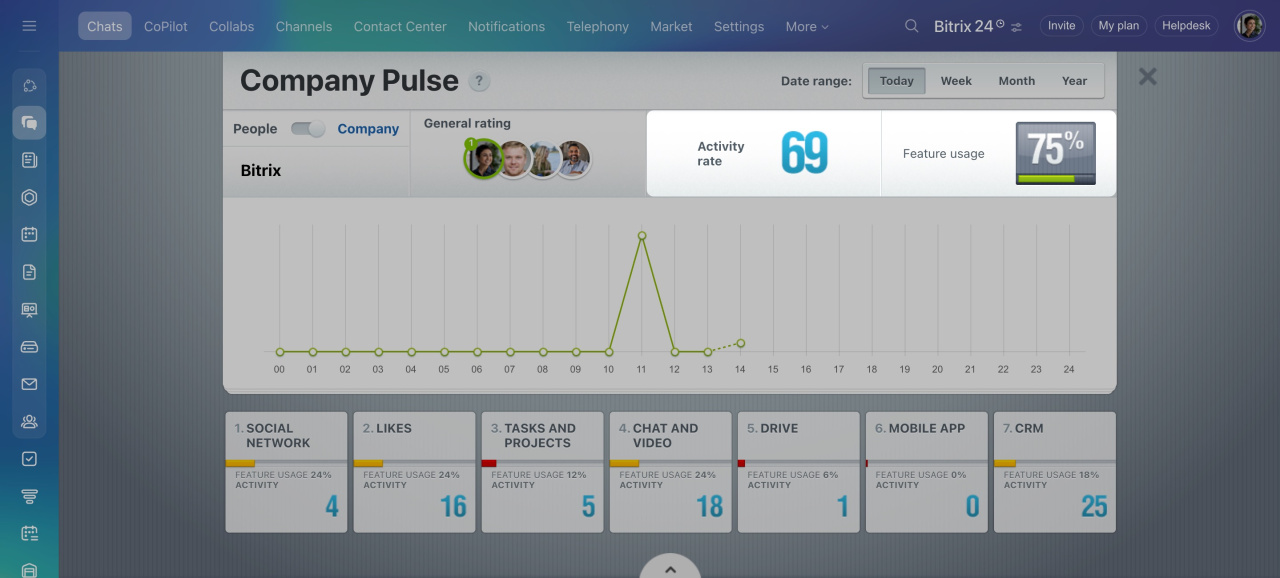
The bottom section shows seven main tools of Bitrix24:
- Social Network: Posts and comments in Feed.
- Likes: Likes for posts, comments, and other items.
- Tasks: Actions applied in tasks, such as creating new tasks, adding comments, or changing deadline.
- Chat and video: Messages and calls in Messenger.
- Drive: Files uploaded to Bitrix24 Drive using the Bitrix24 Messenger app.
- Mobile app: Actions applied in the mobile app. Any changes are counted, like sending messages or applying changes in tasks or CRM.
- CRM: Actions applied in CRM, like modifying leads, deals, or contacts.
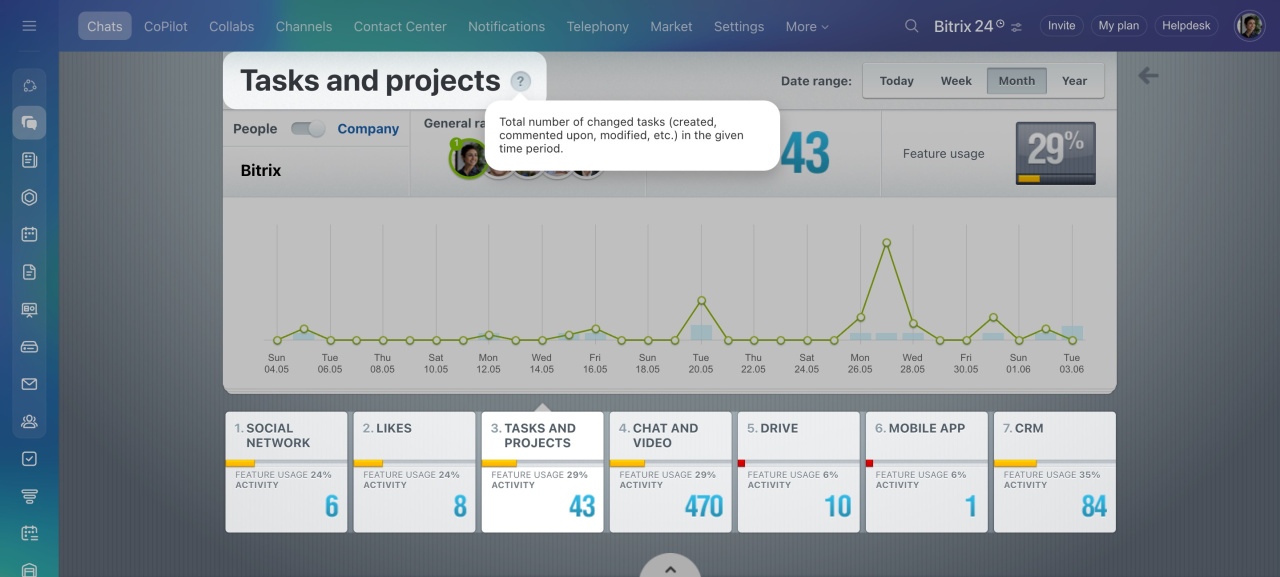
By default, the chart displays general data, but you can view the rating for each tool. Just select a tool at the bottom, and the chart will show its usage statistics. For a detailed explanation of the indicator, click the question mark next to the tool name.
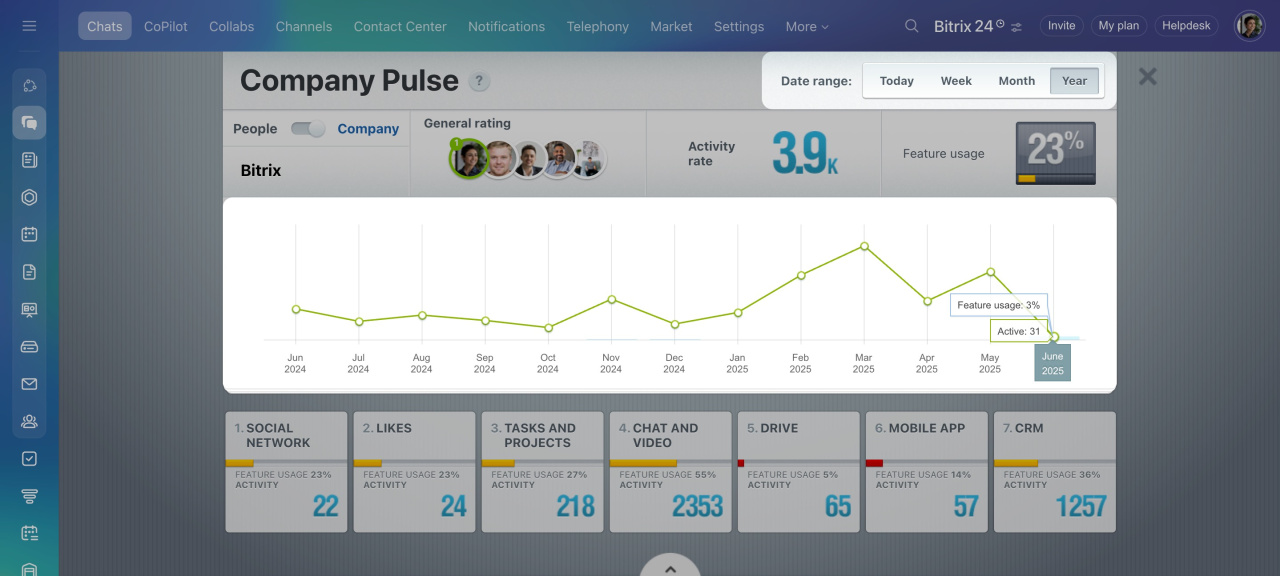
Date range
Select a time period to view the data: today, week, month, or year. In Week or Month view, you can hover the cursor over a specific date in the chart to see detailed statistics for that day.
Key indicators
Company Pulse uses the concepts of rating, activity, and feature usage. Each of these can be calculated depending on the selected tool, user, and period.
Rating. This is based on the activity of employees who have used Bitrix24 tools at least once during the selected period. You can view each employee's overall rating or their rating for a specific tool.
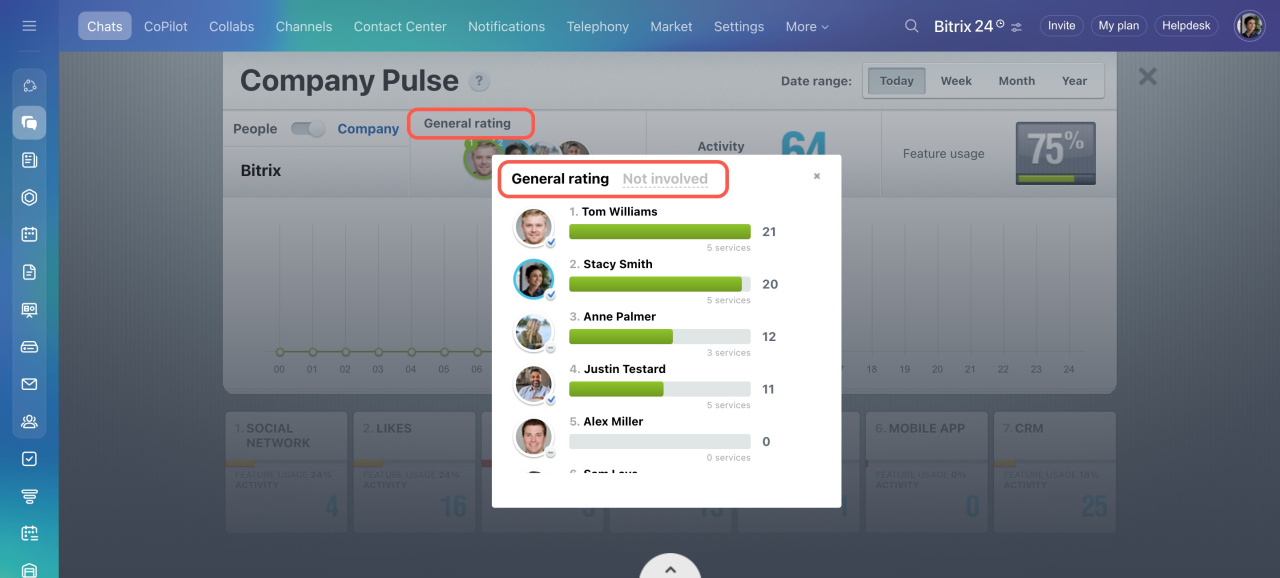
Click General rating to see the following:
- The General rating tab shows a list of the most active users and how many tools each of them uses in Bitrix24. This helps you analyze team activity and understand how well the main tools are being adopted.
- The Not involved tab shows the list of employees who use less than four tools. If you check this tab for a specific tool, it will show users who don't use this tool at all.
Activity. This is the total number of actions employees performed in the account using any tools during the selected period. It reflects how actively employees use the tools.
Feature usage. This shows how well the account features are integrated into your company's work. It calculates the percentage of employees who use at least four tools.
People and Company modes
By default, Company Pulse shows data for the entire company. To view individual ratings:
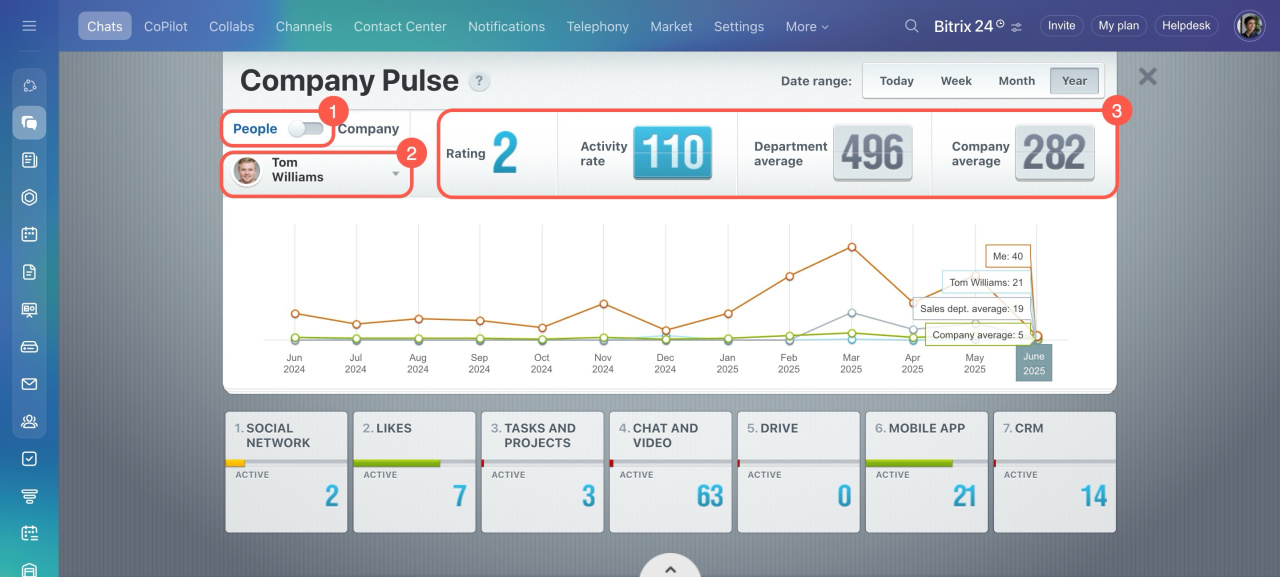
- Turn on People mode using the toggle switch.
- Click the arrow and select an employee from the list.
- Check their rating, activity index, and their department's and company average index.
The chart includes four lines showing different trends:
- Blue: The selected employee’s activity rating.
- Orange: Your activity rating.
- Green: The company's average rating.
- Gray: The average rating for the employee’s department.
Hover over the chart to see specific data points.
Data updates happen at different times depending on the selected mode and date range. In People mode, an employee’s rating updates instantly. In Company mode, it updates based on the selected period:
- Today: Updates every minute
- Week: Updates every hour
- Month: Updates every hour
In brief
-
Company Pulse provides an overview of user activity in your Bitrix24 account, helping you track how well the tools are integrated into your company’s work.
-
It offers statistics on overall activity, tool usage, and feature adoption, with data calculated based on the selected period, user, and tool.
-
The chart displays general data by default, but you can also view detailed statistics for individual tools or employees.
-
Switch between Company and People modes to view either company-wide trends or individual employee performance.

