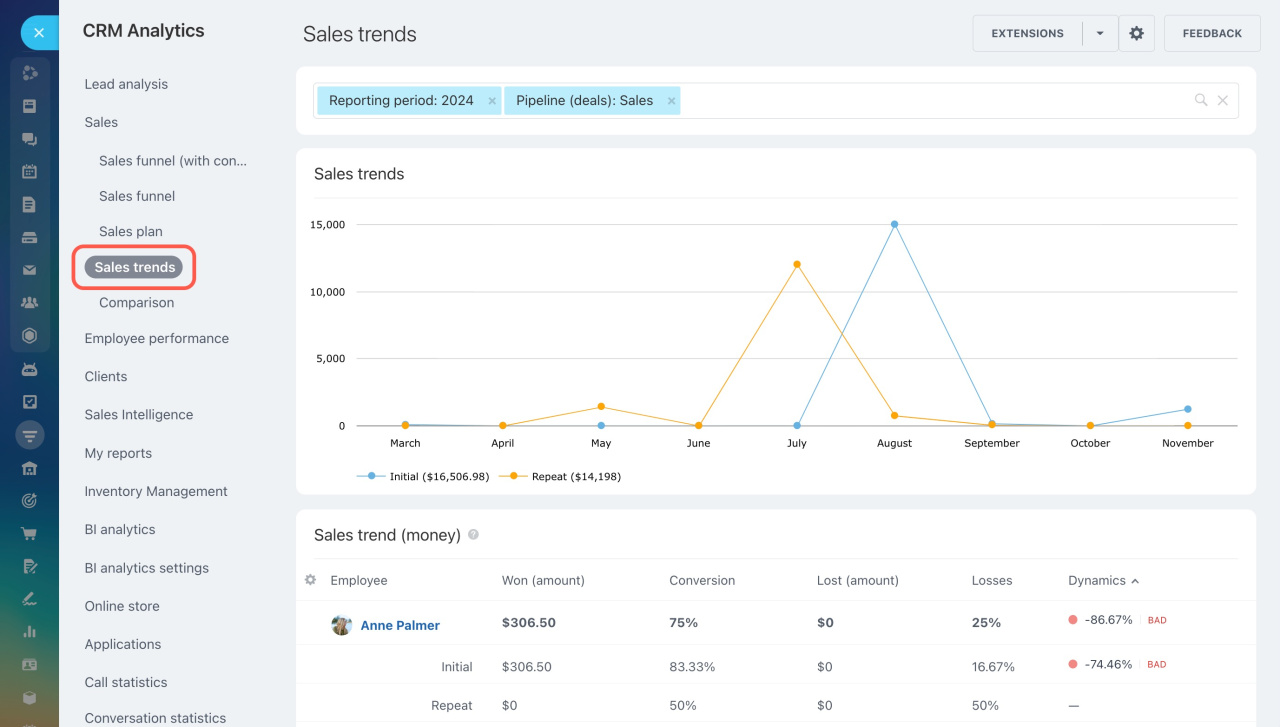
The Sales trends report displays the percentage of deals won or lost during a specific reporting period, and it also tracks changes in sales volume.
Cloud pricing
To access Sales trends:
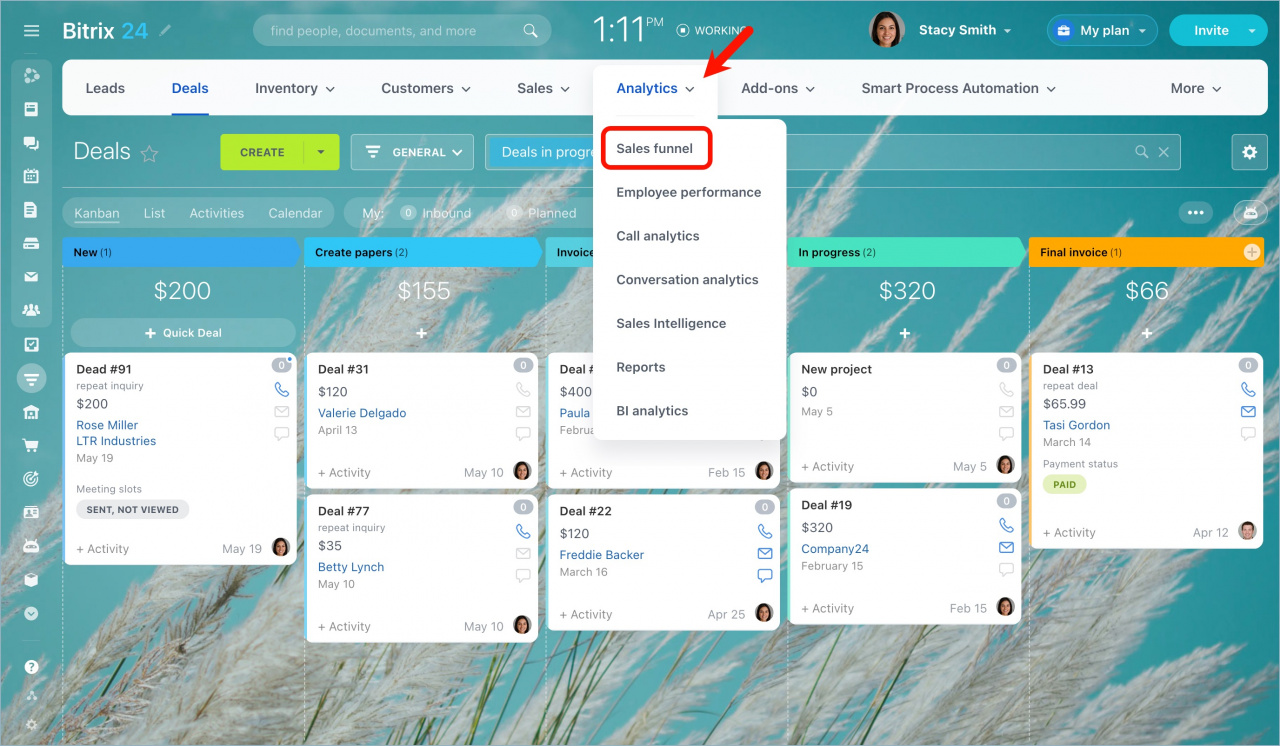
- Go to CRM > Analytics > Sales funnel.
- Select Sales trends on the left.
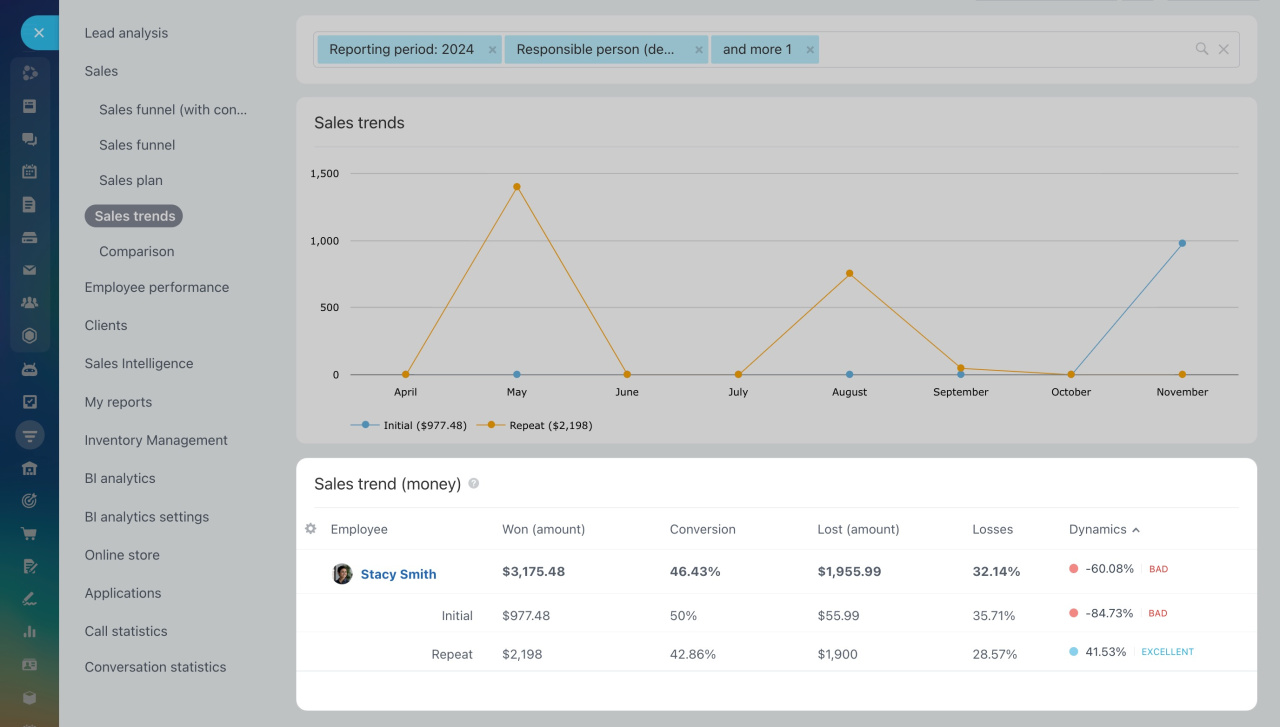
Filter report data by selecting fields and specifying values. To add more fields, click Add field.
For each employee, both initial and repeat deals are counted, and the report includes the following columns:
Won (amount): Shows the amounts of deals won during the reporting period.
Conversion: Displays the percentage of deals won during the reporting period.
Lost (amount): Shows the amounts of deals lost during the reporting period.
Losses: Displays the percentage of deals lost during the reporting period.
Dynamics: Indicates how the amount of won deals has changed compared to the previous period.
Our evaluation of sales dynamics is as follows:
- Bad: dynamics <= 0%
- Average: 0% <= dynamics <= 10%
- Good: 10% <= dynamics <= 30%
- Excellent: dynamics > 30%


