Read FAQ
NEW
Bitrix24 Support
Registration and Authentication
How to start
My Profile
Feed
Chats and Calls
Calendar
Bitrix24.Docs
Bitrix24.Drive
Bitrix24.Mail
Workgroups
Tasks and Projects
CRM
CoPilot - AI in Bitrix24
Contact Center
Sales Center
CRM Analytics (beta)
BI Builder
Sales Intelligence
Inventory Management
Marketing
Sites
Online Store (beta)
CRM + Online Store
CRM Store (beta)
Bitrix24.Sign
Company
Knowledge base (beta)
Automation
Workflows
Telephony
Market
Subscription
Settings
Enterprise
Mobile App
Desktop App
General questions
Bitrix24 On-Premise

Bitrix24Care

Evaluate the REST load in Bitrix24

In brief

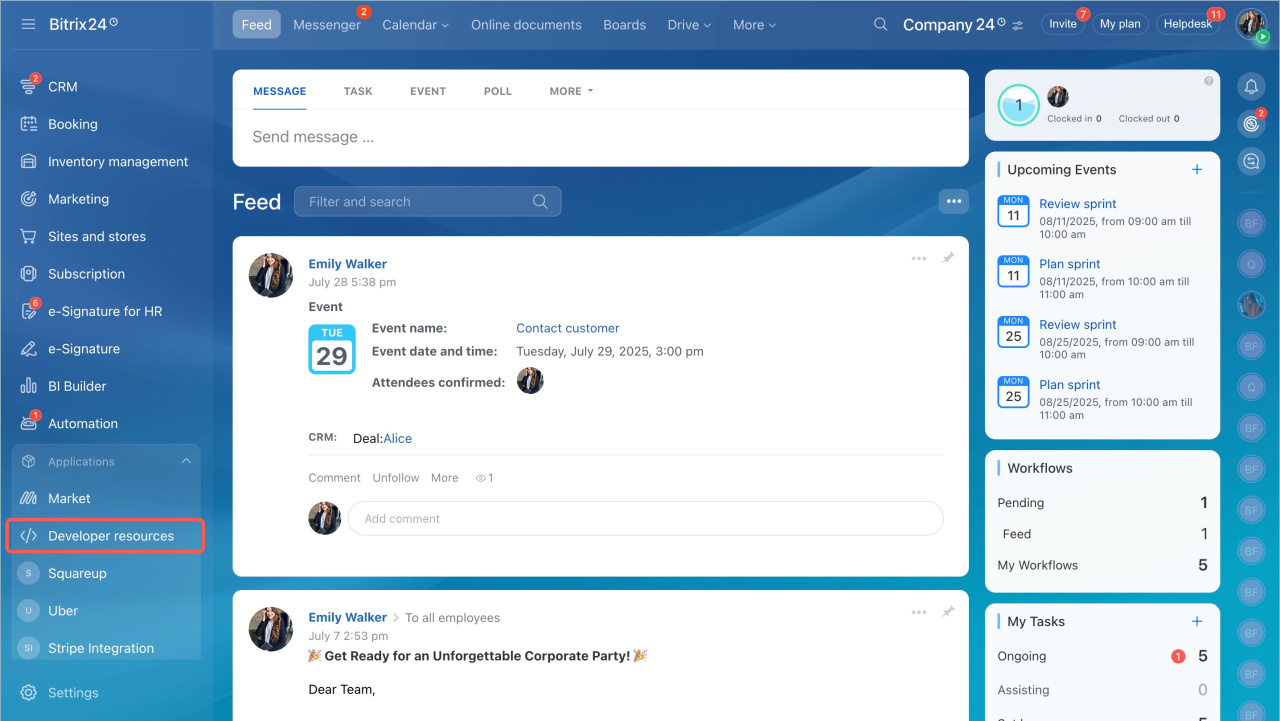
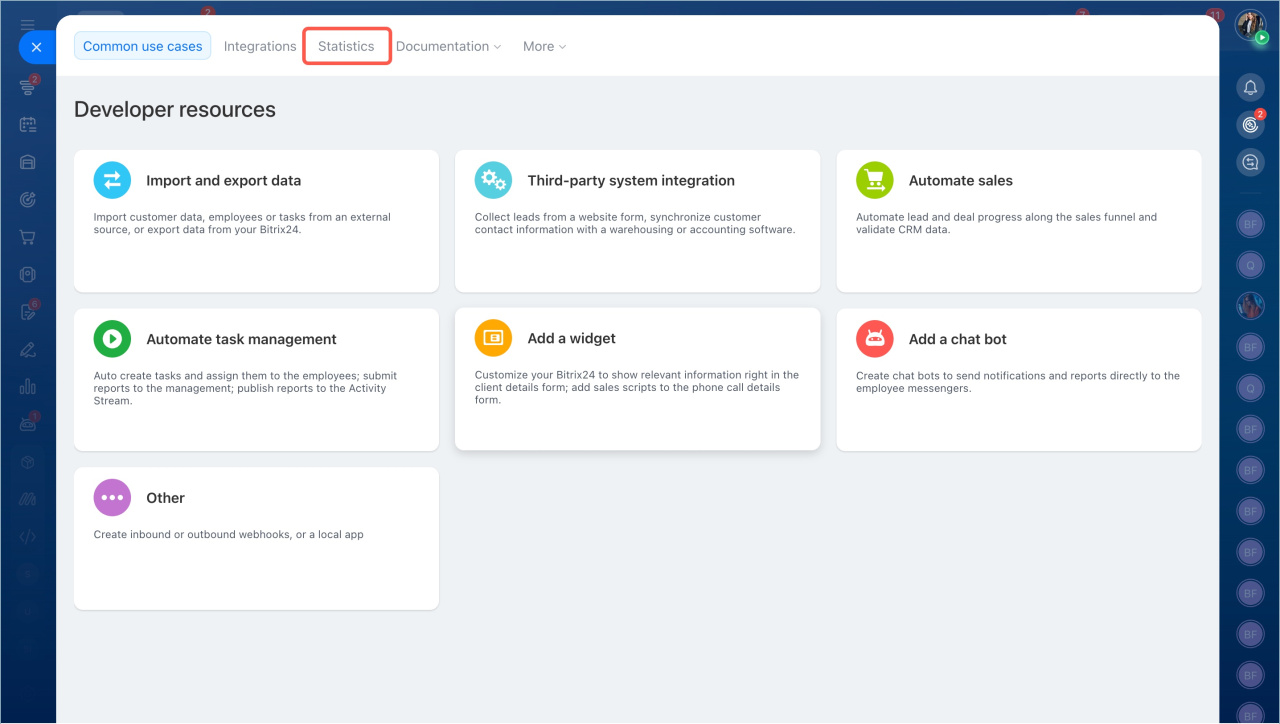
  1. Go to Applications, select Developer resources, and open the Statistics tab.

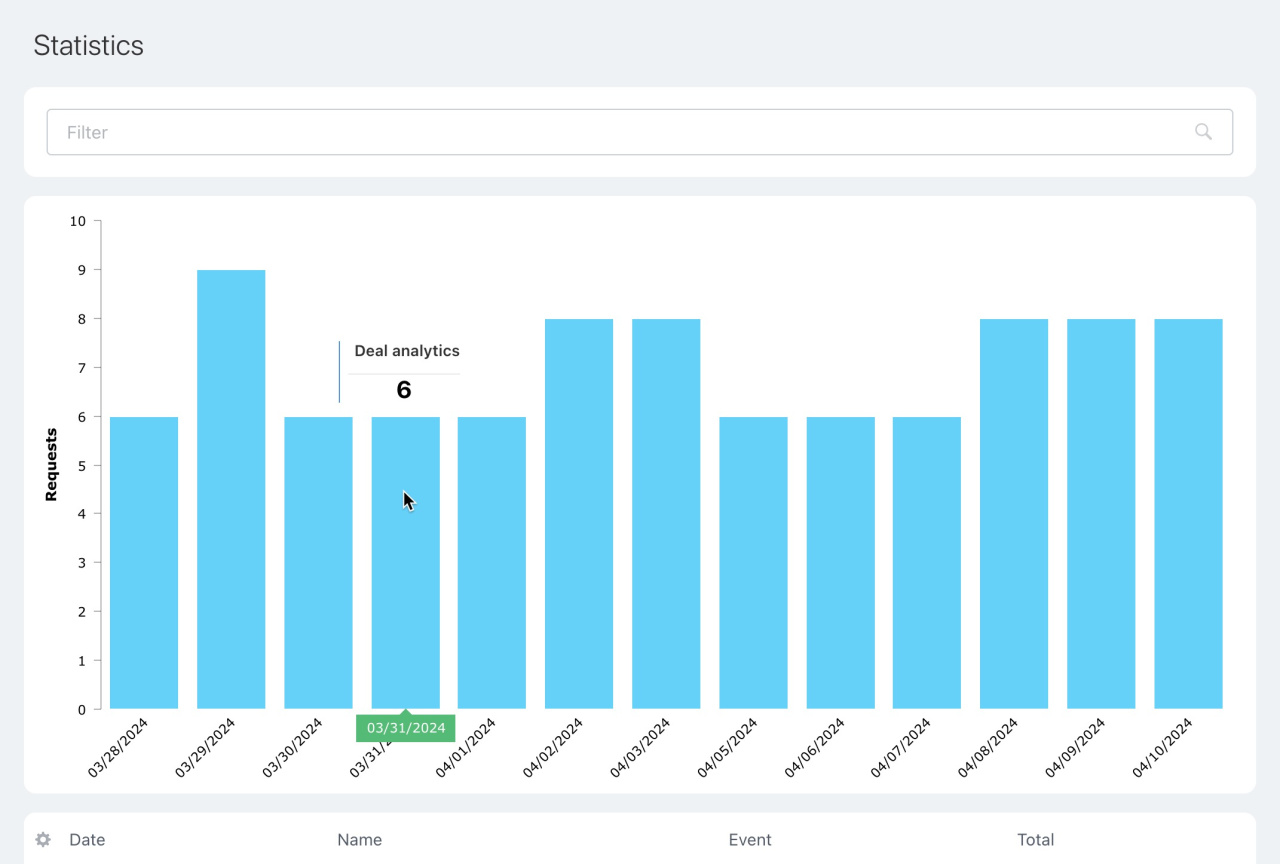
  2. Here, you can view the number of requests for each webhook and application.

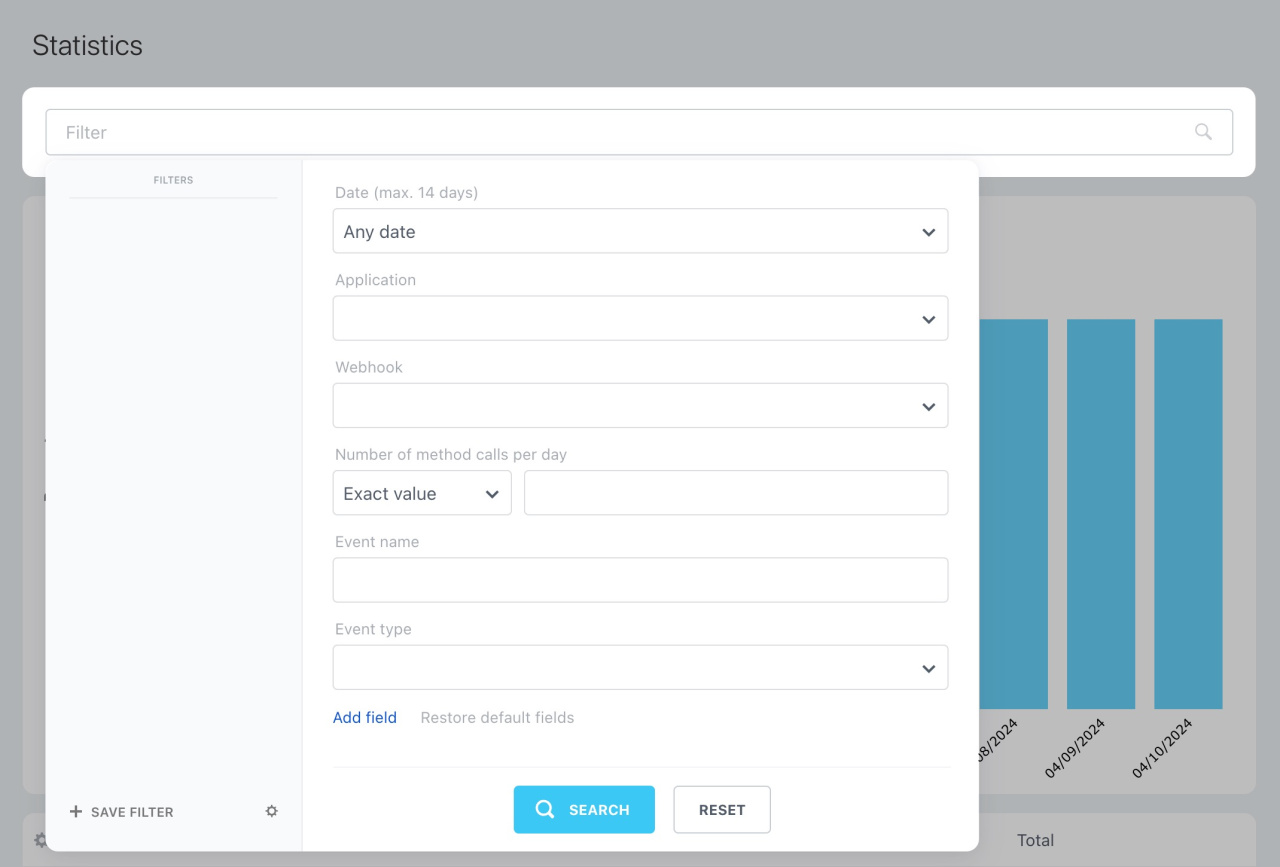
  3. Check the statistics for specific applications and dates using the filter.

Only administrators can access the REST load statistics section.

In detail

The number of REST requests can impact how fast your Bitrix24 works. Too many requests might slow it down.

Go to Applications, select Developer resources, and open the Statistics tab.

By default, the chart shows load statistics for the last 14 days. Hover the cursor over a chart column to see the app name and the number of requests it has sent.
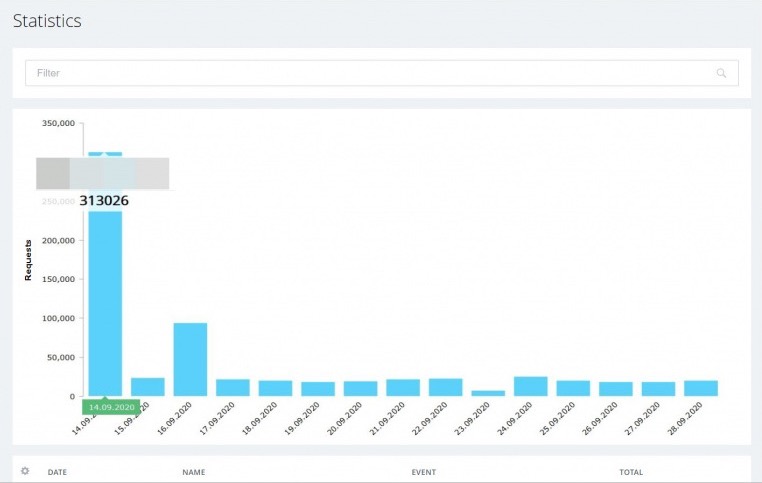
Correct The statistics display this way when the application is functioning correctly.
High load In the screenshot above, you can see an app that is causing the high load. It might be malfunctioning or need optimization.

Use the Filter field to sort statistics by the following parameters:

  • Application
  • REST method or event
  • Webhook
  • Date
The maximum period for viewing statistics is 14 days.

Was this information helpful?
Integration specialist assistance
That's not what I'm looking for
Complicated and incomprehensible text
The information is outdated
It's too short. I need more information
I don't like the way this tool works
Go to Bitrix24
Don't have an account? Create for free