Bitrix24 has a
new interface. The images in the articles might differ from the current account design. We will update them soon.
BI Builder is a tool where you can view and create analytical dashboards based on your business data. There are three ways to start using it.
Use built-in dashboards
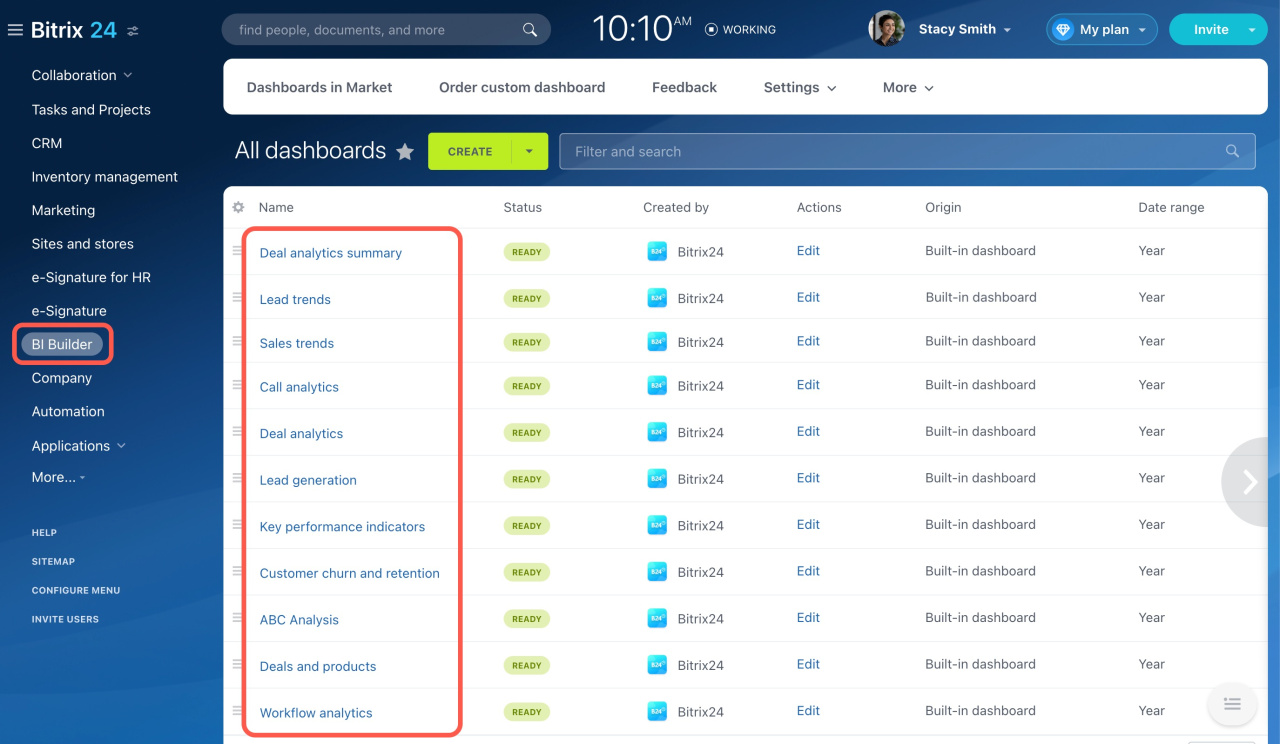
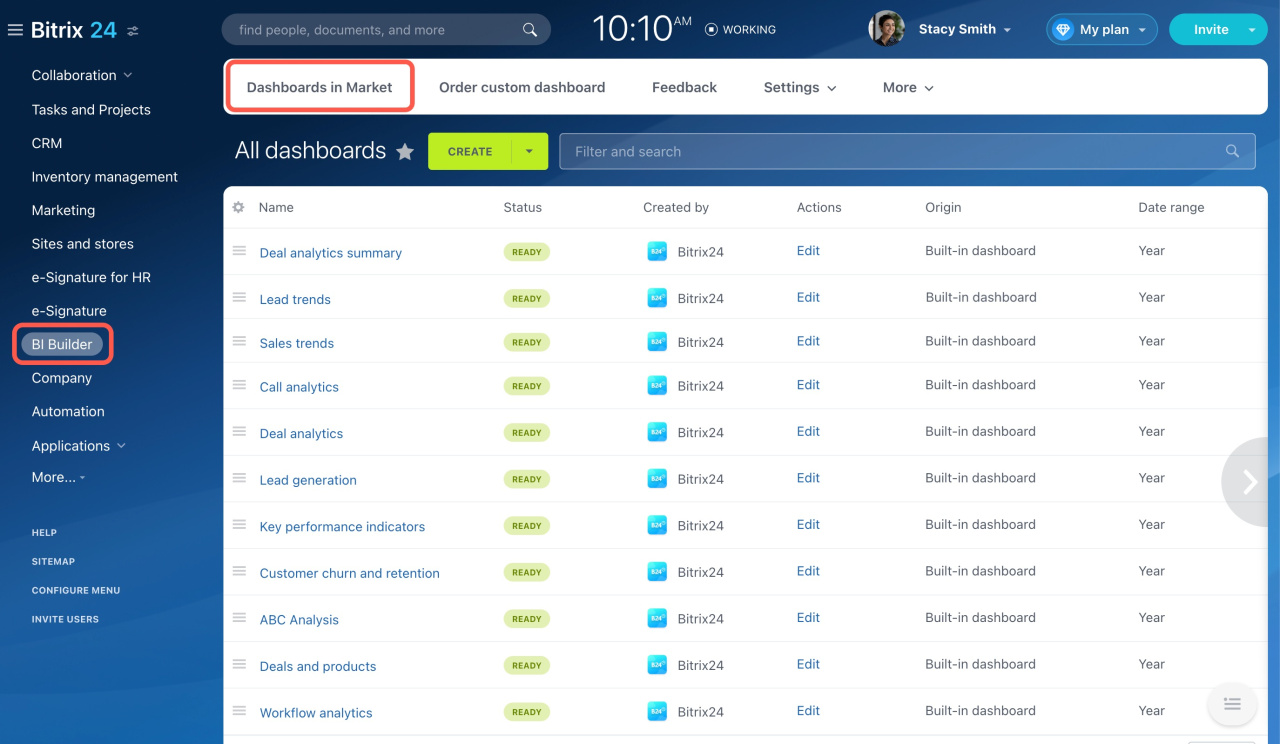
Go to the BI Builder section and select a dashboard from the list. The data will be loaded automatically from your account to complete the dashboard.
Bitrix24 provides 11 standard dashboards.
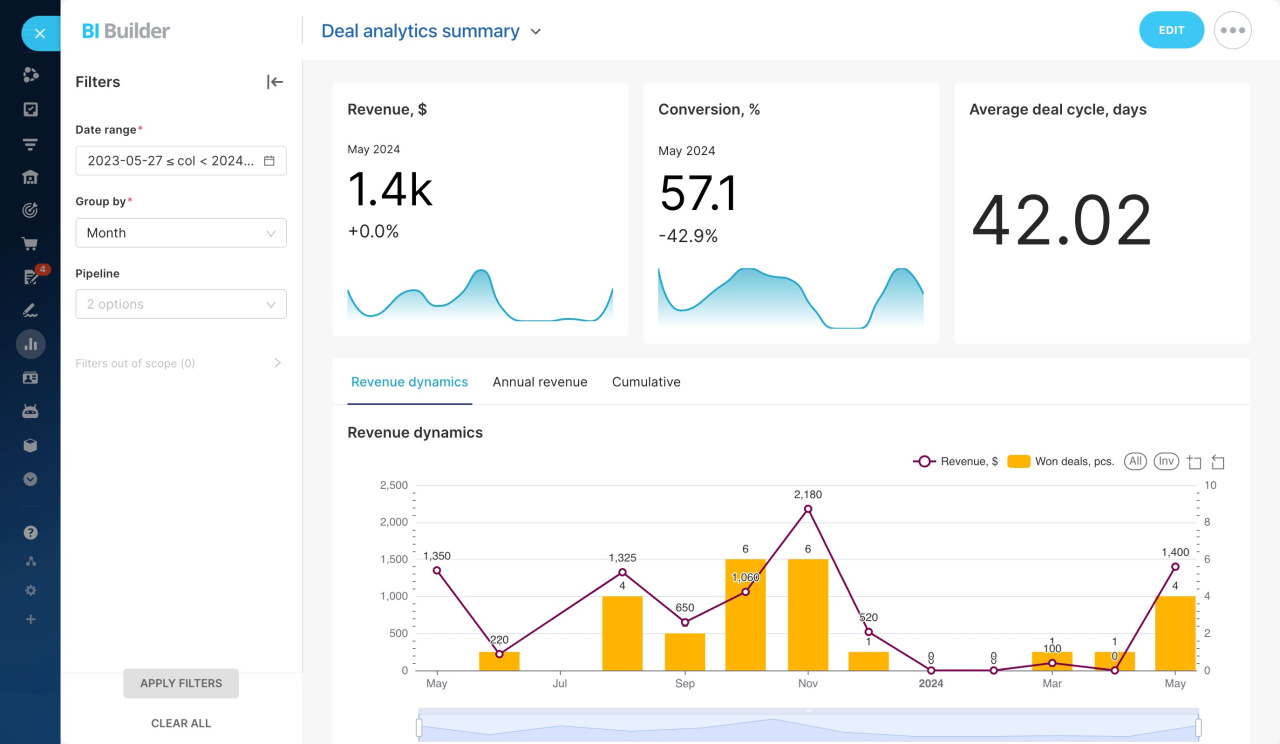
Deal analytics summary
The dashboard displays your company's total sales. It includes the number of deals, their status, monthly revenues, and source effectiveness. You can see your best customer sources and times of high or low activity. Use this information to improve your sales planning and strategy.
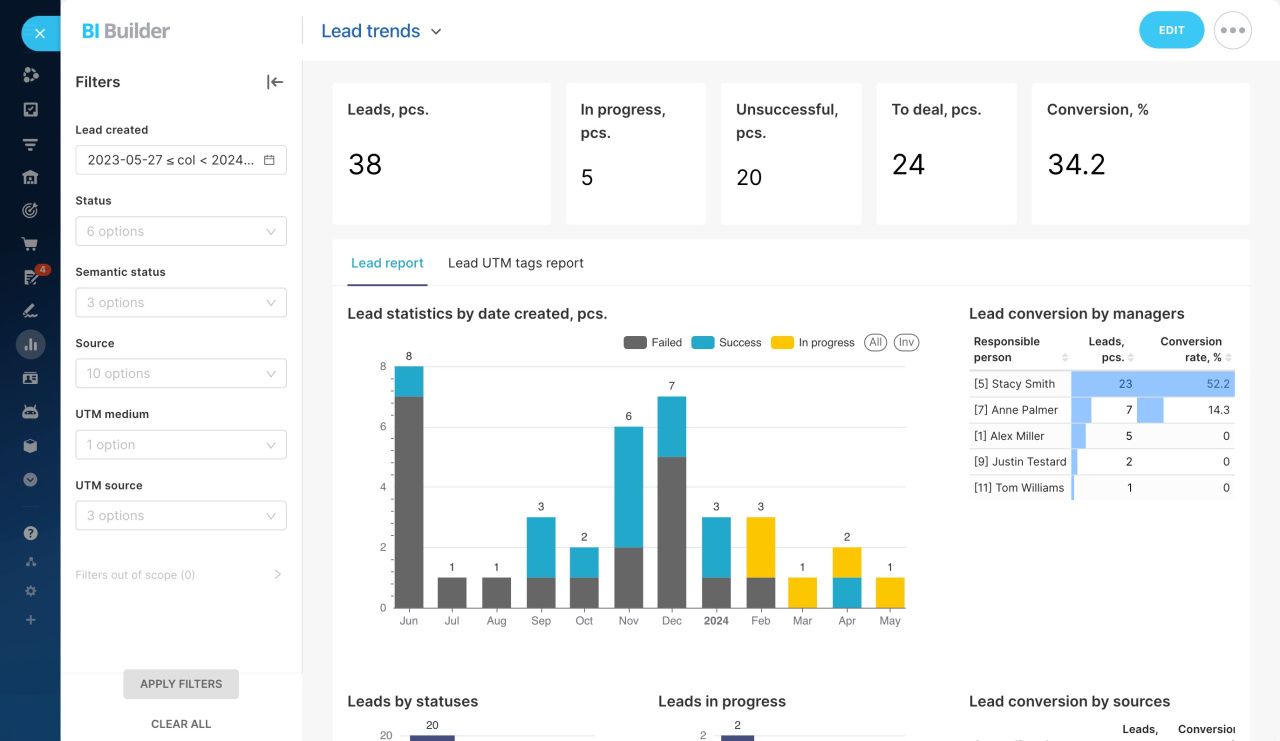
Lead trends
The dashboard explains how your company gets leads and converts them into deals. It helps you understand the best ways to attract new customers and increase sales.
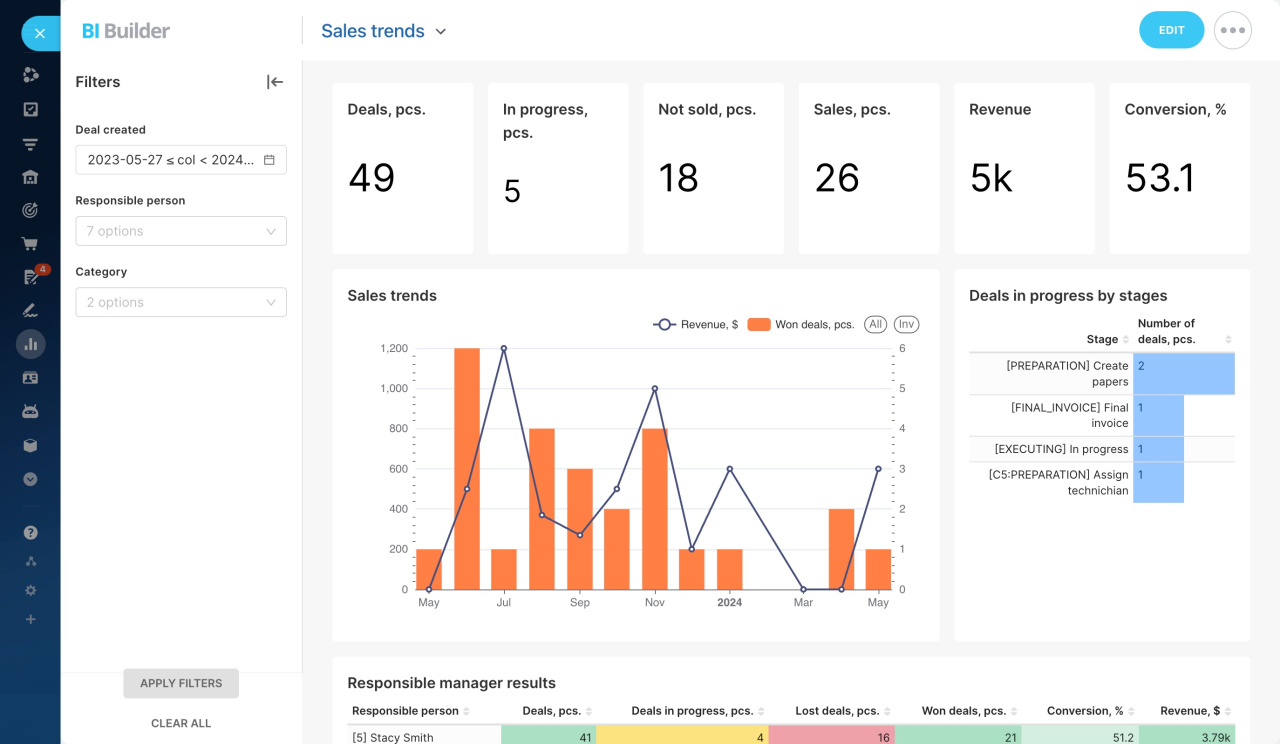
Sales trends
The dashboard sets out the overall sales performance of your business. It displays total revenue and deal success. Use this data to find the most profitable months, understand how sales progress through stages, and see each employee's contribution.
Call analytics
The dashboard shows how calls relate to sales. It helps you see how calls contribute to sales, identify the best days to talk to customers, and find out the average number of calls needed to close a deal.
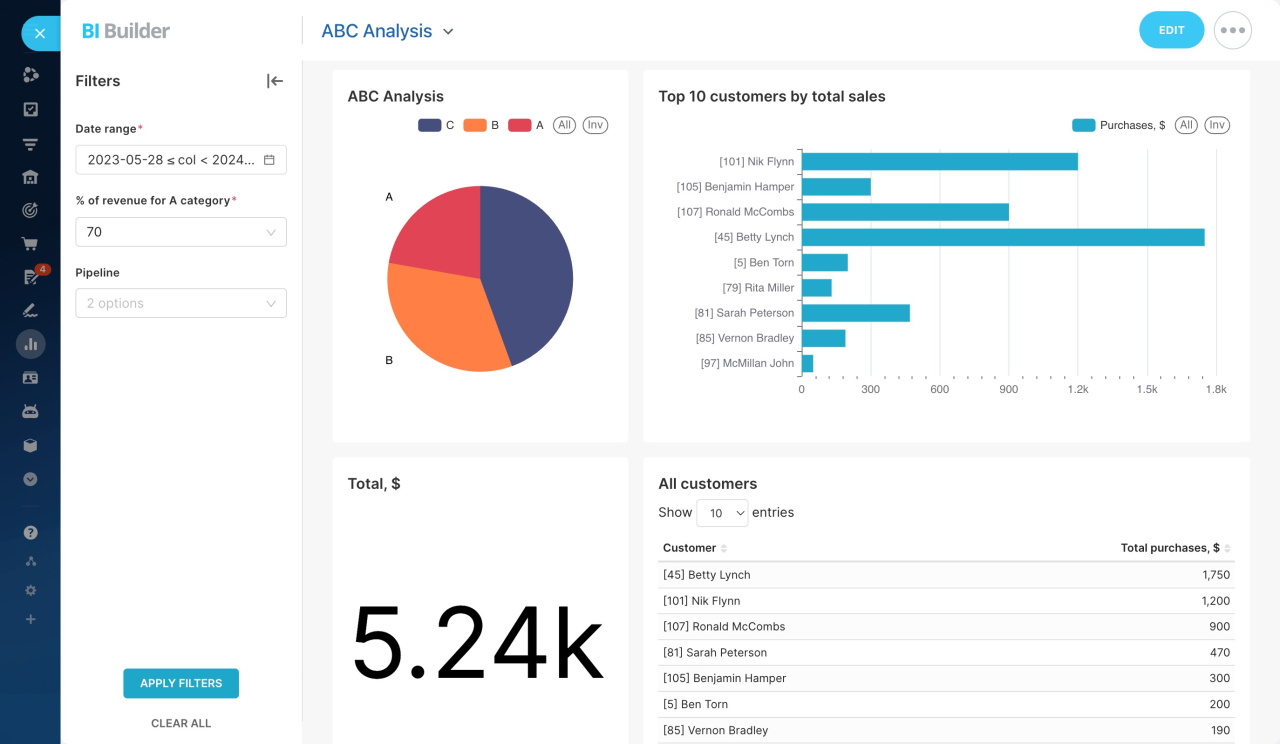
ABC Analysis
The dashboard helps you understand your company's revenue and decide which customers need more focus. It divides clients into three categories: A, B, and C. Each category contributes differently to total revenue. Category A clients bring in 80% of the profits, Category B brings 15%, and Category C brings the remaining 5%.
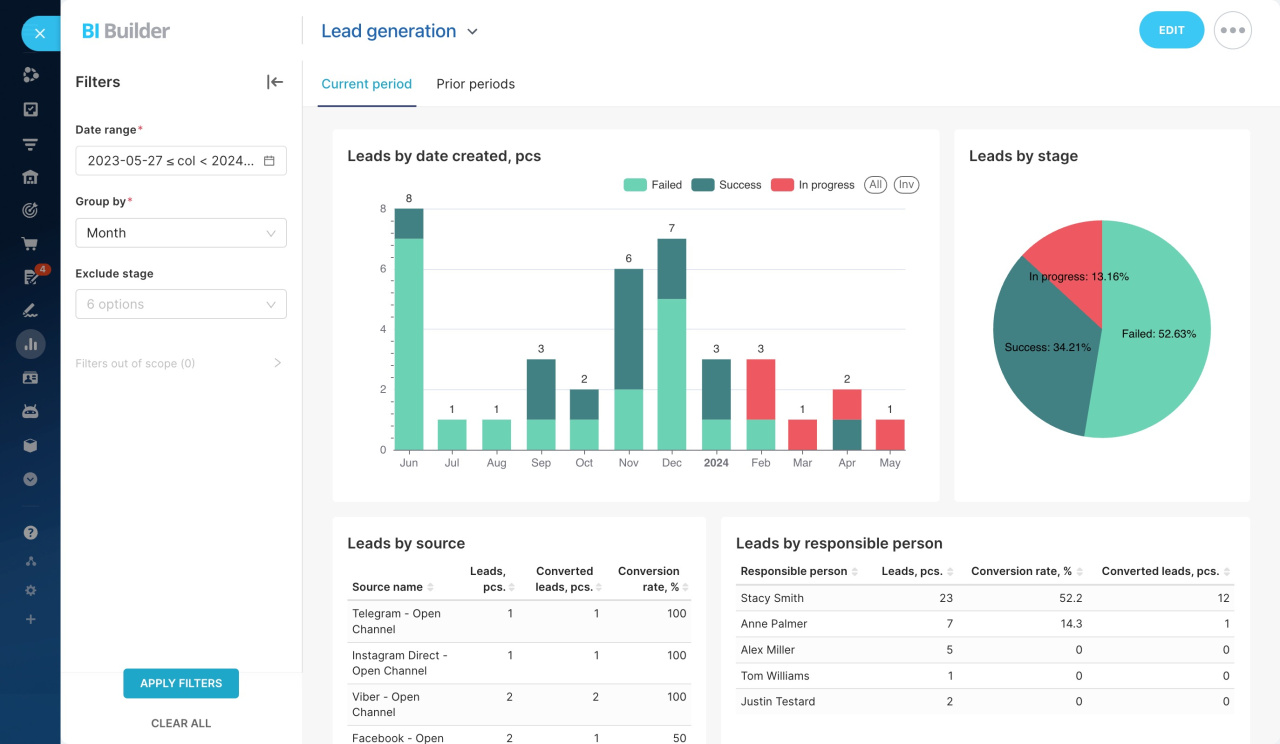
Lead generation
The dashboard helps you see how the company attracts potential customers and how effective the methods are. It shows data on lead trends, their sources, and conversions by channels and campaigns.
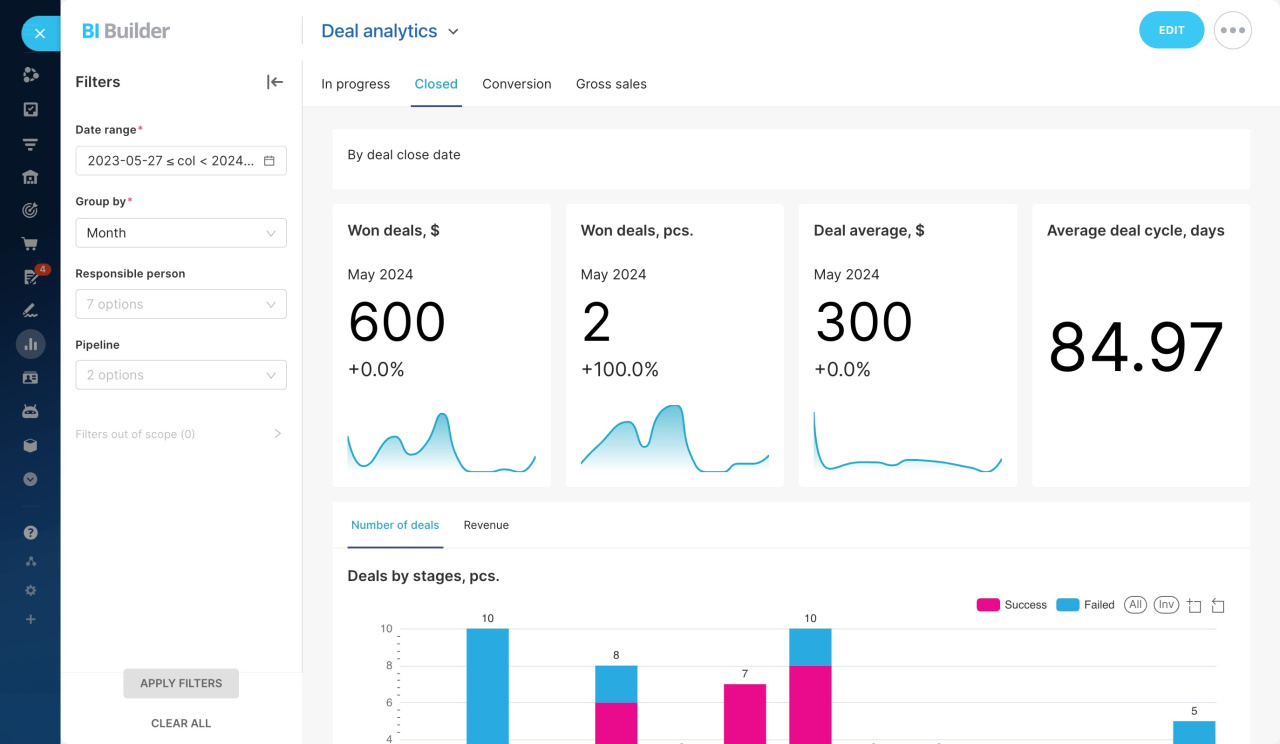
Deal analytics
The dashboard shows the number and status of deals, helping you spot trends and changes in sales. It also provides indicators of how quickly and well deals are closed, allowing you to assess employee performance.
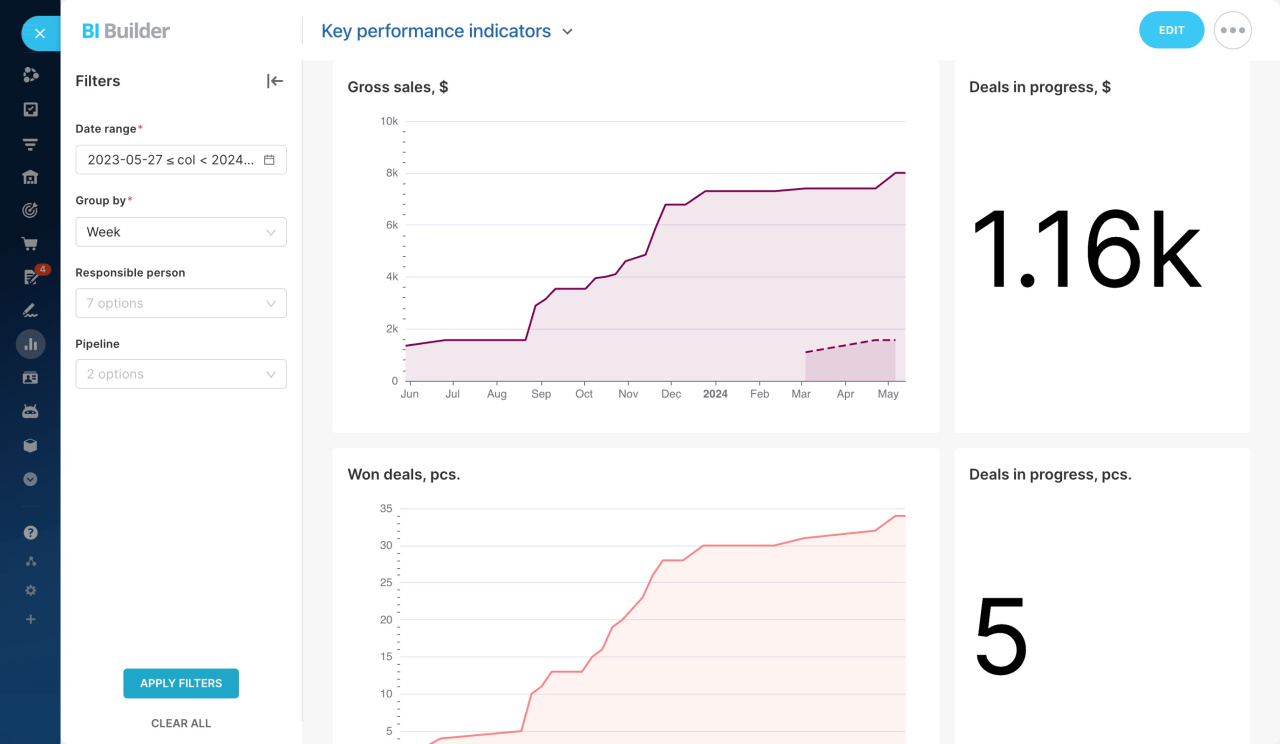
Key performance indicators
The dashboard reflects revenue trends and helps you evaluate the company's performance. It provides data on the number of deals and their closing times, helping you identify weaknesses in the sales process.
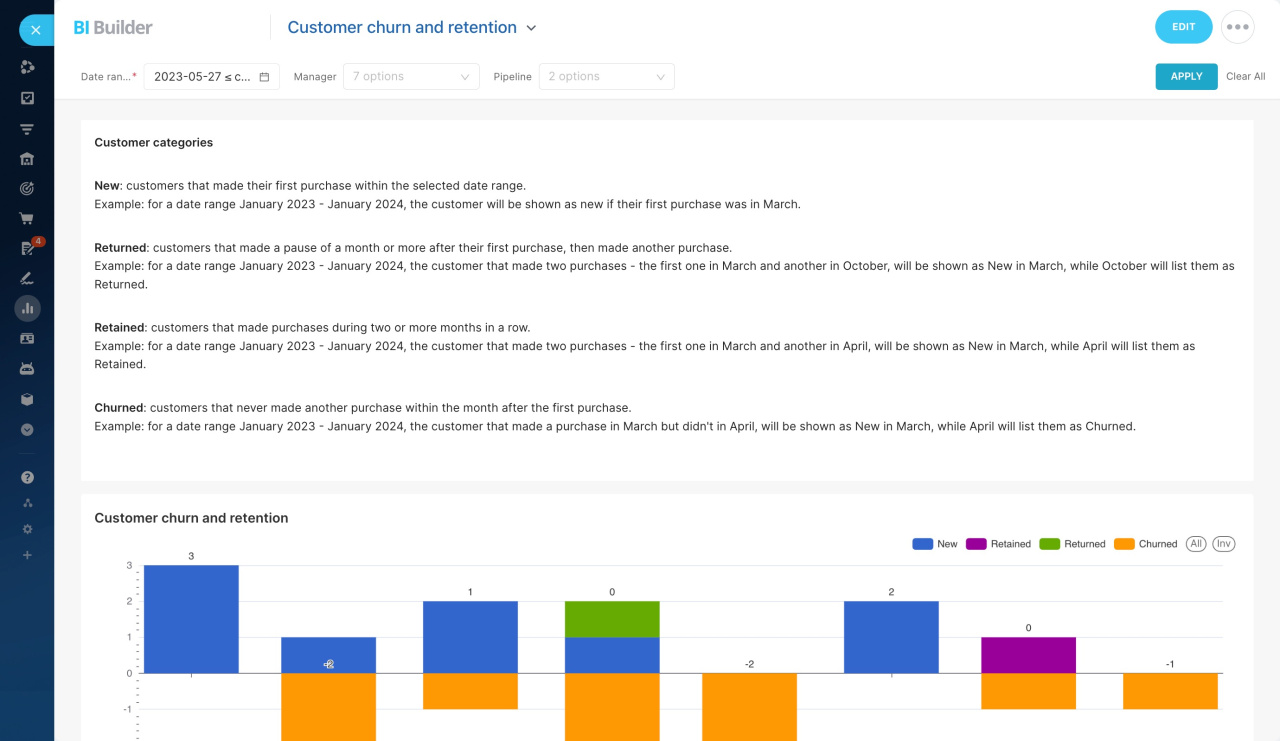
Customer churn and retention
The dashboard helps you understand customer retention and churn. It shows data over different periods by customer categories: new, retained, returned, and churned.
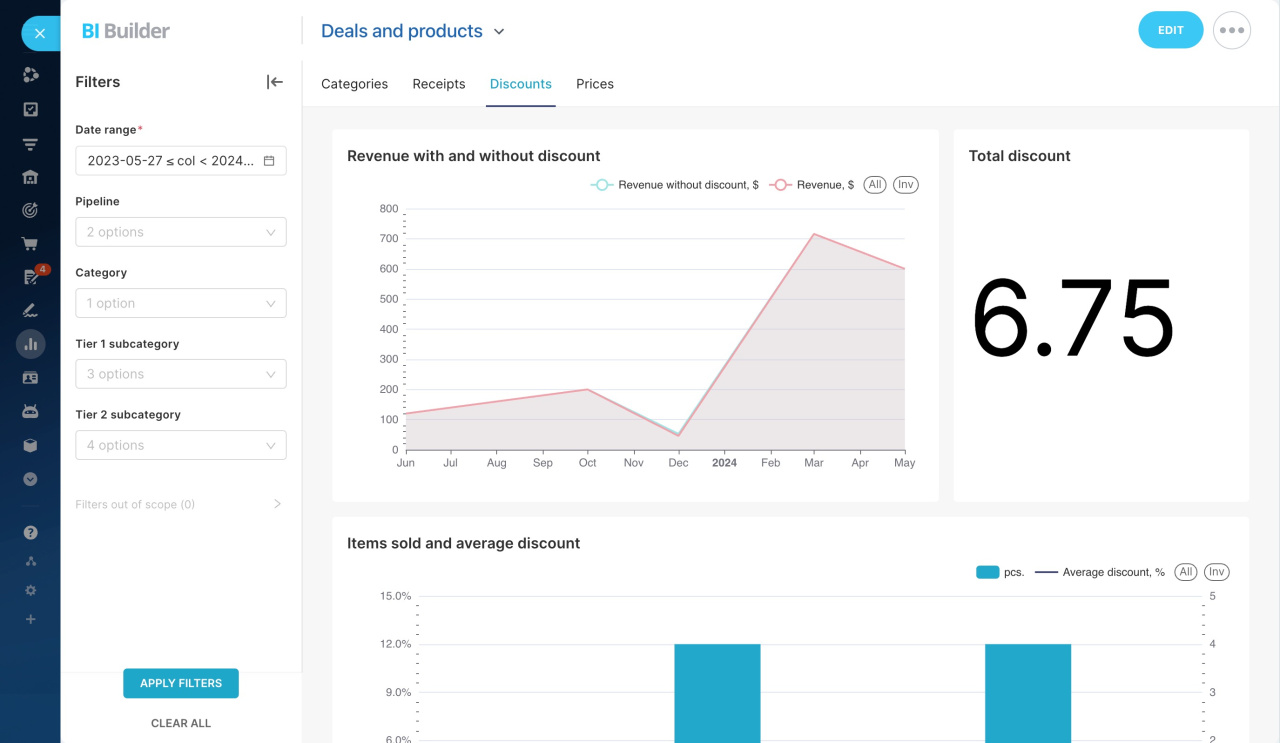
Deals and products
The dashboard shows sales volume by product category and revenue trends. It includes revenue with discounts, so you can evaluate pricing effectiveness and the impact of promotions on sales.
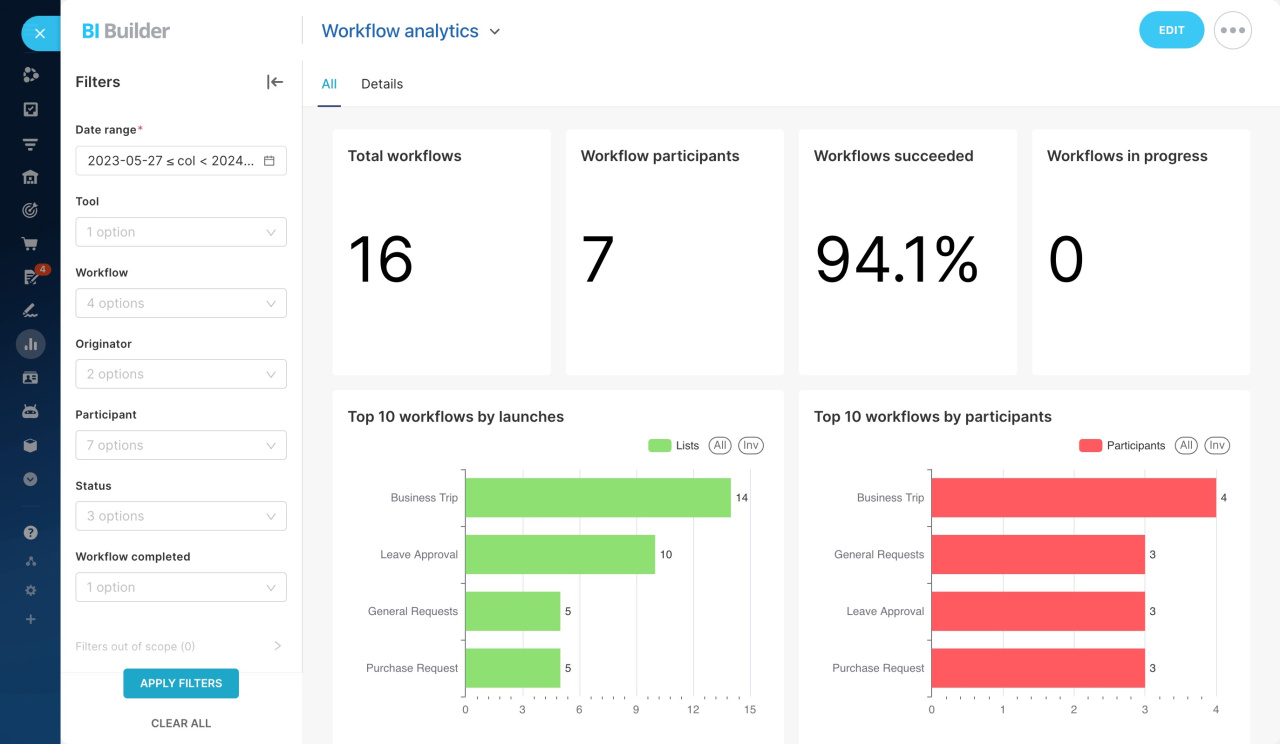
Workflow analytics
The dashboard shows the number of workflows started and completed, the number of employees involved, and the time taken to finish. This data helps you evaluate process effectiveness and identify any issues in the approval chain.
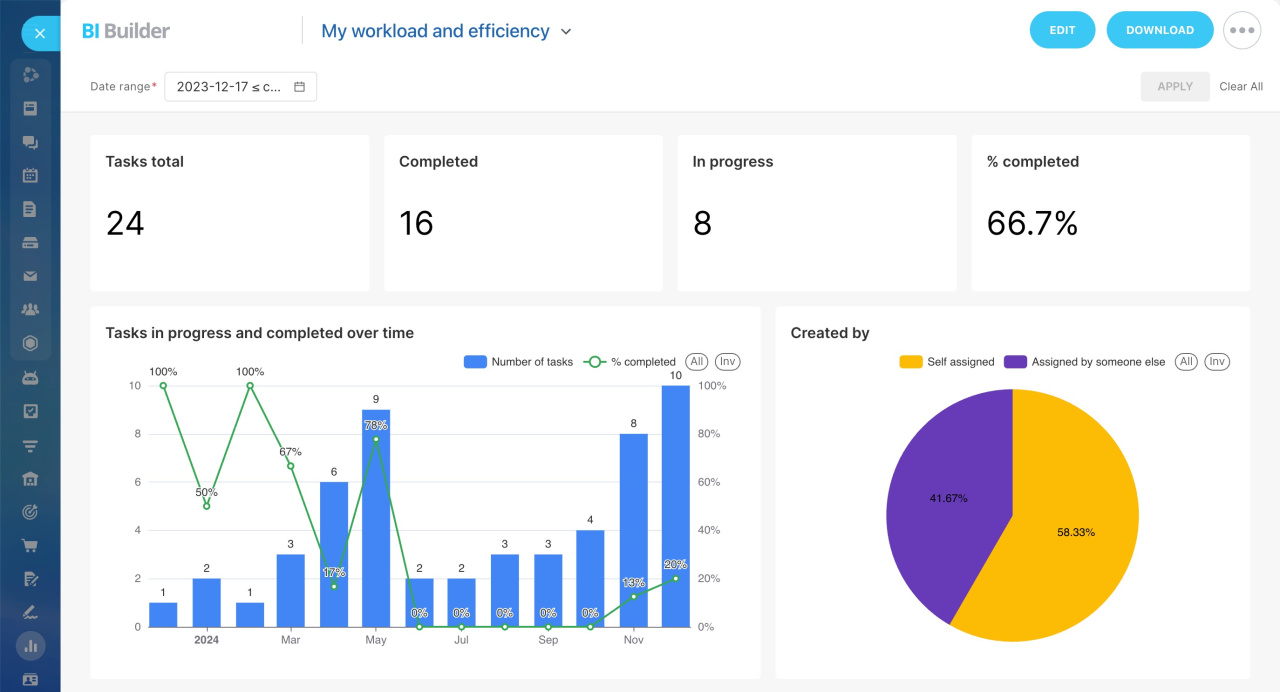
My workload and efficiency
The dashboard shows total tasks, their status, and trends in creation and completion. It helps you see which tasks are in progress, who created them, and what needs your attention.
Workload and efficiency
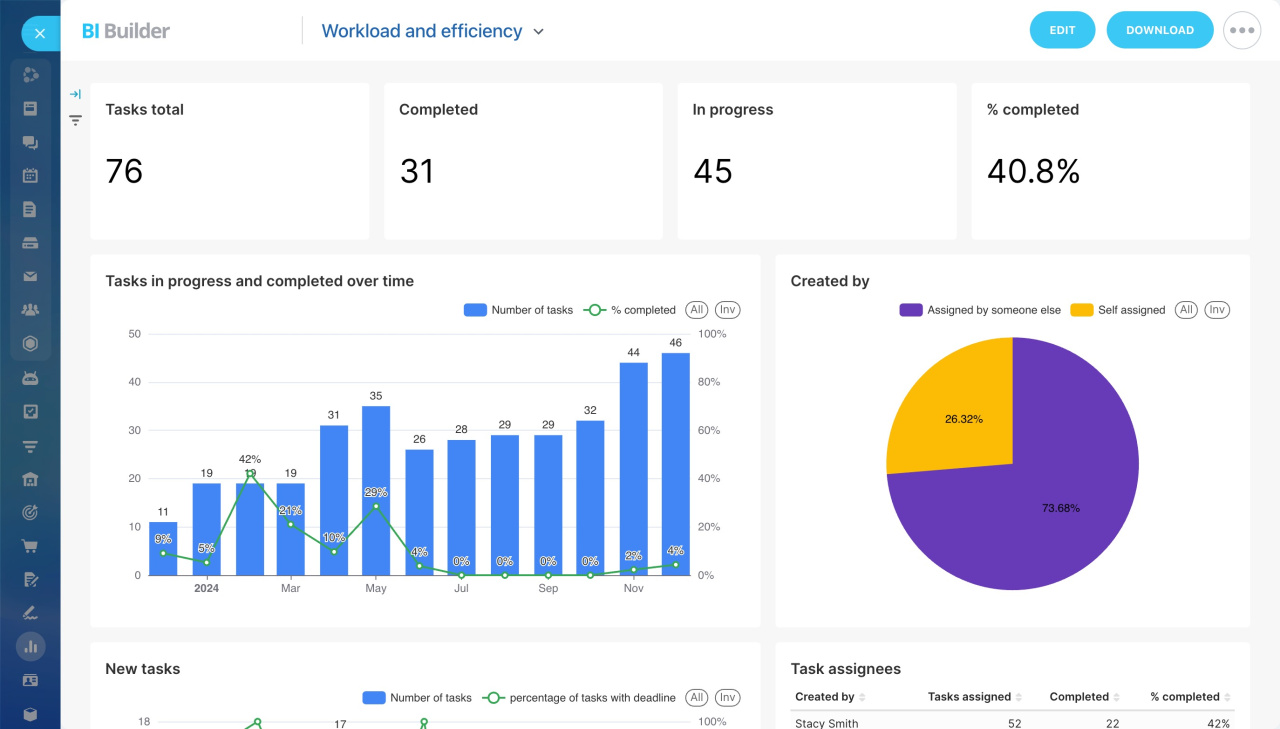
The dashboard helps you assess workload of employees and departments. Check how many tasks are in progress, their status, completion rate, and average execution time. You can see which departments need to reallocate tasks or change workflows.
My performance
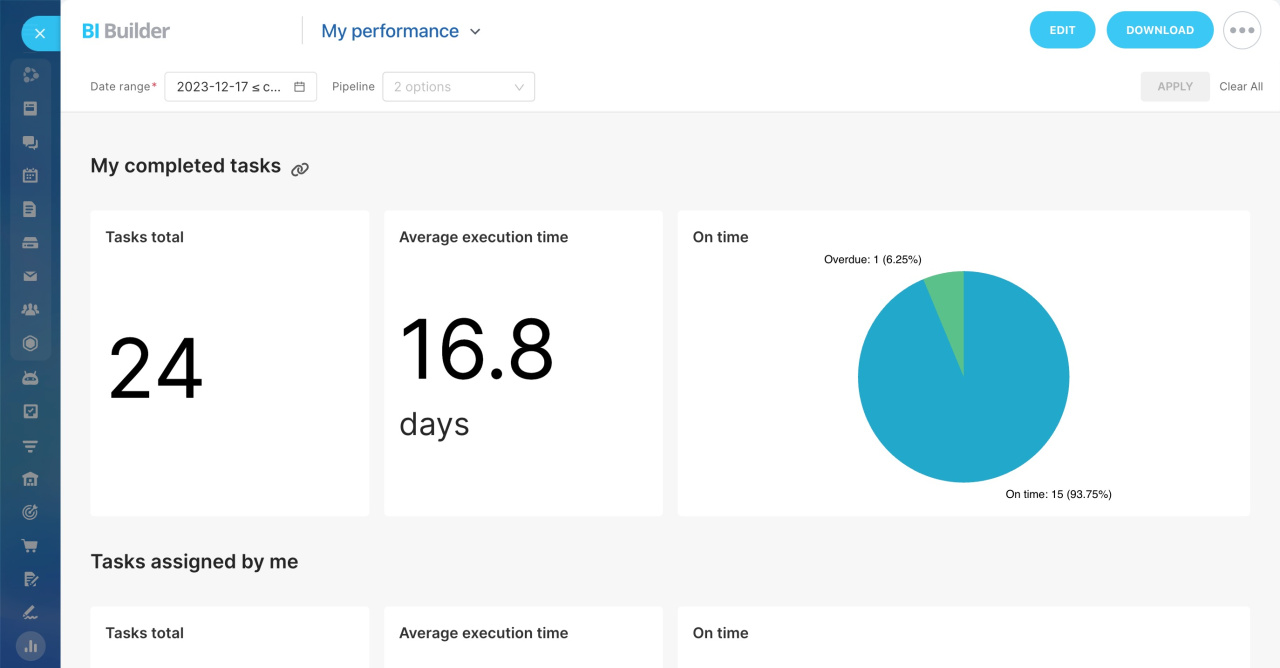
The dashboard helps you see your workload and efficiency. Check how many tasks, workflows, and deals you've completed, their average completion time and on-time completion rate. If tasks take longer than expected, try re-prioritizing or adjusting the workload.
Tasks: completion time
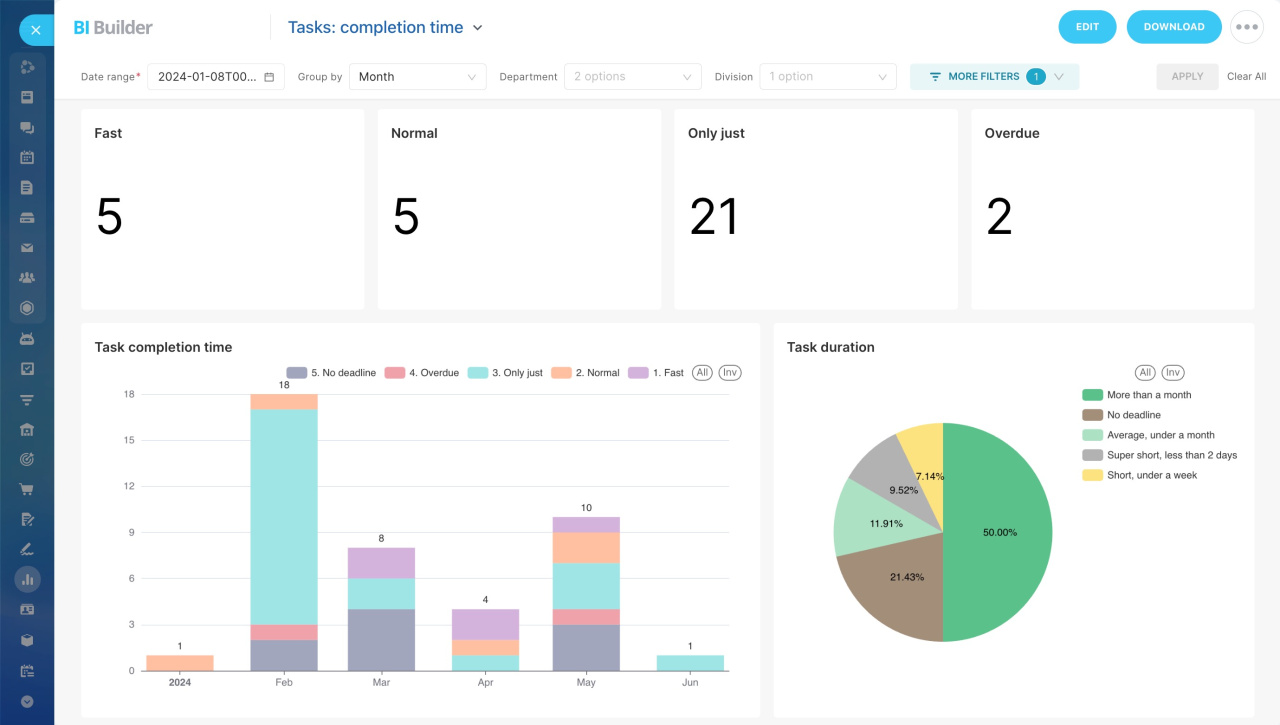
The dashboard helps you see how quickly tasks are completed and how many are on time. It shows statistics on completed tasks, including those done quickly, just in time, and overdue. You can assess and adjust the workload to reduce overdue tasks if needed.
SPA Summary
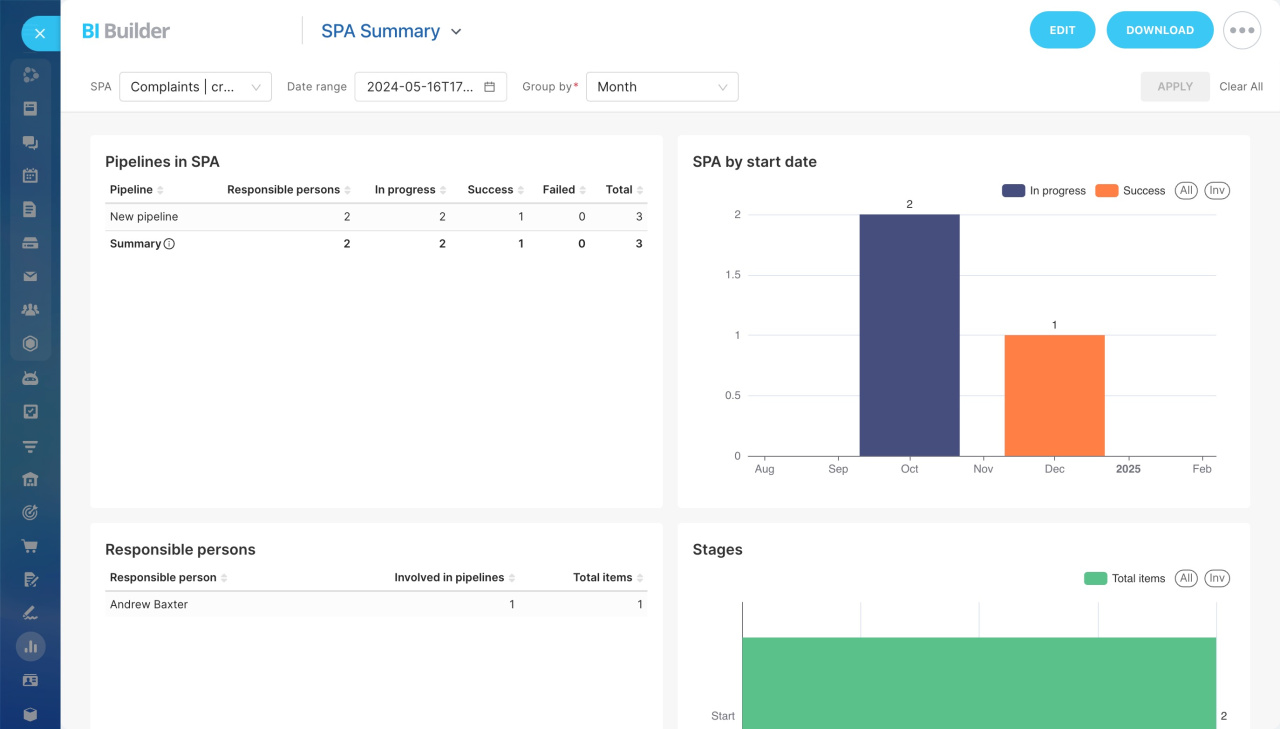
The dashboard helps you analyze SPA work in the company. It shows SPA pipelines, how many items are at each stage, conversion rates, and average completion time. For example, payment requests might be completed quickly, while document approval takes longer. This information helps you reallocate resources and improve control at important stages.
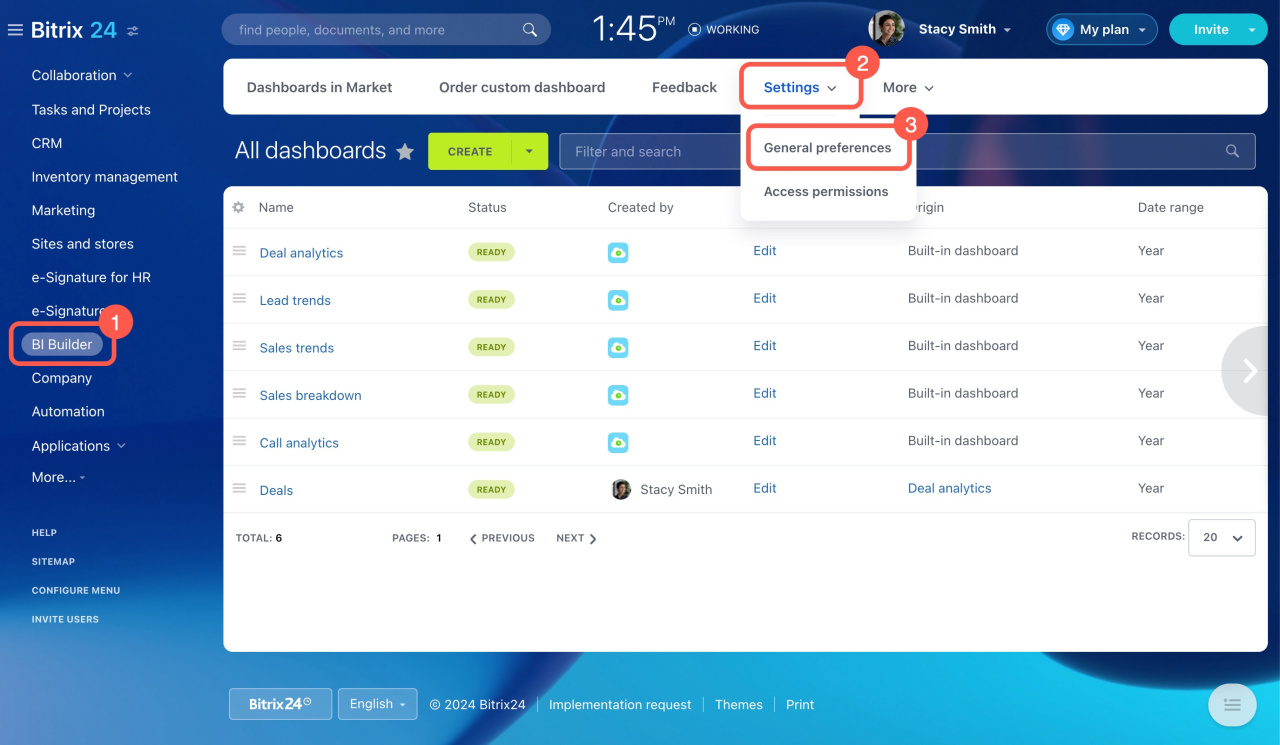
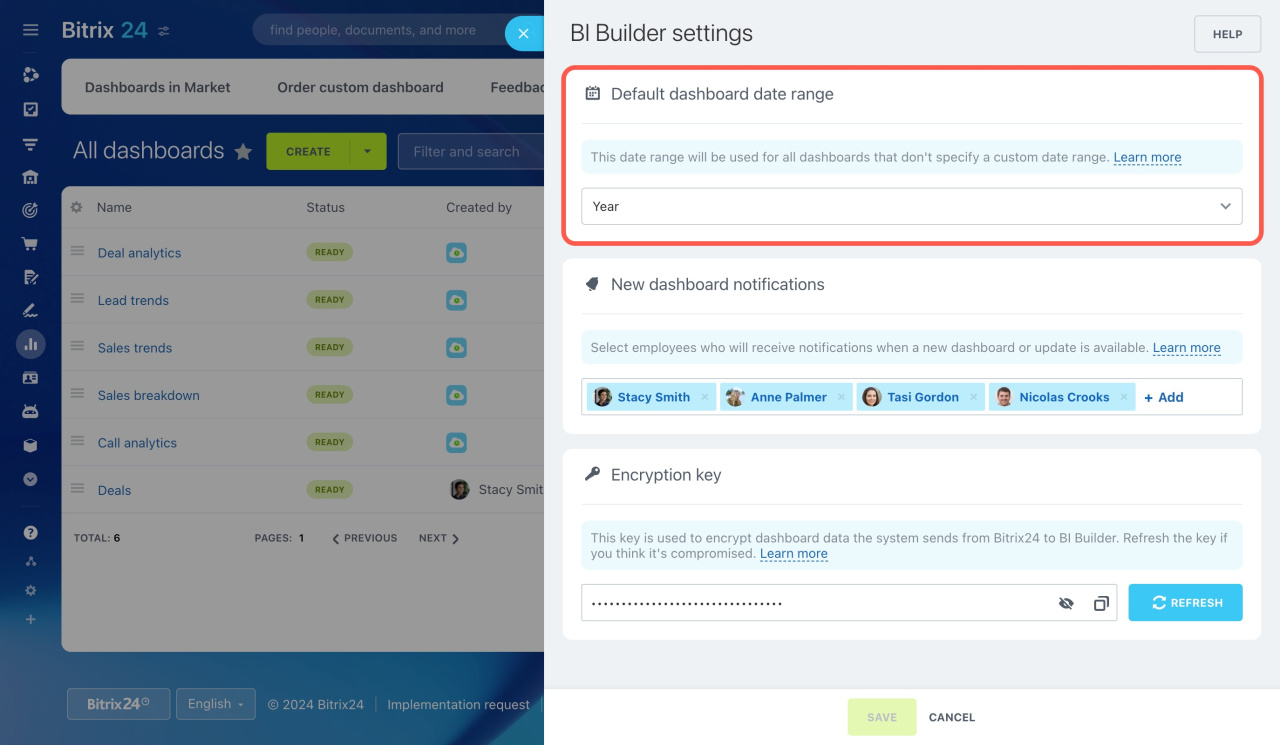
To set the same date range for all dashboards, go to BI Builder > Settings > General preferences, then select the desired date range.
Install dashboards from Market or order custom ones
In addition to the built-in dashboards, you can explore solutions in our Market. Developers offer dashboards for various tasks and business areas. These dashboards come with charts and pre-configured filters, so you won't need to do any extra setup.
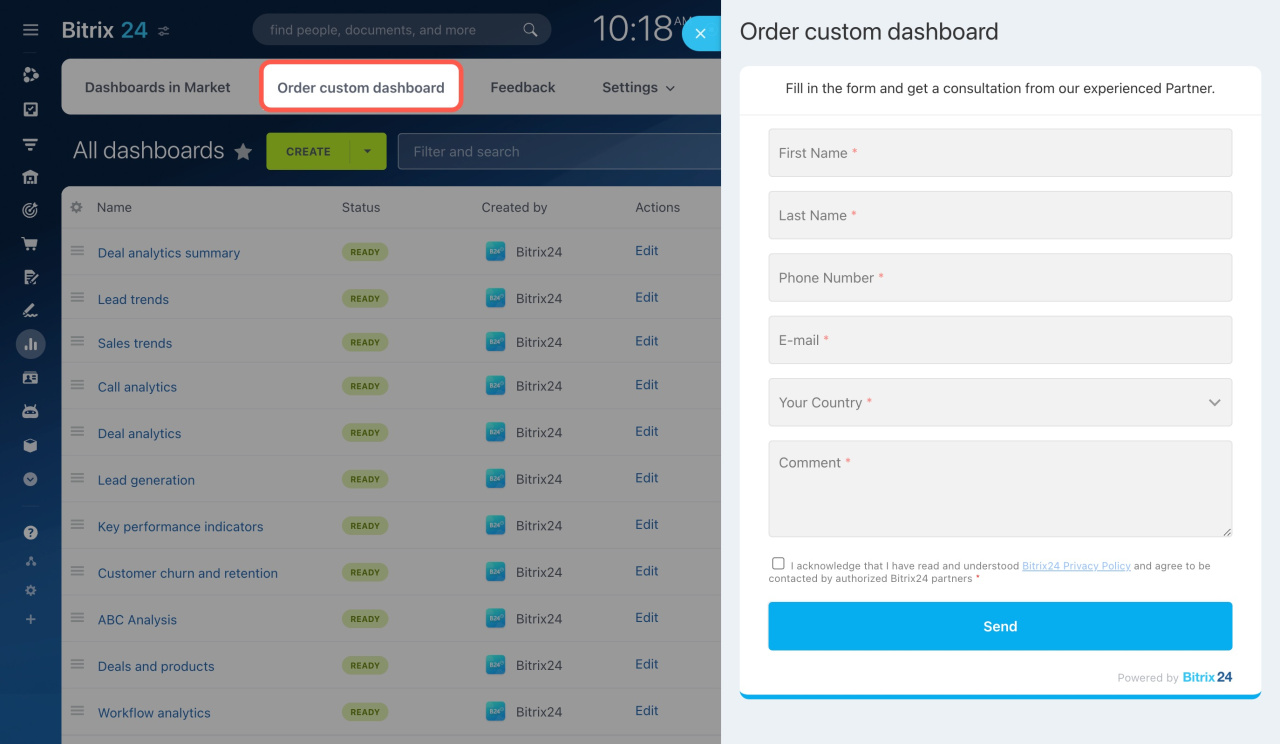
If you have not found the dashboard you need, order a custom one from our partners via a special form.
Create dashboards or edit built-in ones
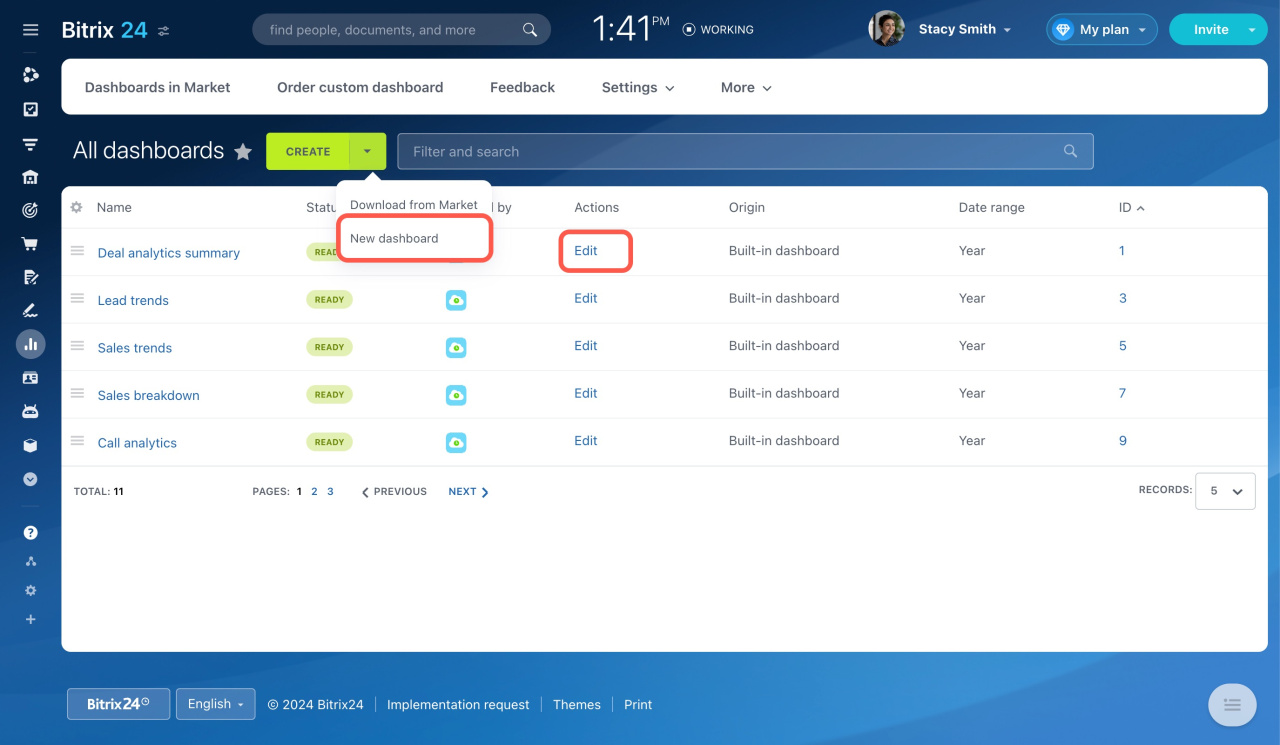
Navigate to BI Builder to view all the dashboards, edit them, or add new ones.
Create dashboards in BI Builder
Edit dashboards in BI Builder
In brief
-
Use built-in dashboards to define and analyze your business indicators.
-
Look for more dashboard templates in the Market, or order a custom one from Bitrix24 partners.
-
Edit or create dashboards according to your needs in BI Builder.

