BI Builder is a tool that allows you to generate analytical reports based on your account data. This article guides you on how to create a dashboard and visualize your data.
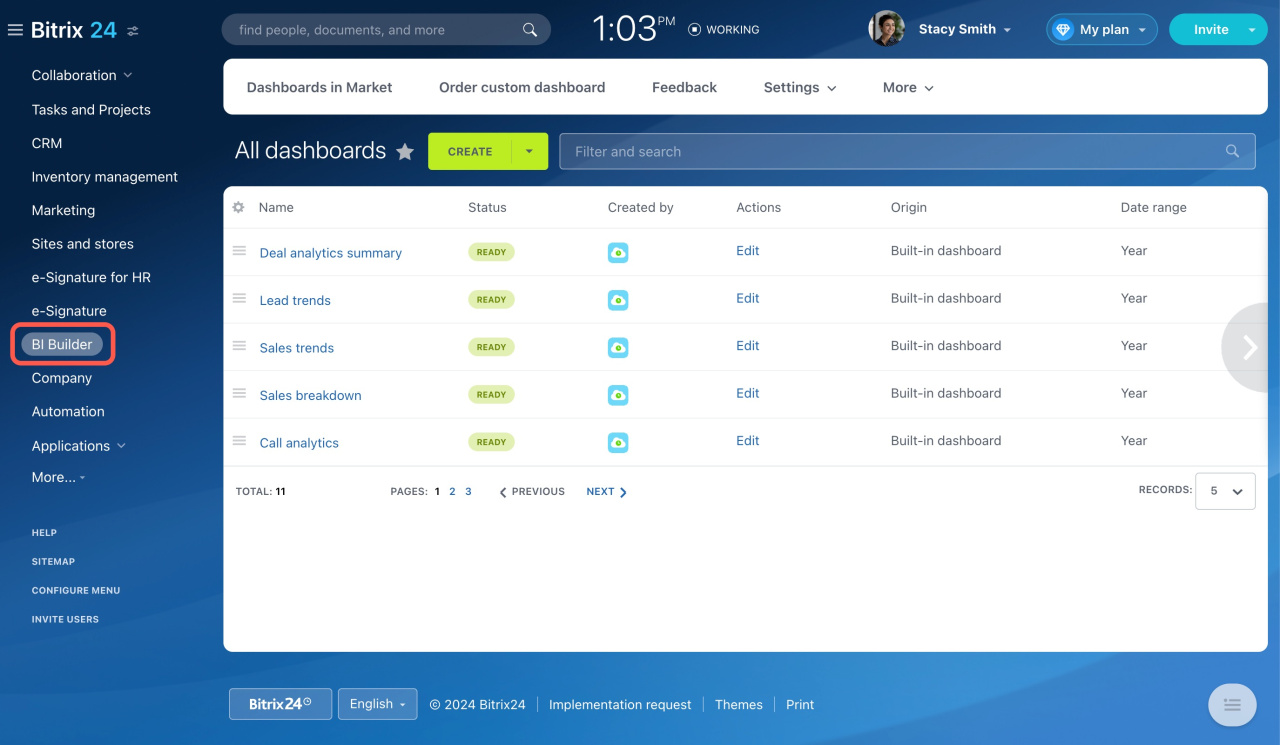
Go to the BI Builder section. On this page, you will see a list of all dashboards.
There are two ways to create a report:
-
Edit a built-in dashboard
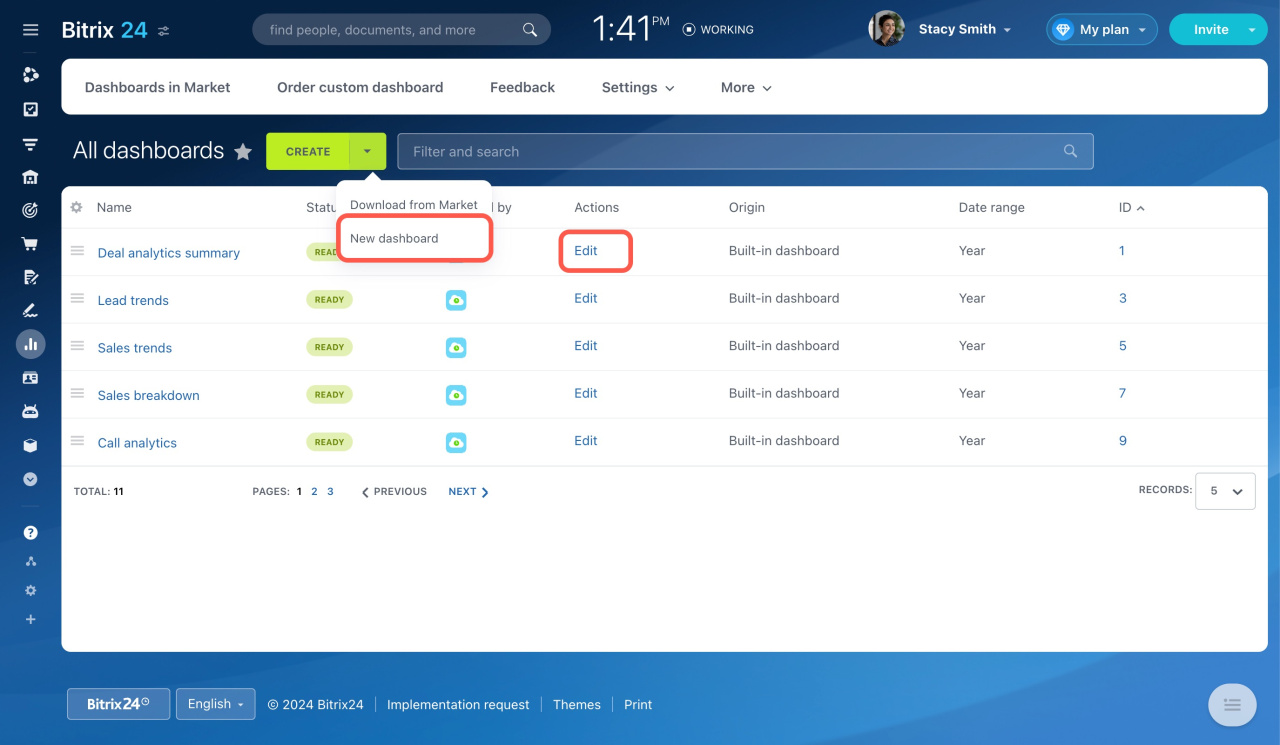
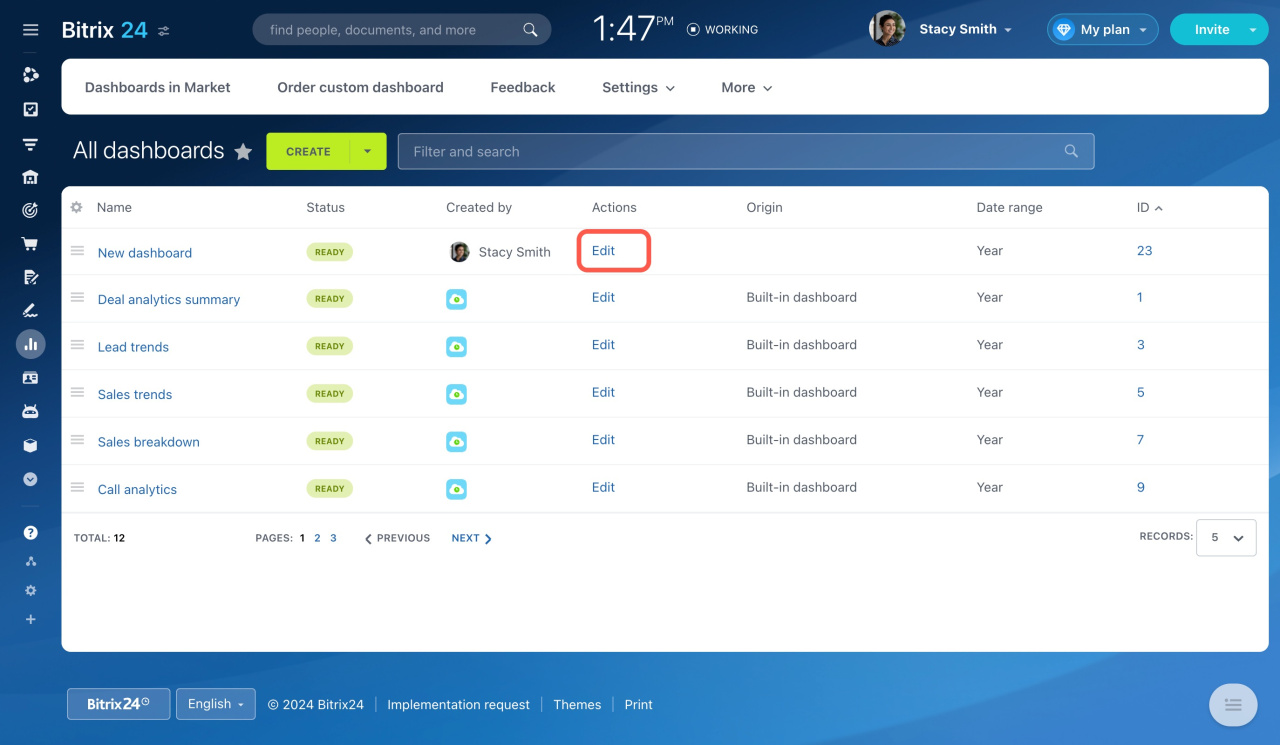
Select a dashboard and click Edit under the Actions column. Bitrix24 will create a copy that can be customized in a variety of ways.
Edit dashboards in BI Builder -
Add a custom dashboard
Click on the small arrow next to the Create button and select New dashboard. Enter a name, select the visibility scope, and set the needed parameters. These parameters are variables that allow you to filter data or show specific values in your dashboards.
Configure dashboard parameters in BI Builder
How to set the dashboard date range and open the BI Builder
To change the date range of a dashboard,
-
Select a dashboard from the list.
-
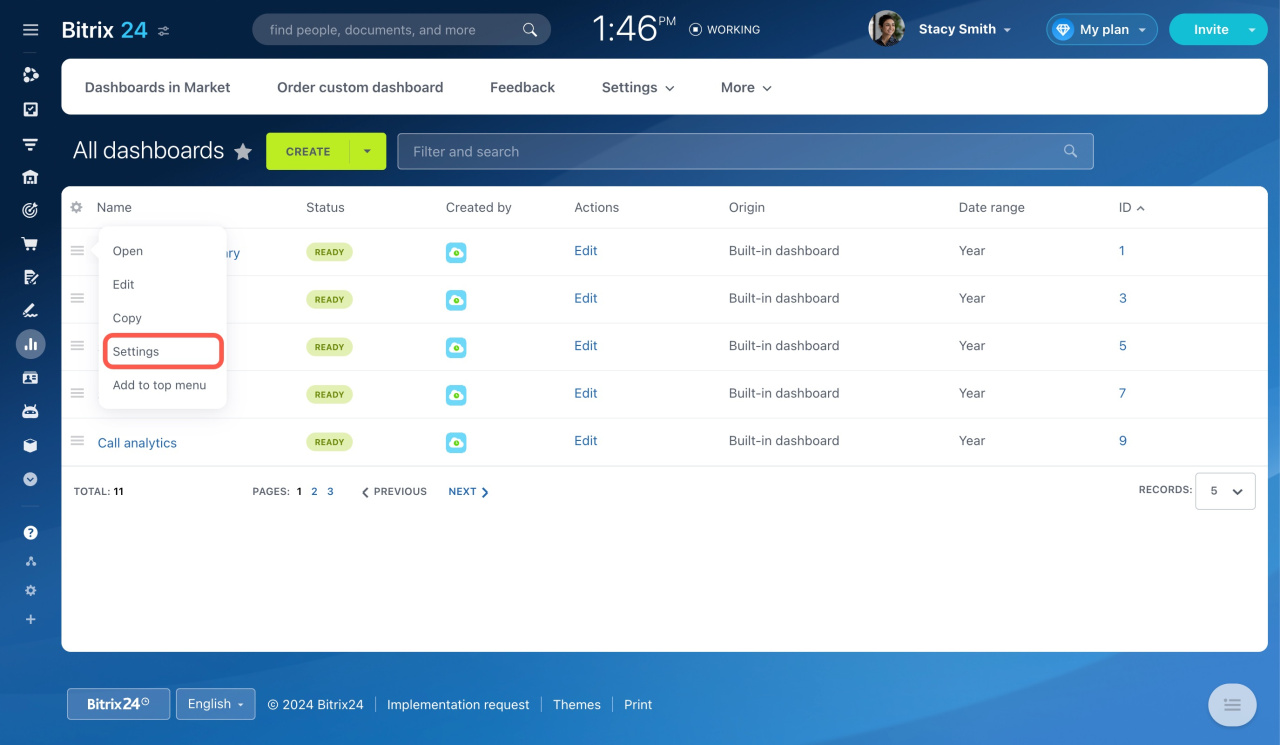
Expand the actions menu (≡) and select Settings.
-
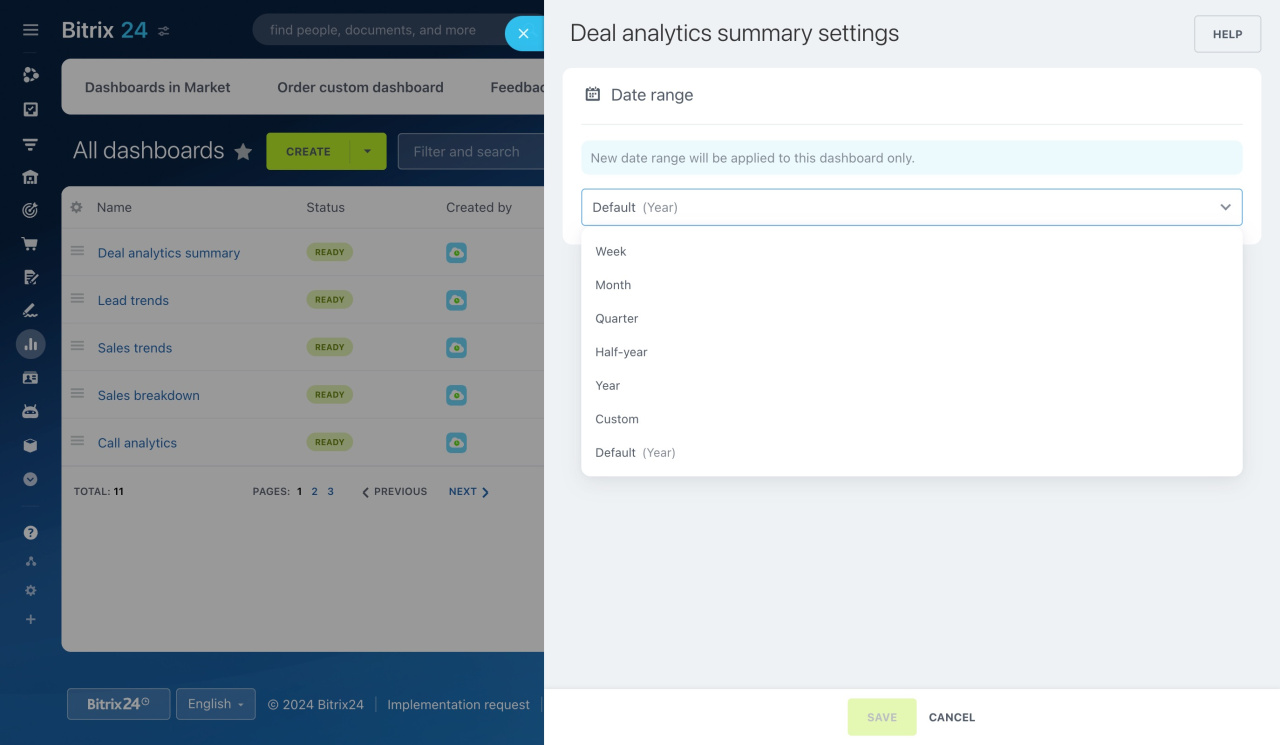
Specify the desired date range.
The speed of data loading depends on the chosen date range. Dashboards, which display data for the past five years, load slower than those for the last year. To speed up the loading of your dashboards, choose the optimal date range for each of them.
To open the BI Builder, select a dashboard and click Edit under the Actions column.
How to use the BI Builder
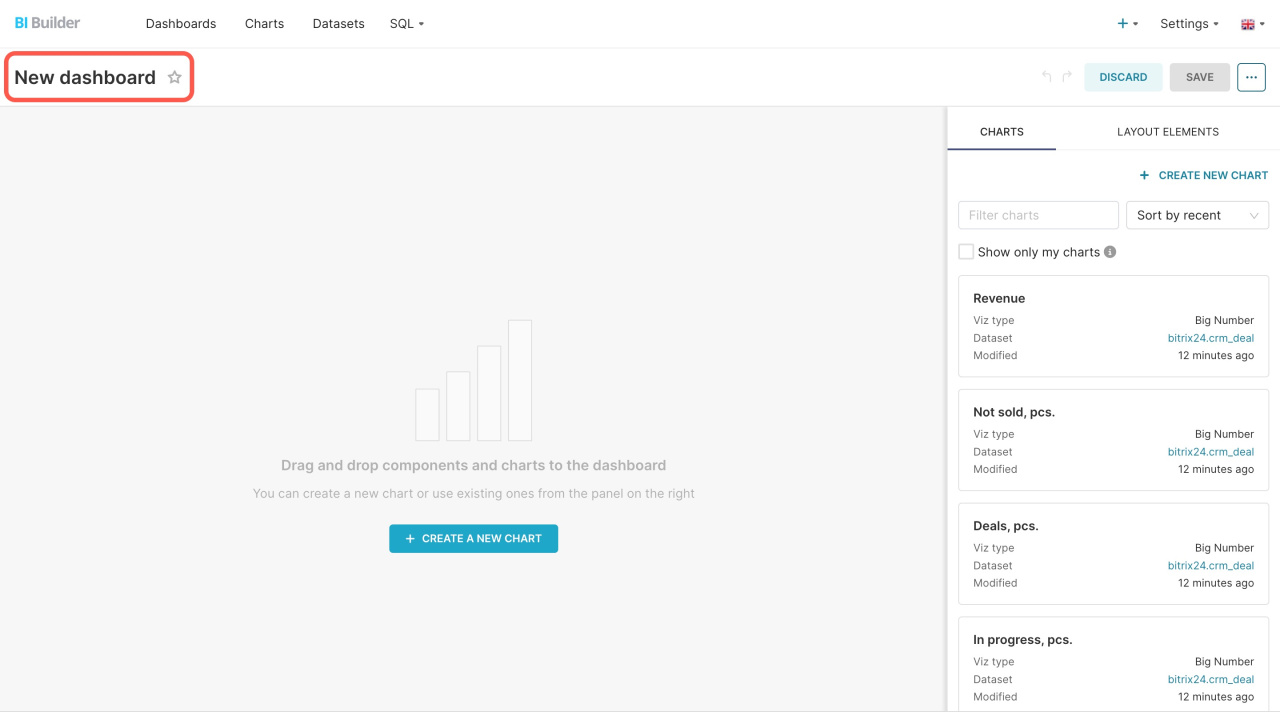
To rename your dashboard, click Edit dashboard in the top right corner and enter a new name on the left.
There are four tabs on the page to view a list of dashboards, configure charts, add datasets, and write an SQL request.
Dashboards. Dashboards are pages filled with charts and tables that automatically update with data. Open this tab to find a list of all dashboards from Bitrix24 there. Remember that you shouldn't add new dashboards in this tab. Otherwise, you won't access them in your Bitrix24.
Charts. Charts are used to represent data visually. They transform numbers into graphs and tables. In this tab, you can edit charts or create new ones.
Datasets. A dataset is a set of data from Bitrix24 on leads, deals, and other entities. In this tab, you can see a list of datasets that were created by built-in dashboards. Use a standard dataset or create new ones.
Description of entity fields in BI Analytics
There are two types of datasets in the BI Builder:
-
A physical set is stored in the database.
-
A virtual set is created from the results of an SQL query. It does not store data physically but gets it from one or more tables when executing a query. Virtual sets combine data from different sources, for example, deals and custom fields.
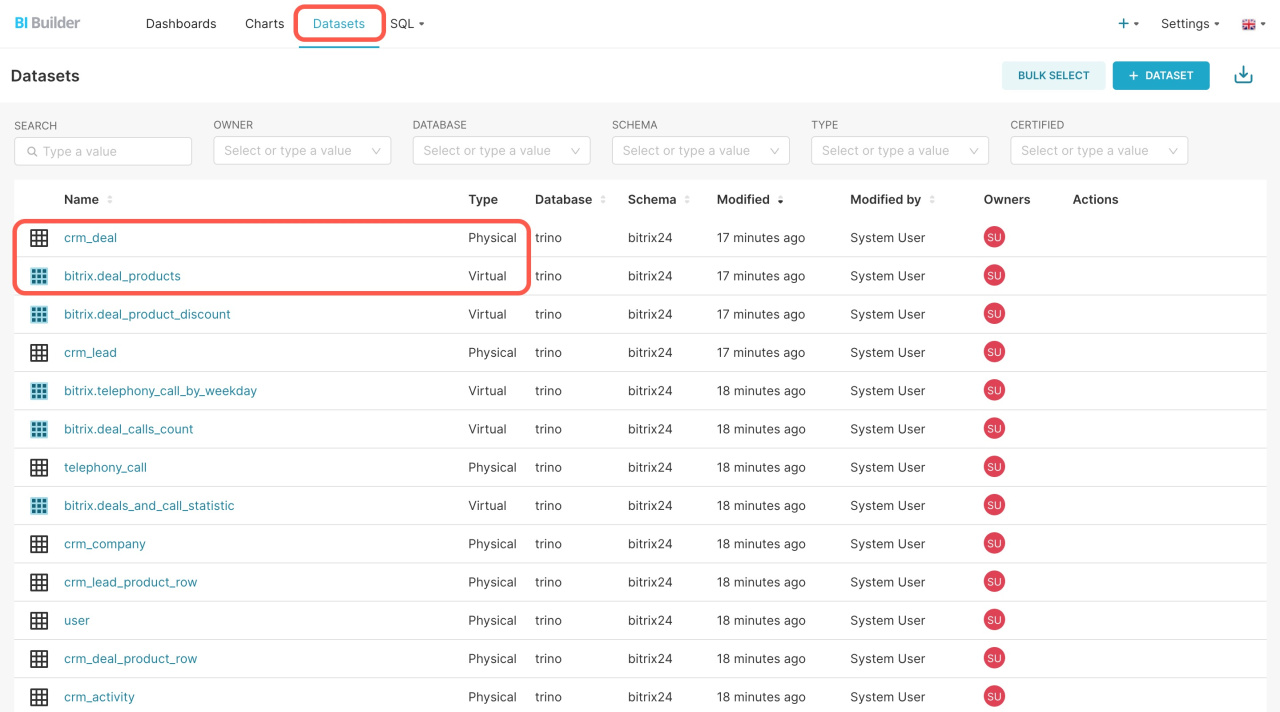 The
The crm_lead_status_history table is physical, it is stored in the database. The bitrix_deal_products table is virtual, it receives data when executing an SQL query.
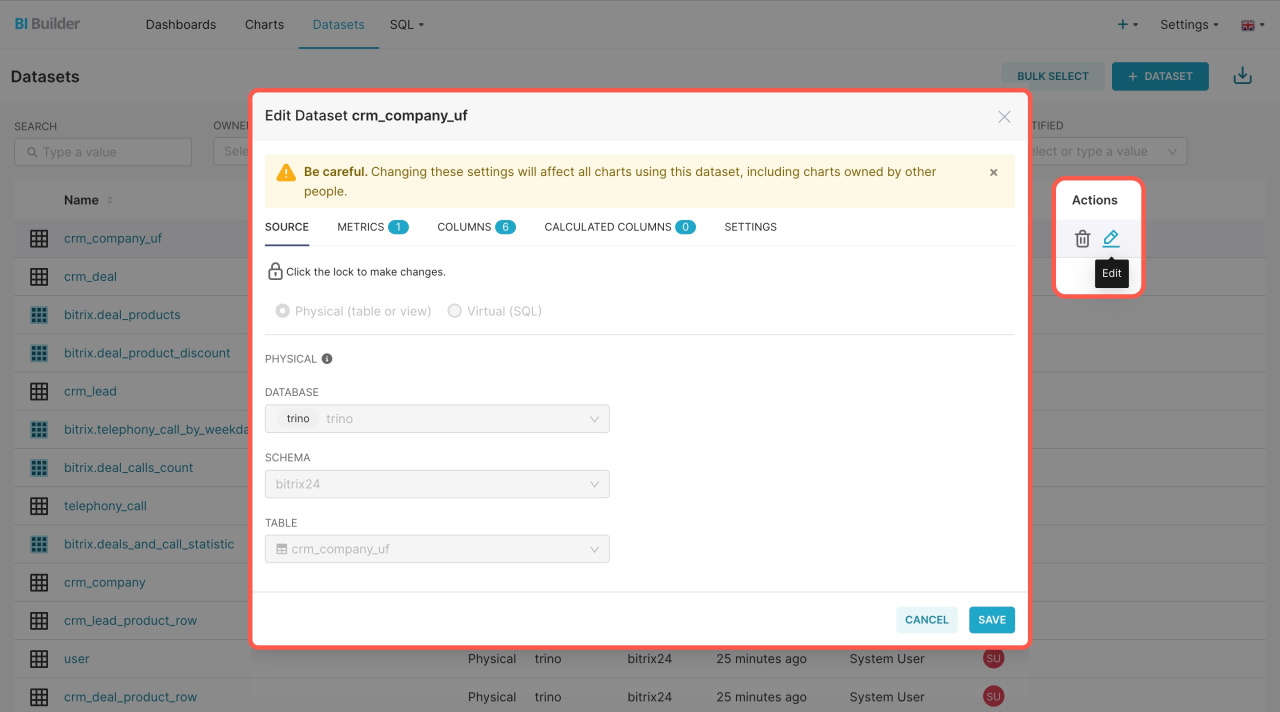
Standard datasets cannot be edited, but you can add a new one and customize it. To do this, hover the cursor over the Actions column and click Edit. Here are the following tabs:
-
Source. Select a ready-made dataset or perform an SQL query to get certain data from different sources.
-
Measures. These are numerical indicators that you can define for a dataset. For example, total revenue, number of sales, or average price.
-
Columns. Determine which columns to include, configure their names and display format, and add a description to better understand the chart.
-
Calculated columns. Add new columns to the table. Specify the column name and formula to count values. For example, you can create a column that will add 1 to the value from the
company_idfield.
For each measure, column, and calculated column, you can specify who certified them as well as the certification details. This way, you will keep track of who worked on the dashboard and who to contact for assistance.
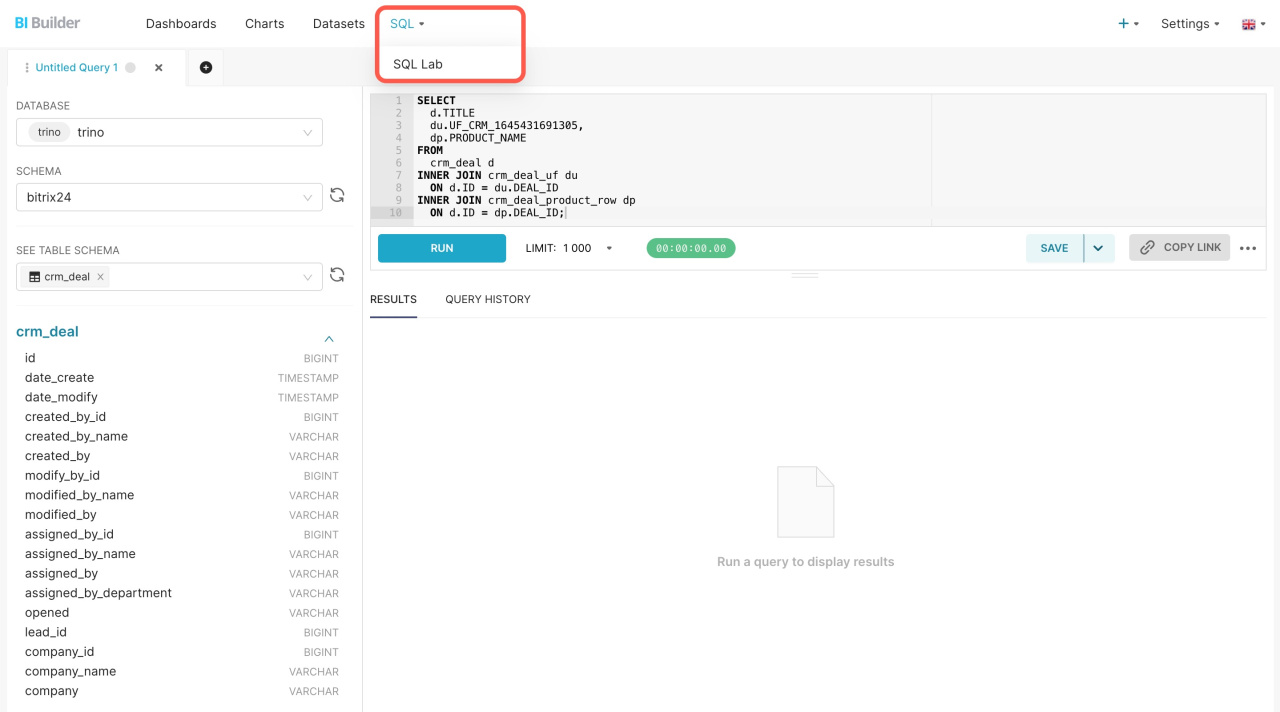
SQL. In this tab, you can write an SQL query and combine data on deals, products, and custom fields.
How to add a chart based on a virtual dataset to a report
How to create a dataset and add a chart to your dashboard
To fill the report with data, go to the Datasets tab. Select a ready-made dataset or create a new one. To create a new dataset, click + Dataset.
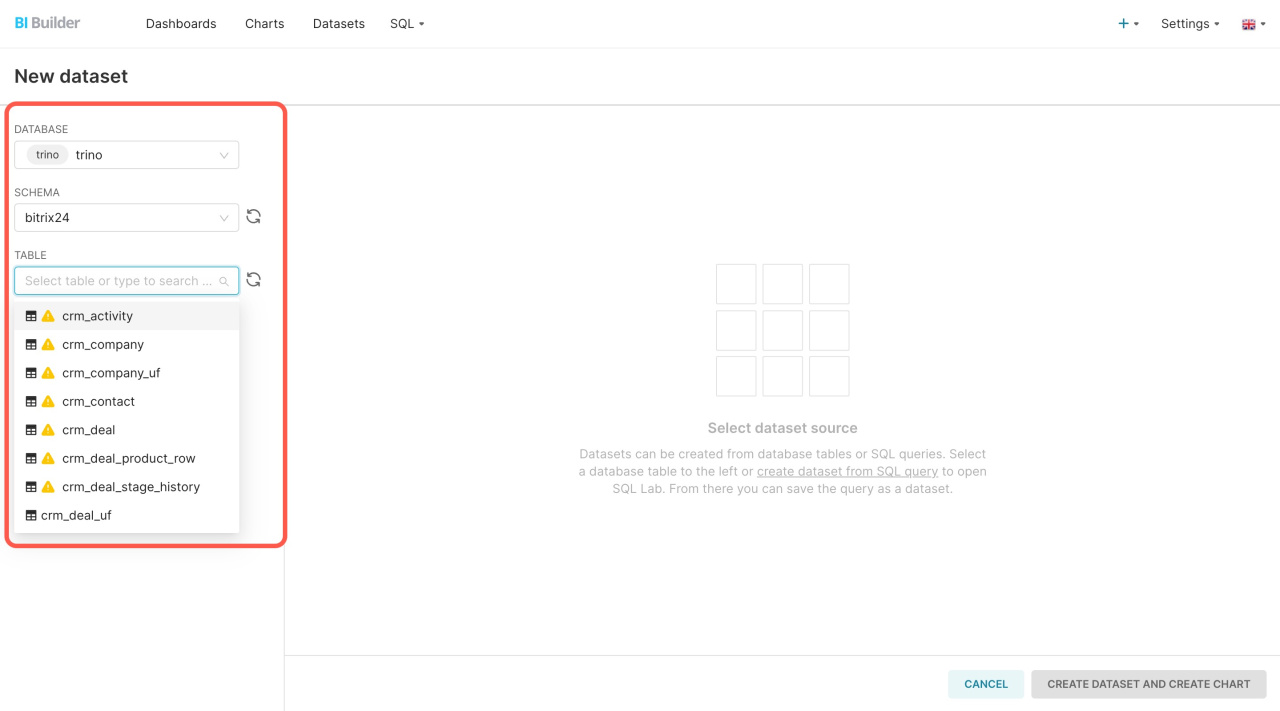
Complete three parameters on the page:
-
The Trino database is an organized system for storing, managing, and retrieving data.
-
The Bitrix24 Schema is a structured mapping of database content. It shows how the data is arranged: table location, their connection to each other, and the rules applied to this data.
-
The Table allows you to select a dataset from Bitrix24 for leads, deals, and other entities. All available data tables are shown in the drop-down list. The
 symbol marks those used in built-in dashboards.
For instance, we use a dataset of the deal's custom fields. Once you select a dataset, you'll see a list of fields and data types included in it. After that, click Create dataset and create chart.
Supported data types
| Data type | Description |
|---|---|
| INTEGER | Used for whole numbers. Variables or database columns will contain only integers (no fractional parts). |
| BIGINT | Used for large integers. It is suitable when the range of a regular INTEGER is not enough. For example, when working with unique IDs of deals or leads. |
| BOOLEAN | Used for representing logical values. Values can be true or false. For example, a field that returns yes or no, on or off. |
| DOUBLE | Used for numbers with a fractional part and a possible loss of accuracy. |
| VARCHAR | Means a variable character or variable string. The data type for storing text strings. |
| TIMESTAMP | Used for date and time. It is suitable to record a precise moment in time, for example, when an item was created or modified. |
| DATE | Used for dates without time. It stores information about the year, month, and day, but does not include the time of day. |
| DECIMAL | Used for numbers with fixed precision. It is suitable for storing currency data. It stores an exact number value with a certain number of digits to the right of the decimal point. |
Select a dataset from Bitrix24, decide how to present the data, and click Create new chart.
When configuring the chart, use the Query Mode parameter to determine how to process your data. There are two query modes:
-
Aggregate: The data is grouped according to certain criteria, and calculations are performed for each group, such as sum, average, maximum, and minimum. This mode is suitable when you need to understand general trends or compare the data from different groups using a bar or pie chart.
-
Raw records: Each row of data is treated individually. This mode is suitable for detailed analysis where you need to view information on each deal or entity.
In the chart interface, you can drag and drop metrics into columns. As you move them, placement zones are highlighted. Colors indicate which areas are available or unavailable for placement.
Select the metrics on the left and drag them to the Columns block, then save the table.
Enter a name, select your dashboard, and click Save & Go to dashboard.
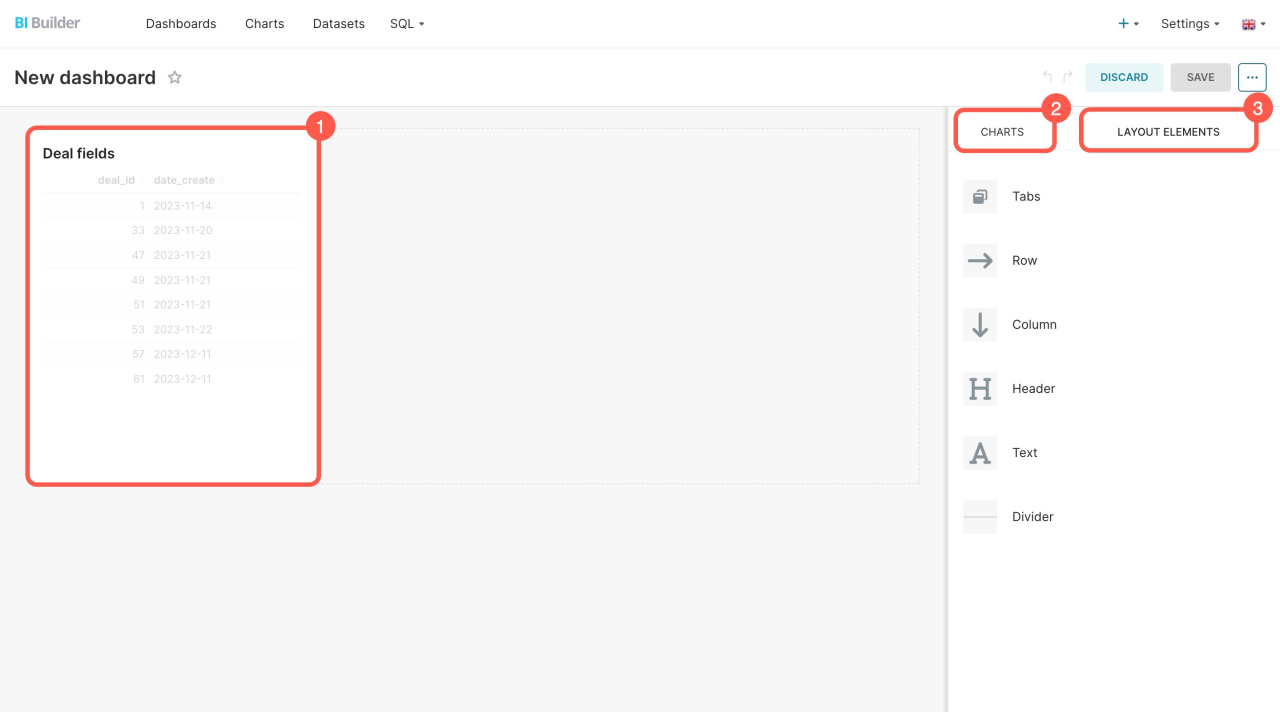
Review your dashboard. Adjust the chart position, add other charts, or change their layout.
After you save the changes, go back to Bitrix24 and reopen the report.
In brief
-
There are two ways to create a custom dashboard in BI Builder: edit a built-in dashboard or create a new one from scratch.
-
To speed up the loading of your dashboards, choose the optimal date range for each of them.
-
Dashboards are pages filled with charts and tables that automatically update with data.
-
There are physical and virtual datasets in the BI Builder. Virtual datasets combine information from various sources, for example, deals and custom fields.
-
For each measure, column, and calculated column, you can specify who certified them as well as the certification details. This way, you will keep track of who worked on the dashboard and who to contact for assistance.
-
To fill the dashboard with data, select a ready-made set or create a new one. Then create a chart and add it to the dashboard.

