The dashboard design can be changed using CSS (Cascading Style Sheets). CSS is a code that allows you to visually design the dashboard. Change the background and element colors. Learn how to use CSS and design dashboard charts.
How to open the CSS editor
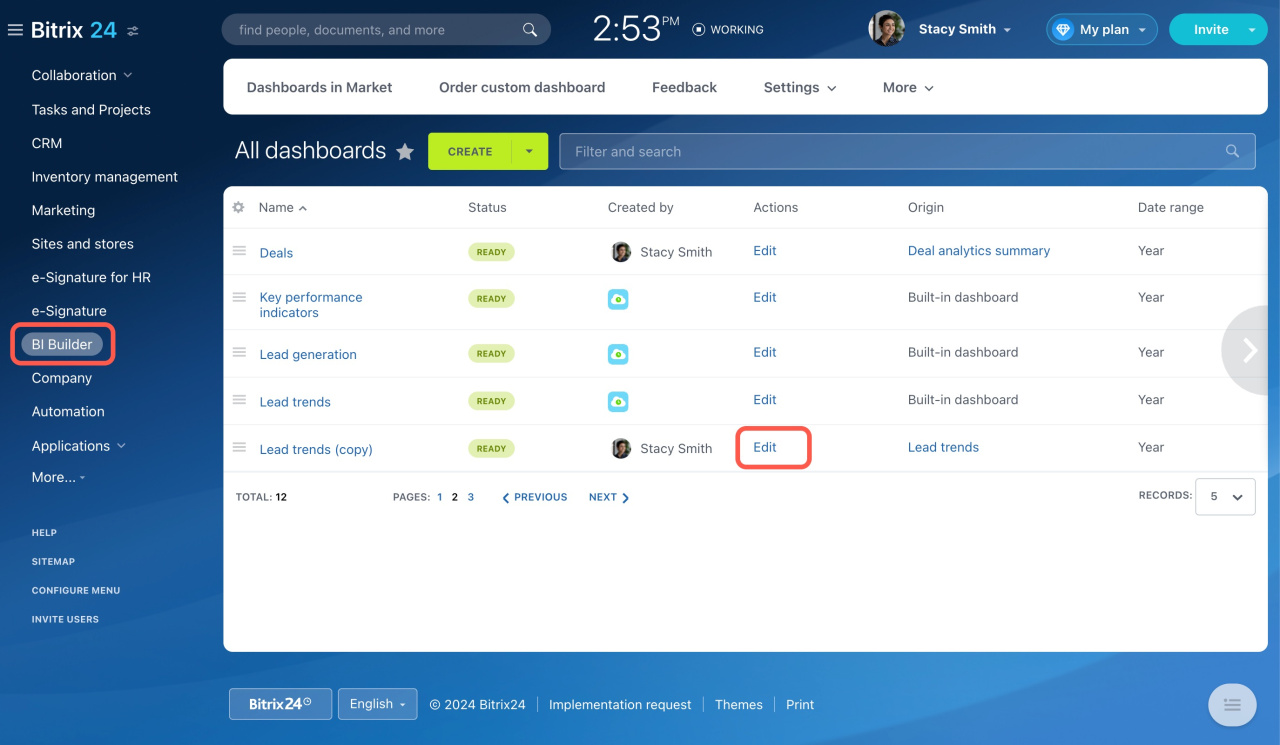
Go to the BI Builder section, select a dashboard, and click Edit.
Edit dashboards in BI Builder
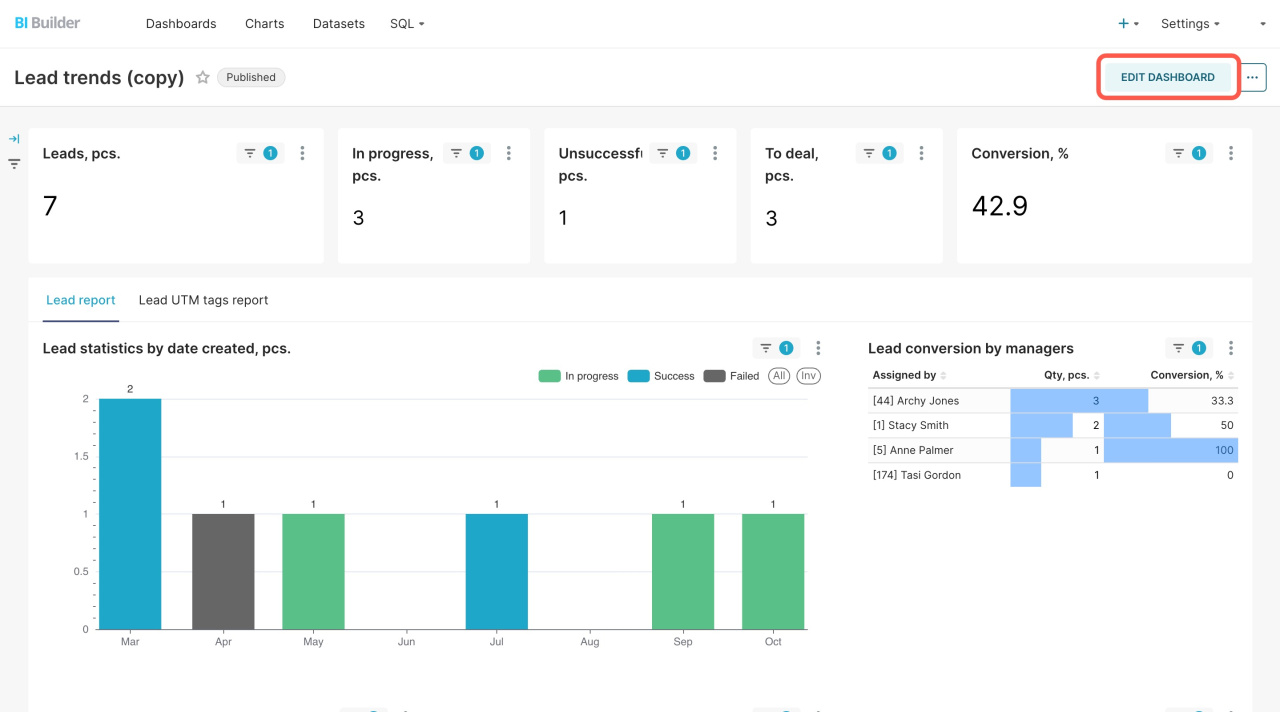
Click Edit Dashboard.
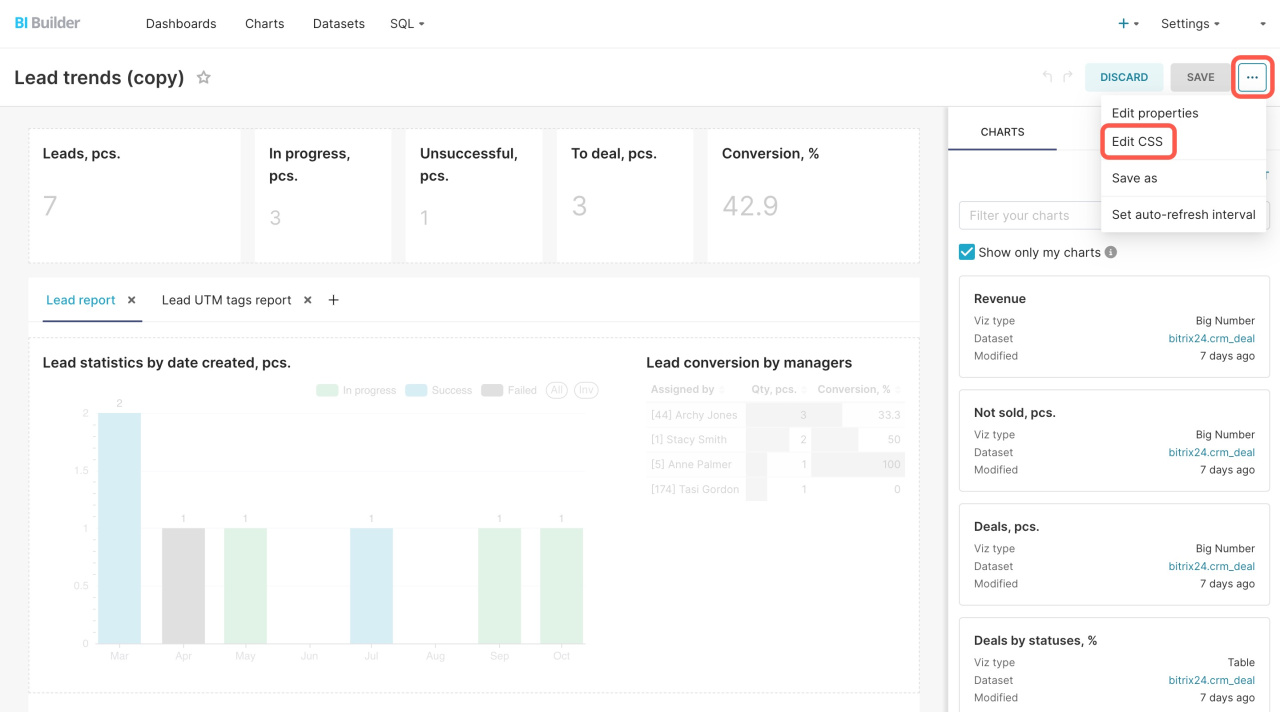
Then click the three dots button and select Edit CSS.
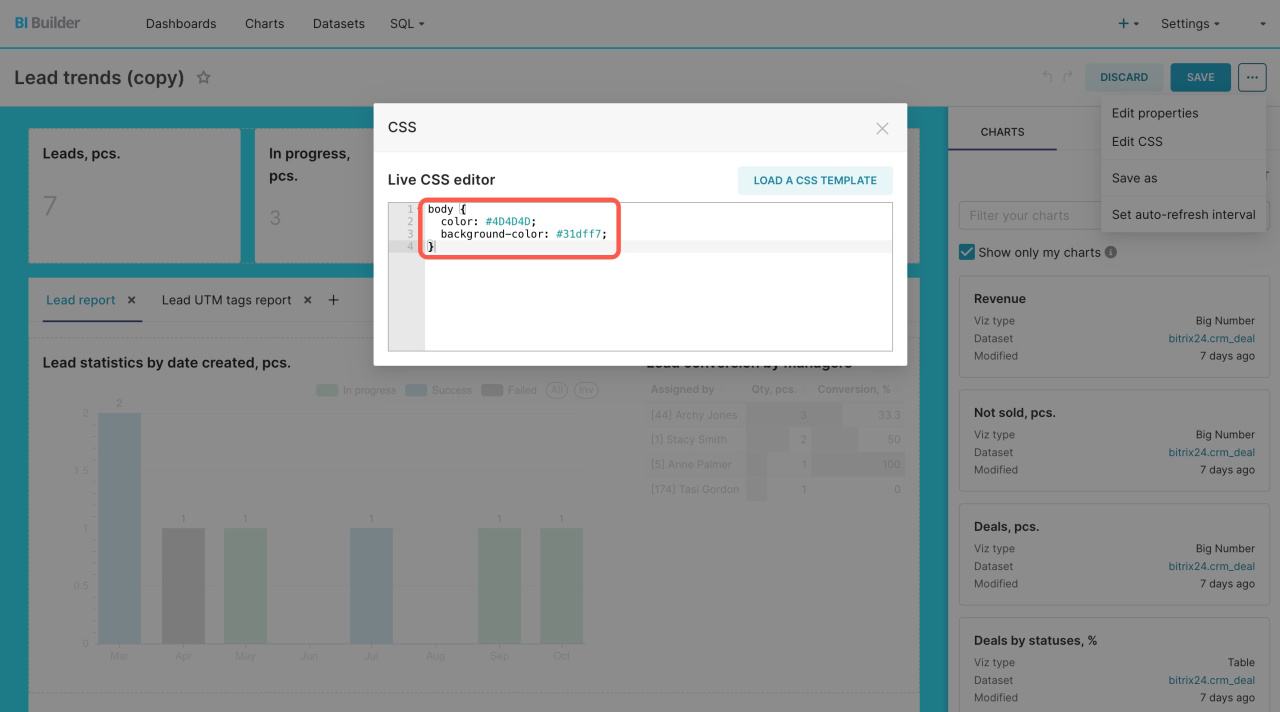
Paste the code in the pop-up editor window. It will be immediately applied to the dashboard elements.
How to use CSS for dashboard design
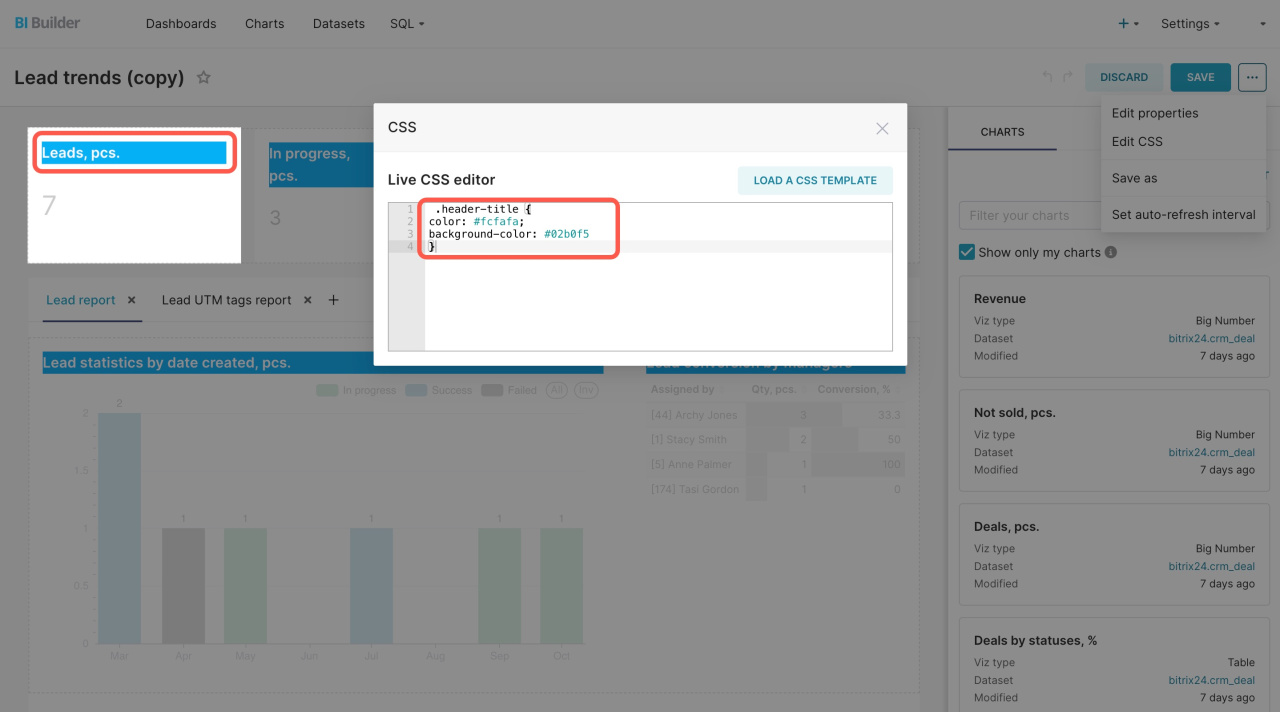
CSS can be applied to the entire dashboard or a specific chart. For example, to change the background color of all headers, use the following code:
.header-title { color: #fcfafa; background-color: #02b0f5 }
-
header-title: Changes the text and the background color of the header.
-
color: #fcfafa: Sets the text color in the header.
-
background-color: #02b0f5: Sets the background color of the header.
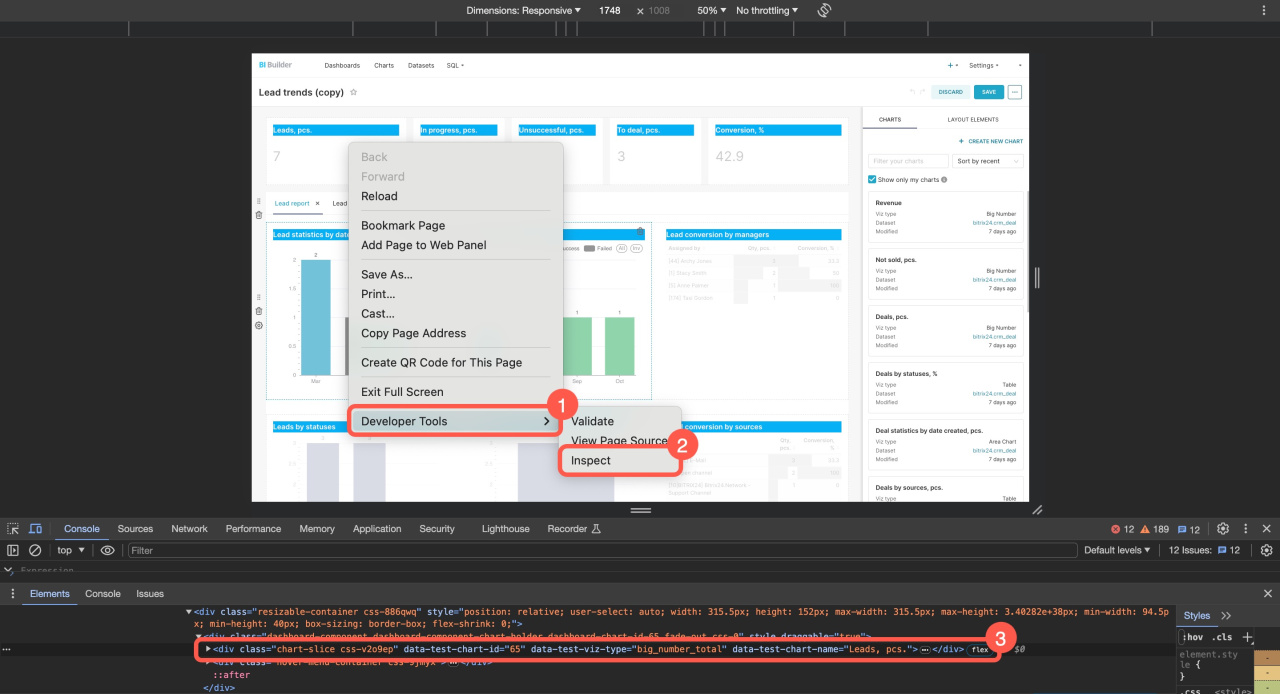
To hide the name of a certain chart, you need to know its identifier. Select a chart and view the code in your browser. Find the necessary code line and copy the identifier:
-
data-test-chart-id="65": Chart identifier.
-
data-test-viz-type: Chart type.
-
data-test-chart-name: Chart name.
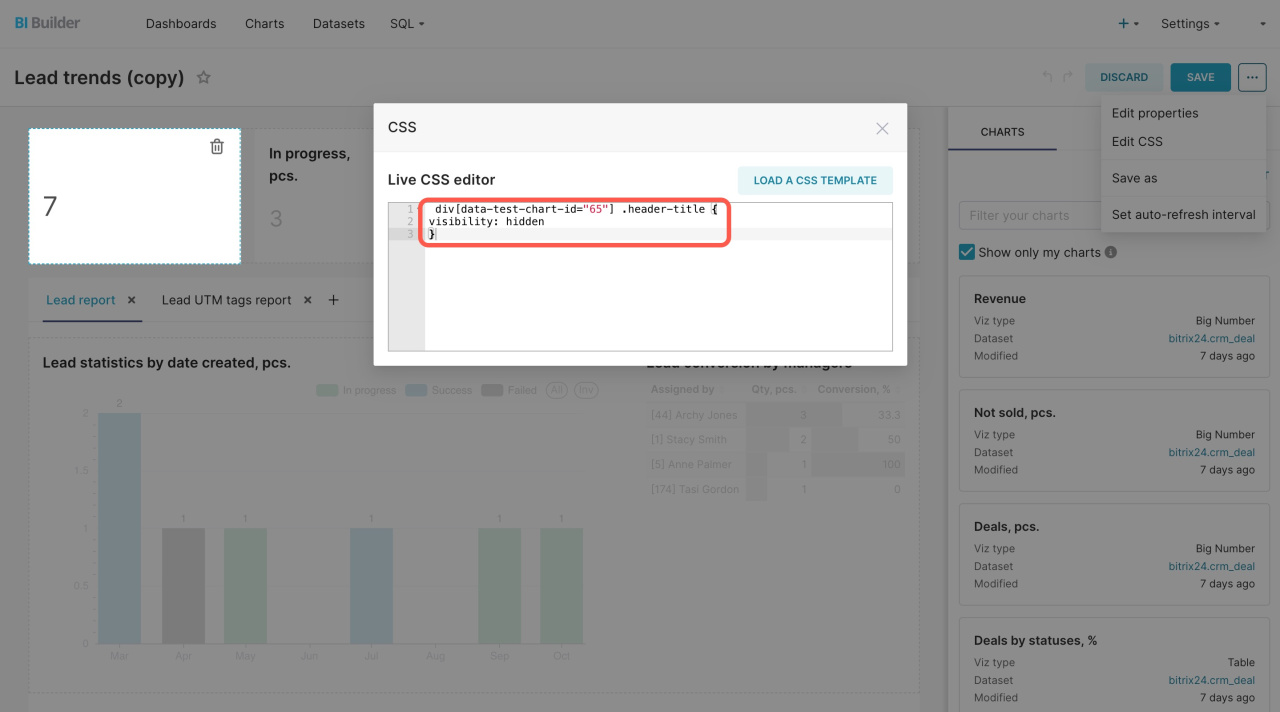
Enter the code in the CSS editor. It will hide the name of the chart:
div[data-test-chart-id="139"] .header-title { visibility: hidden }
-
div[data-test-chart-id="65"] .header-title: Identifier indicates a specific header.
-
visibility: hidden: Hides the title.
List of basic CSS templates for dashboard design
| CSS code | Action |
|---|---|
body { color: #f7f9fa; background-color: #45d1ff }
|
Changes the dashboard background |
.dashboard-component { color: #45d1ff }
|
Changes the color of the dashboard components |
.header-title { color: #f7f9fa; background-color: #45d1ff }
|
Changes the background color of the header |
.dashboard-markdown .dashboard-component-chart-holder { overflow-y: hidden; overflow-x: hidden }
|
Hides the dashboard scroll bar |
.editable-title { display: none; justify-content: flex-end;!important }
|
Hides the names of all charts |
div[data-test-chart-id="000"] .header-controls { visibility:hidden }
|
Hides the controls |
div[data-test-chart-id="000"] .header-title { visibility: hidden }
|
Hides the name of a specific chart |
div[data-test-chart-id="000"] { border: thick double #45d1ff }
|
Adds a frame for the chart |
In brief
- The dashboard design can be changed using CSS (Cascading Style Sheets). CSS is a code that allows you to visually design the dashboard. Change the background and element colors.
- Go to the BI Builder section, select a dashboard, and click Edit.
- Click Edit Dashboard - three dots button - Edit CSS. Paste the code in the editor window. It will be immediately applied to the dashboard elements.
- To use some CSS styles, you need to know the chart ID. To find it out, select the chart and view the code in your browser.
Read also:

