The Analytics hub in BI Builder is a centralized space designed to help analysts connect external data sources, track usage statistics, and find elements not included in dashboards. Upload data from CSV files or connect ad accounts to get it. Analysts can use this data to create new datasets, charts, and dashboards.
In this article:
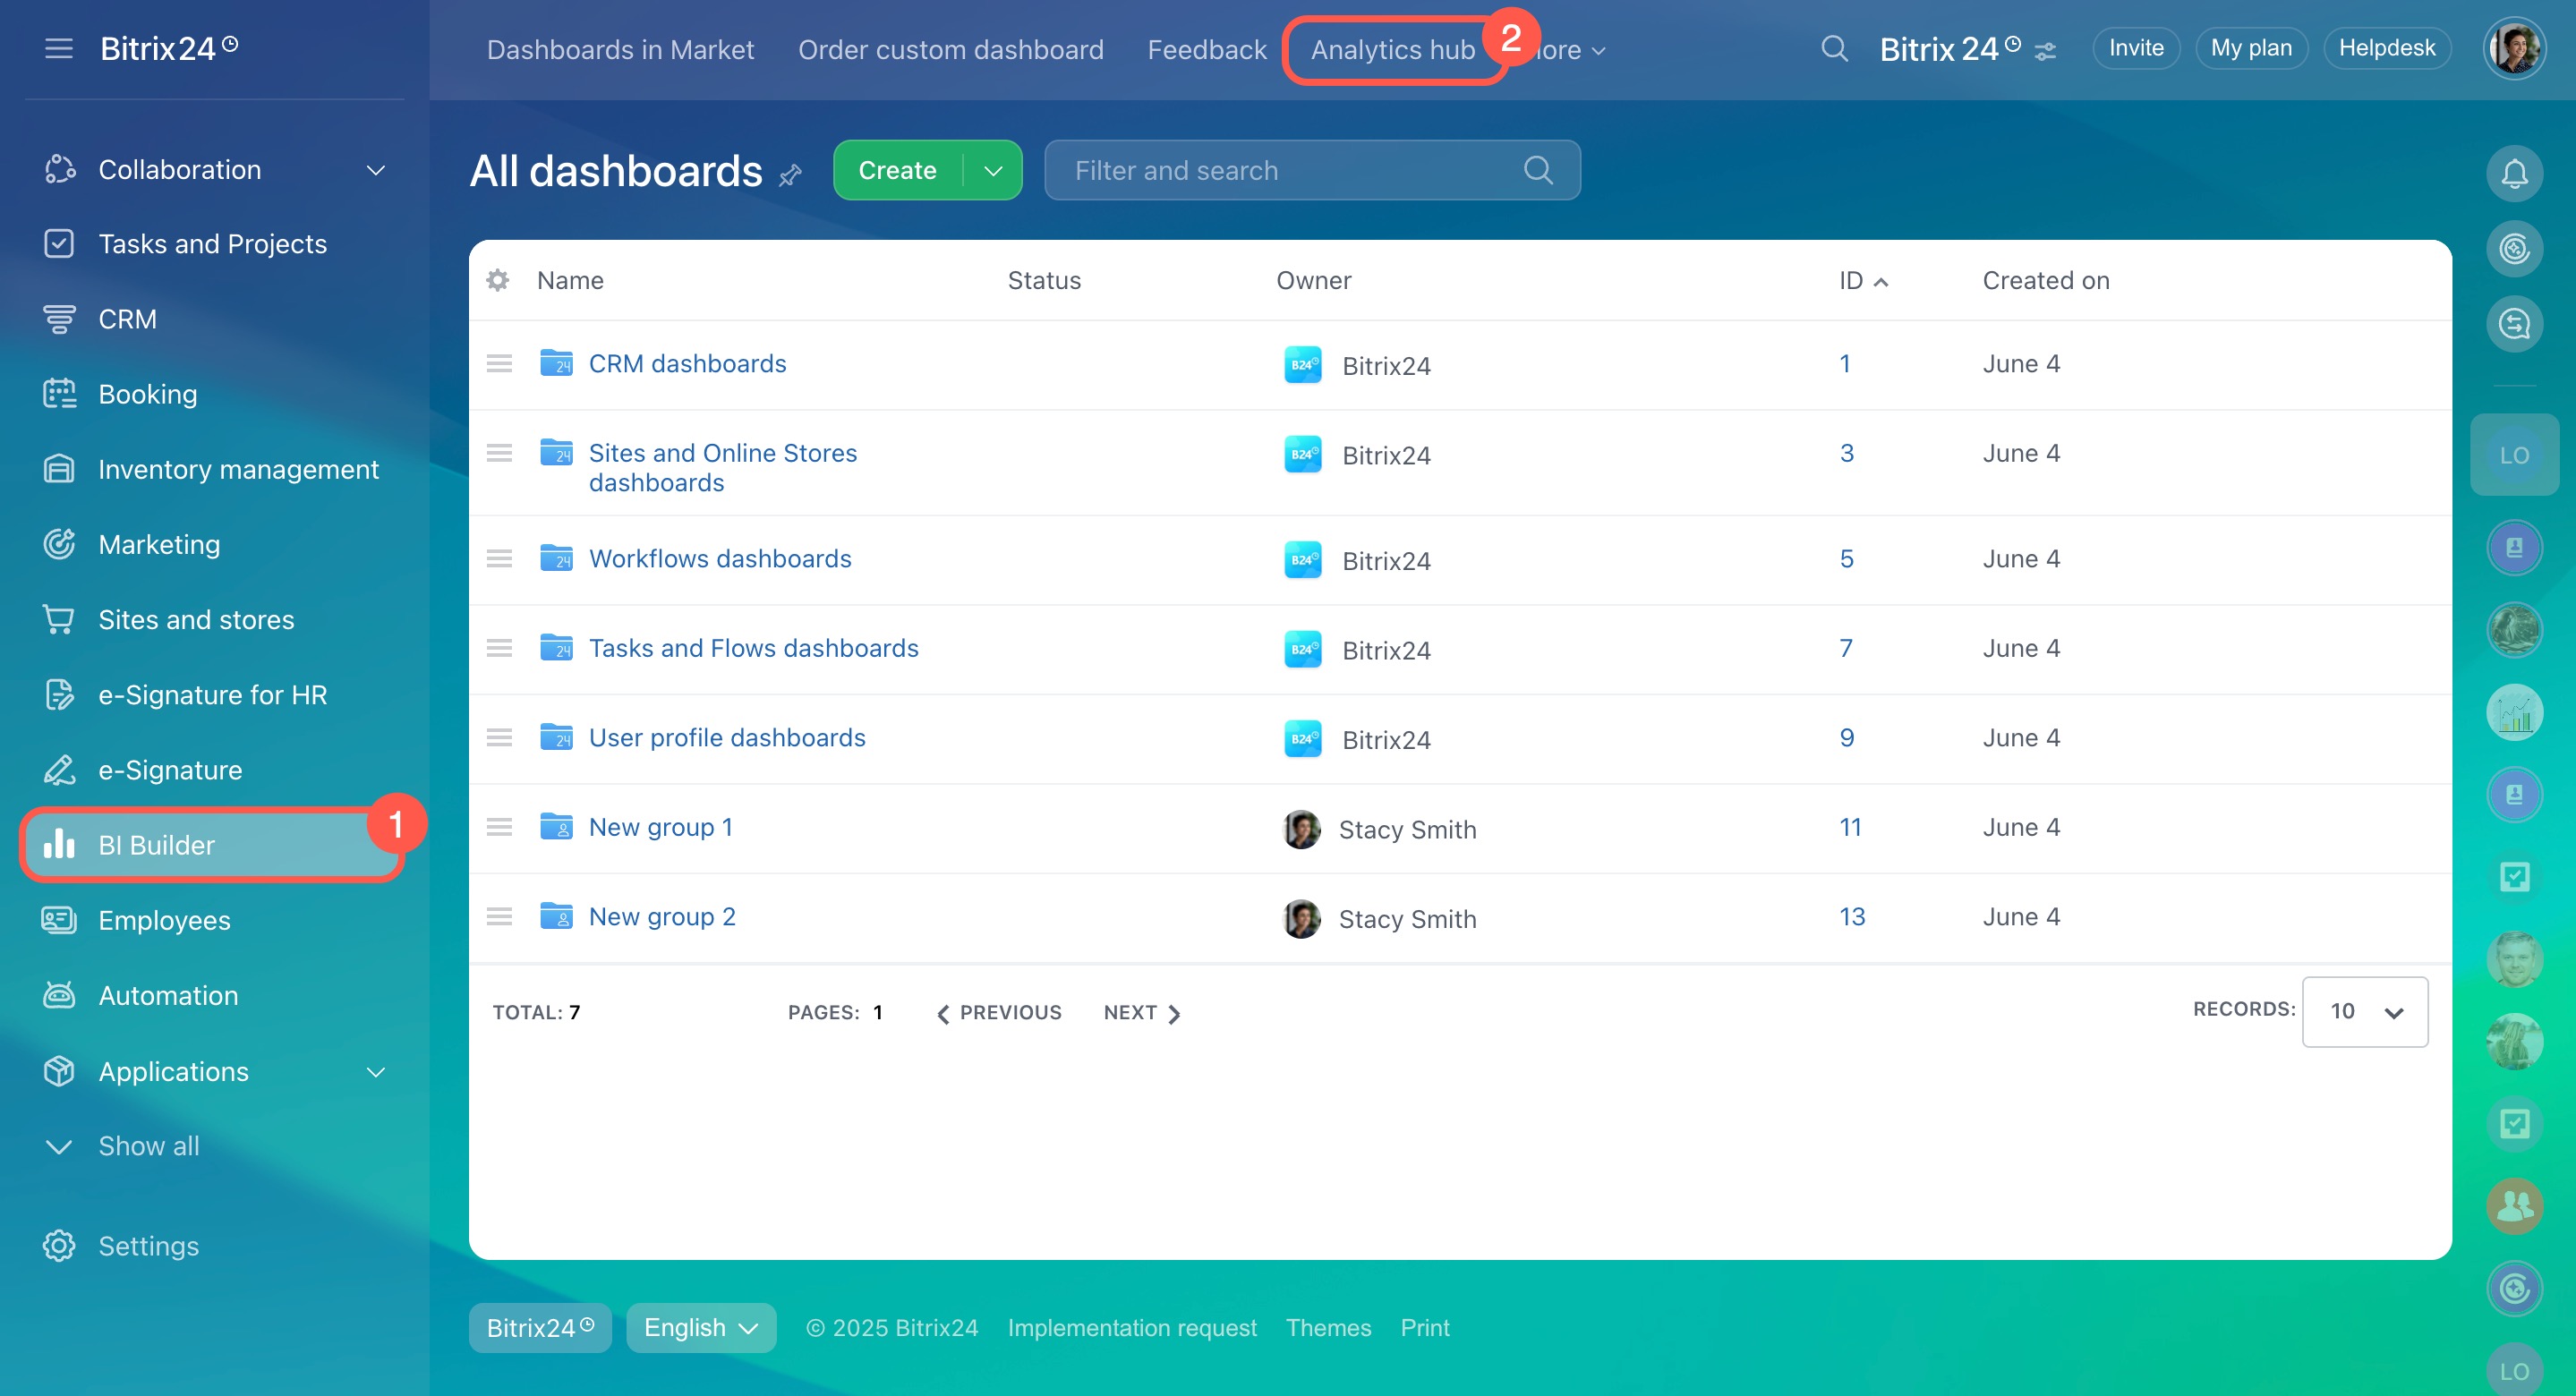
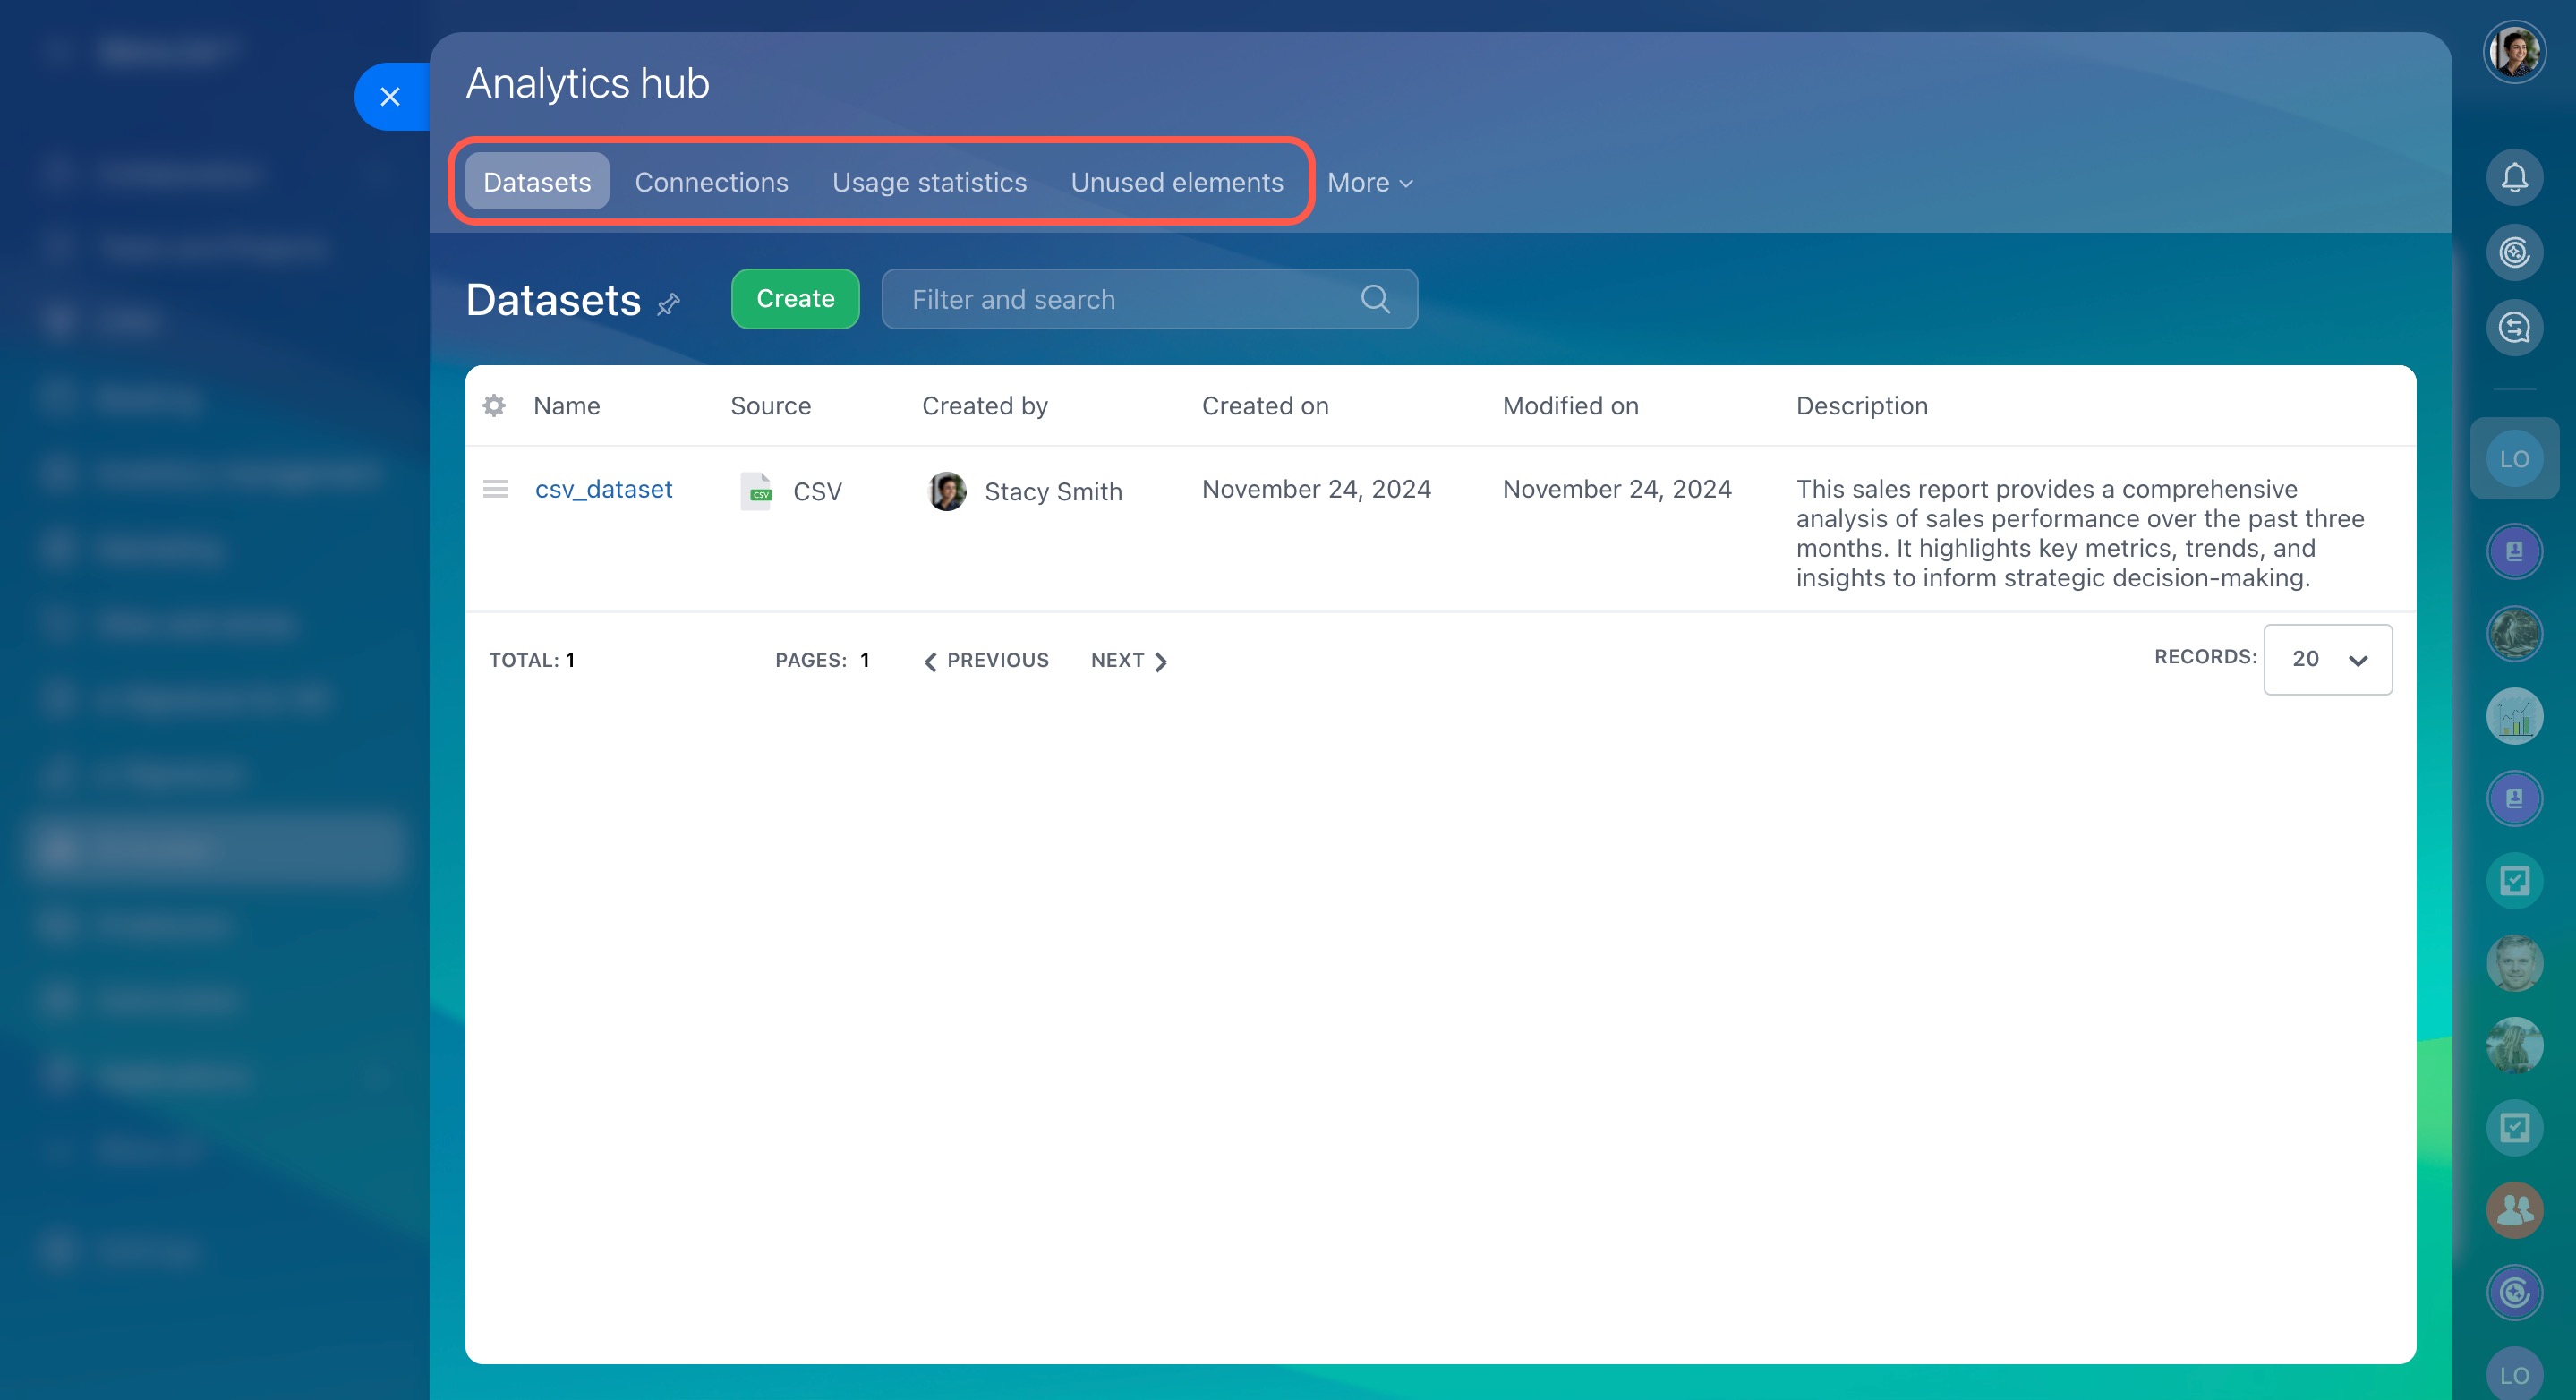
To access this section, go to BI Builder > Analytics hub. The page has four tabs:
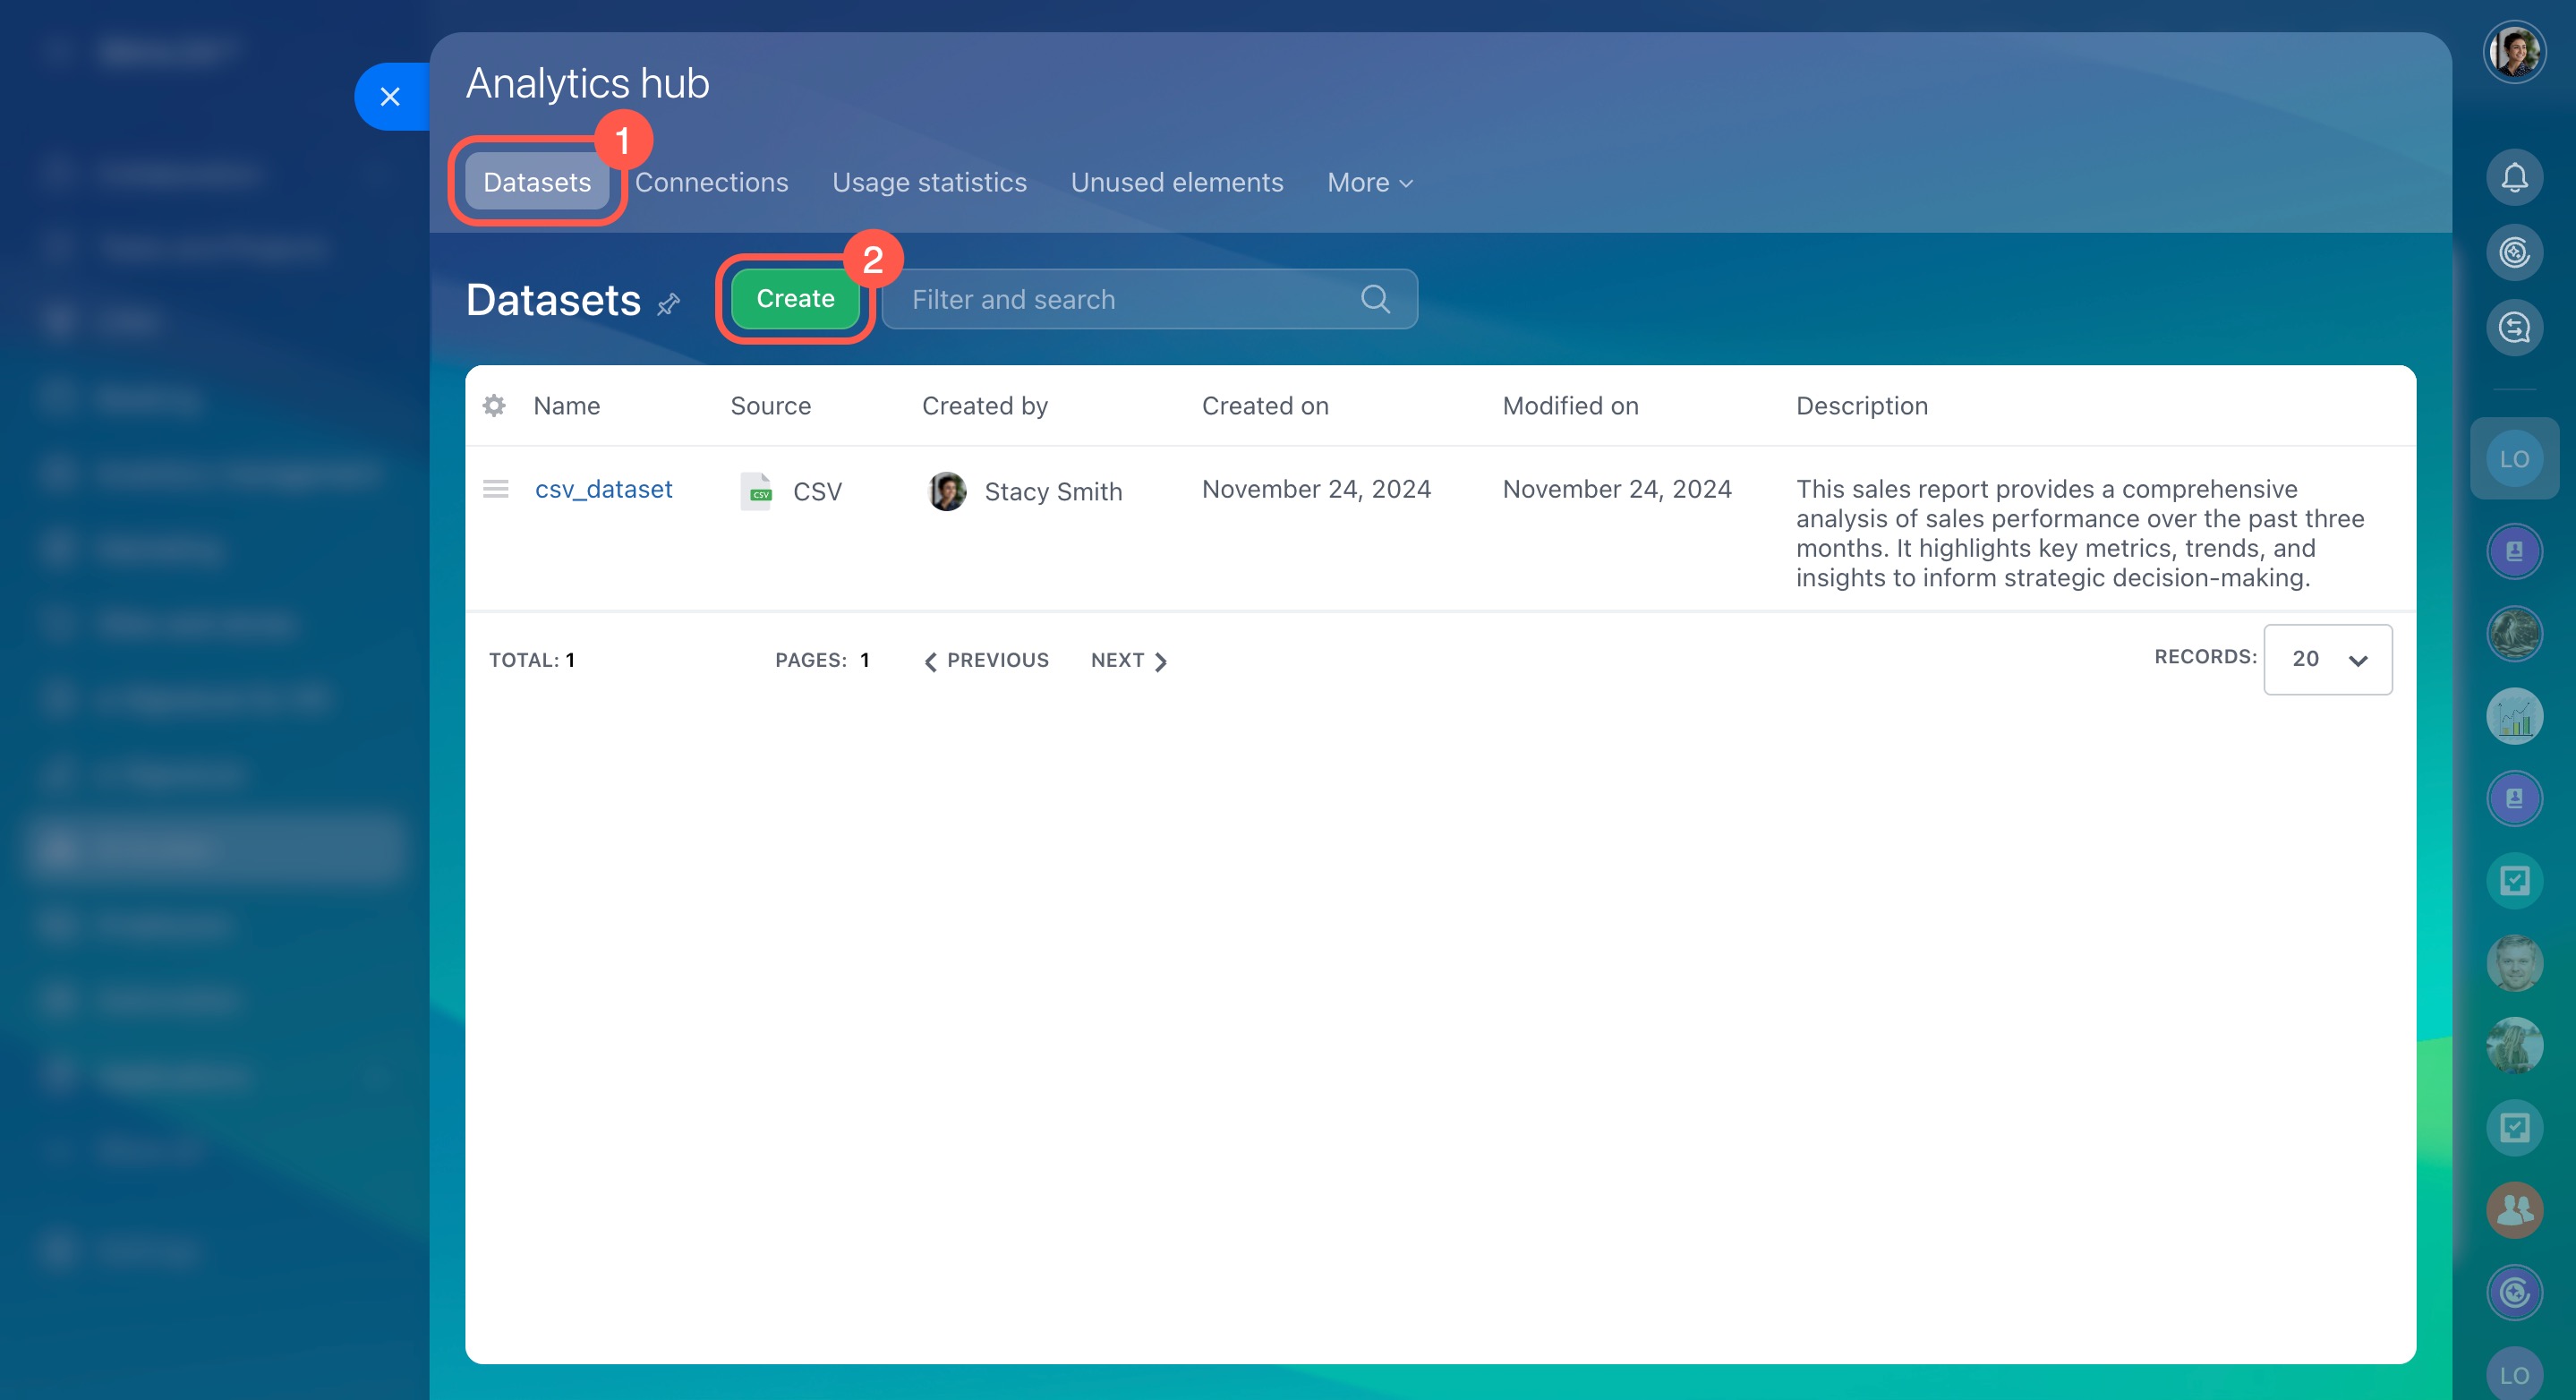
Datasets: View and manage all manually uploaded datasets. Create new datasets from CSV files and check their creation and modification dates.
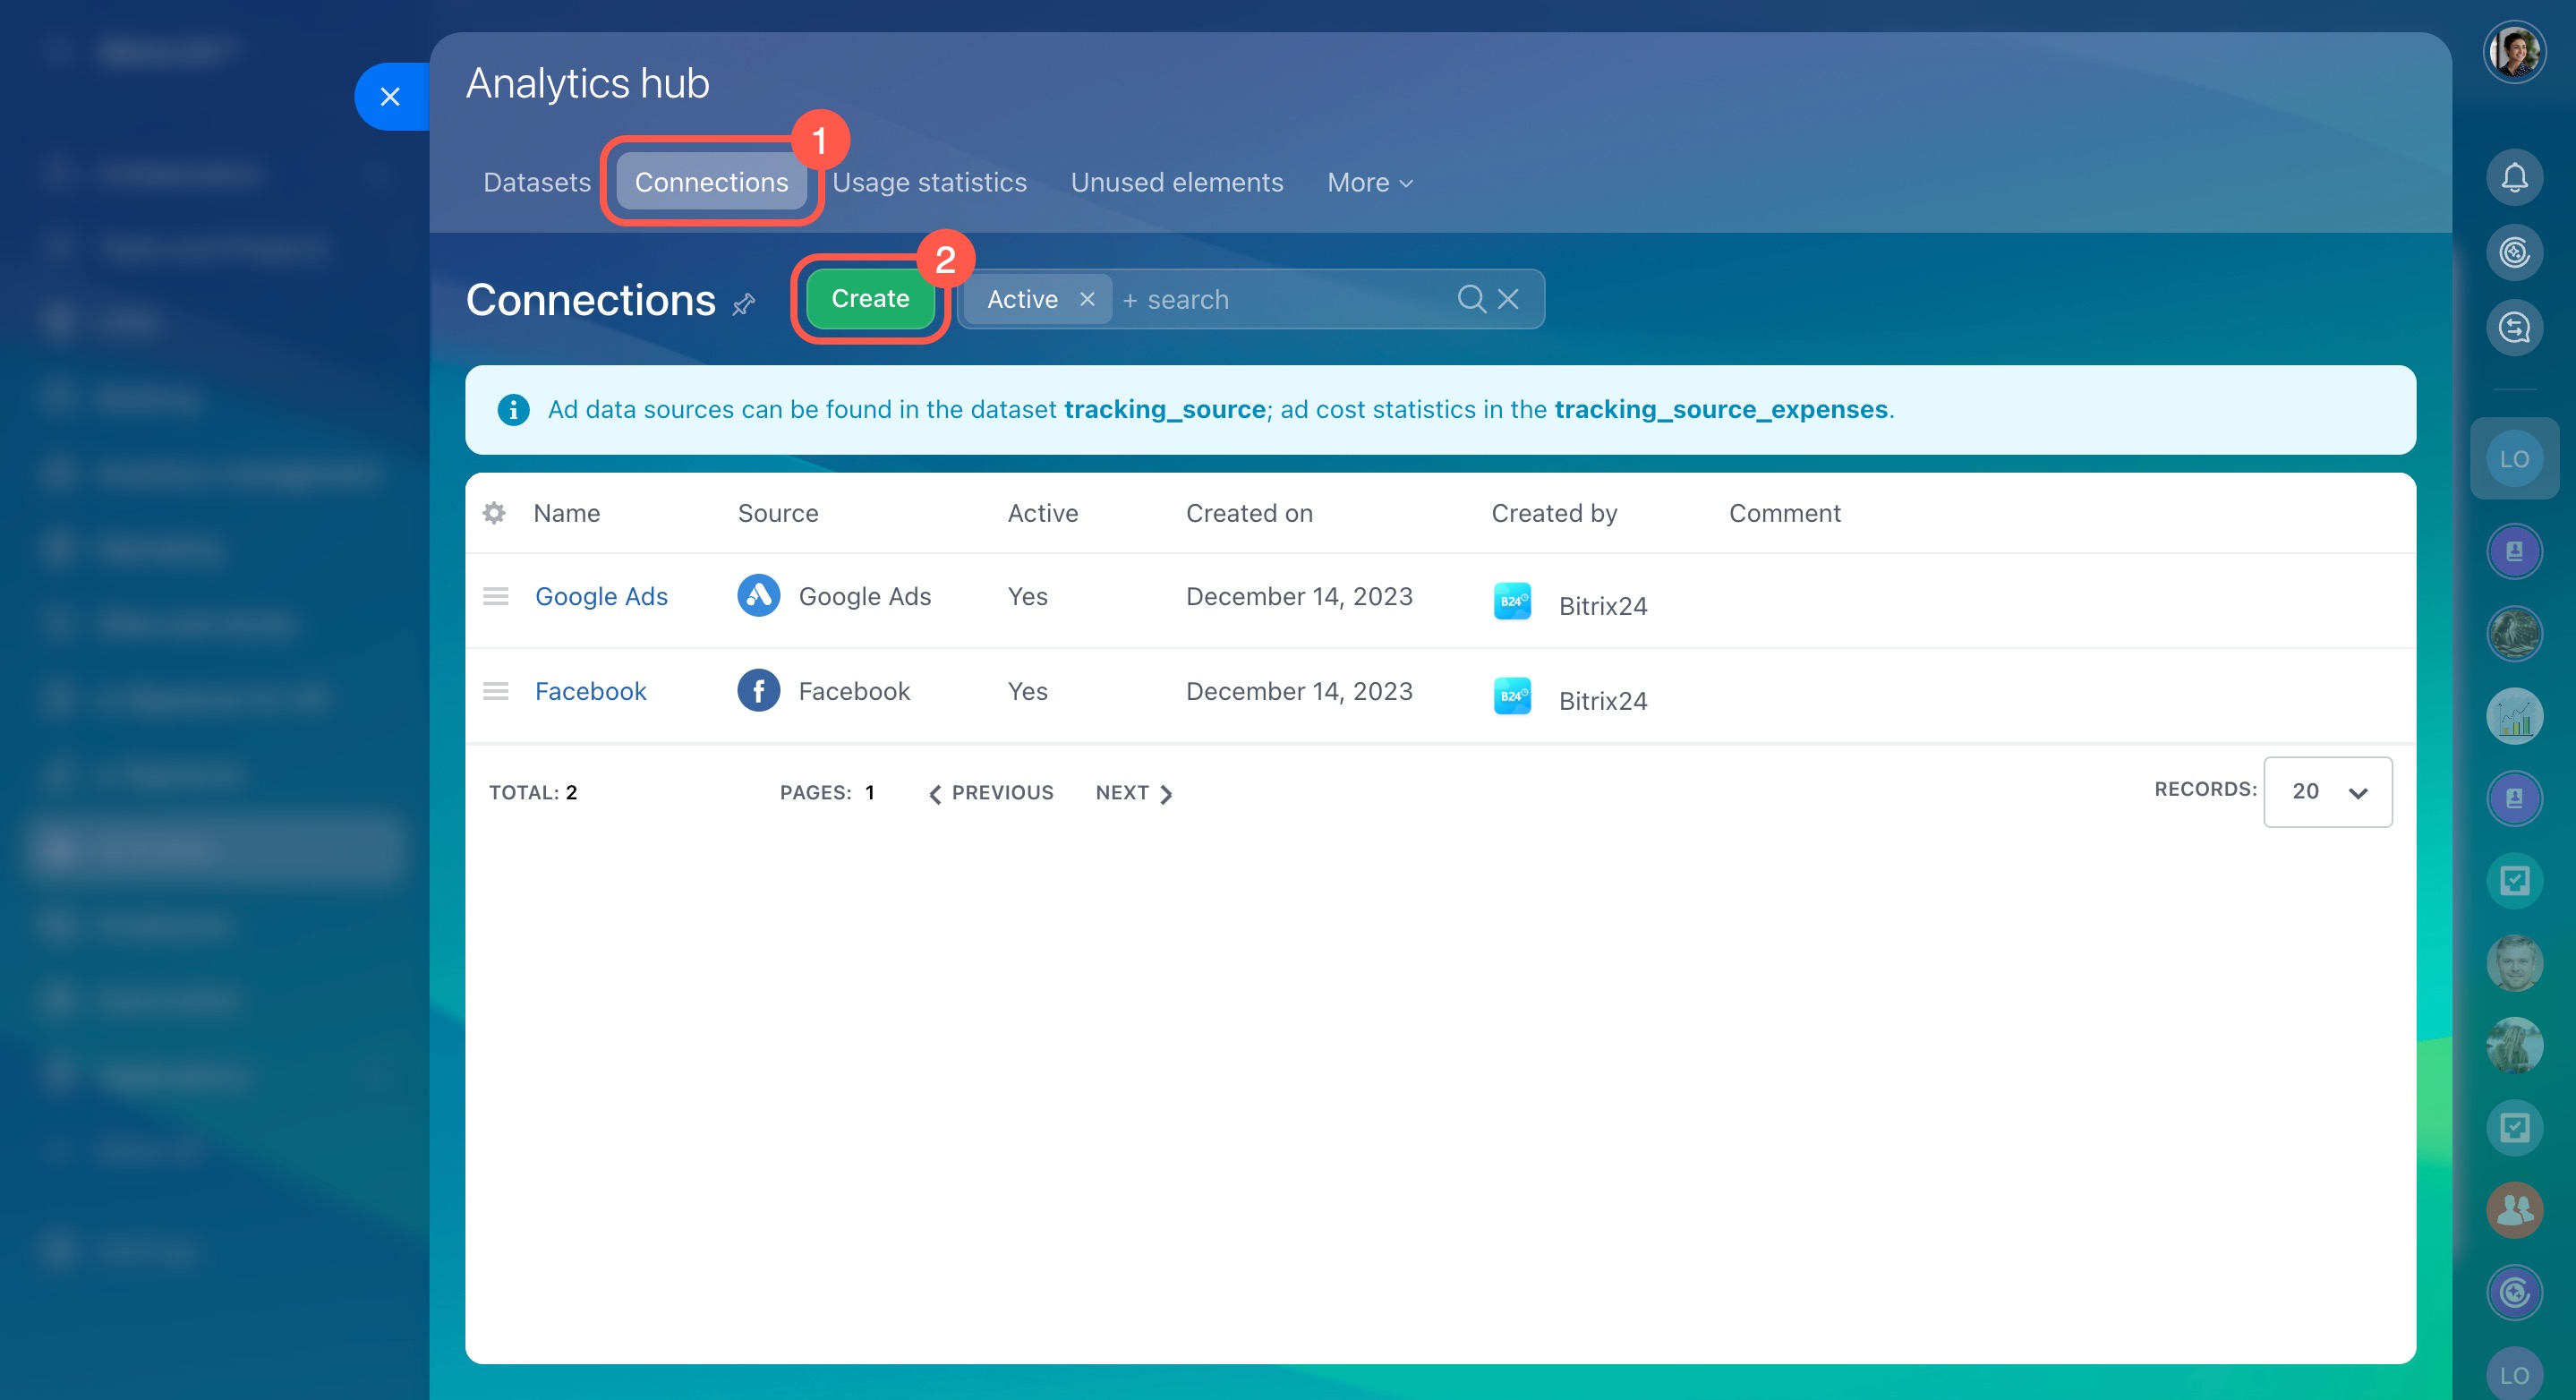
Connections: Manage active data sources, such as connected ad accounts, and configure their settings.
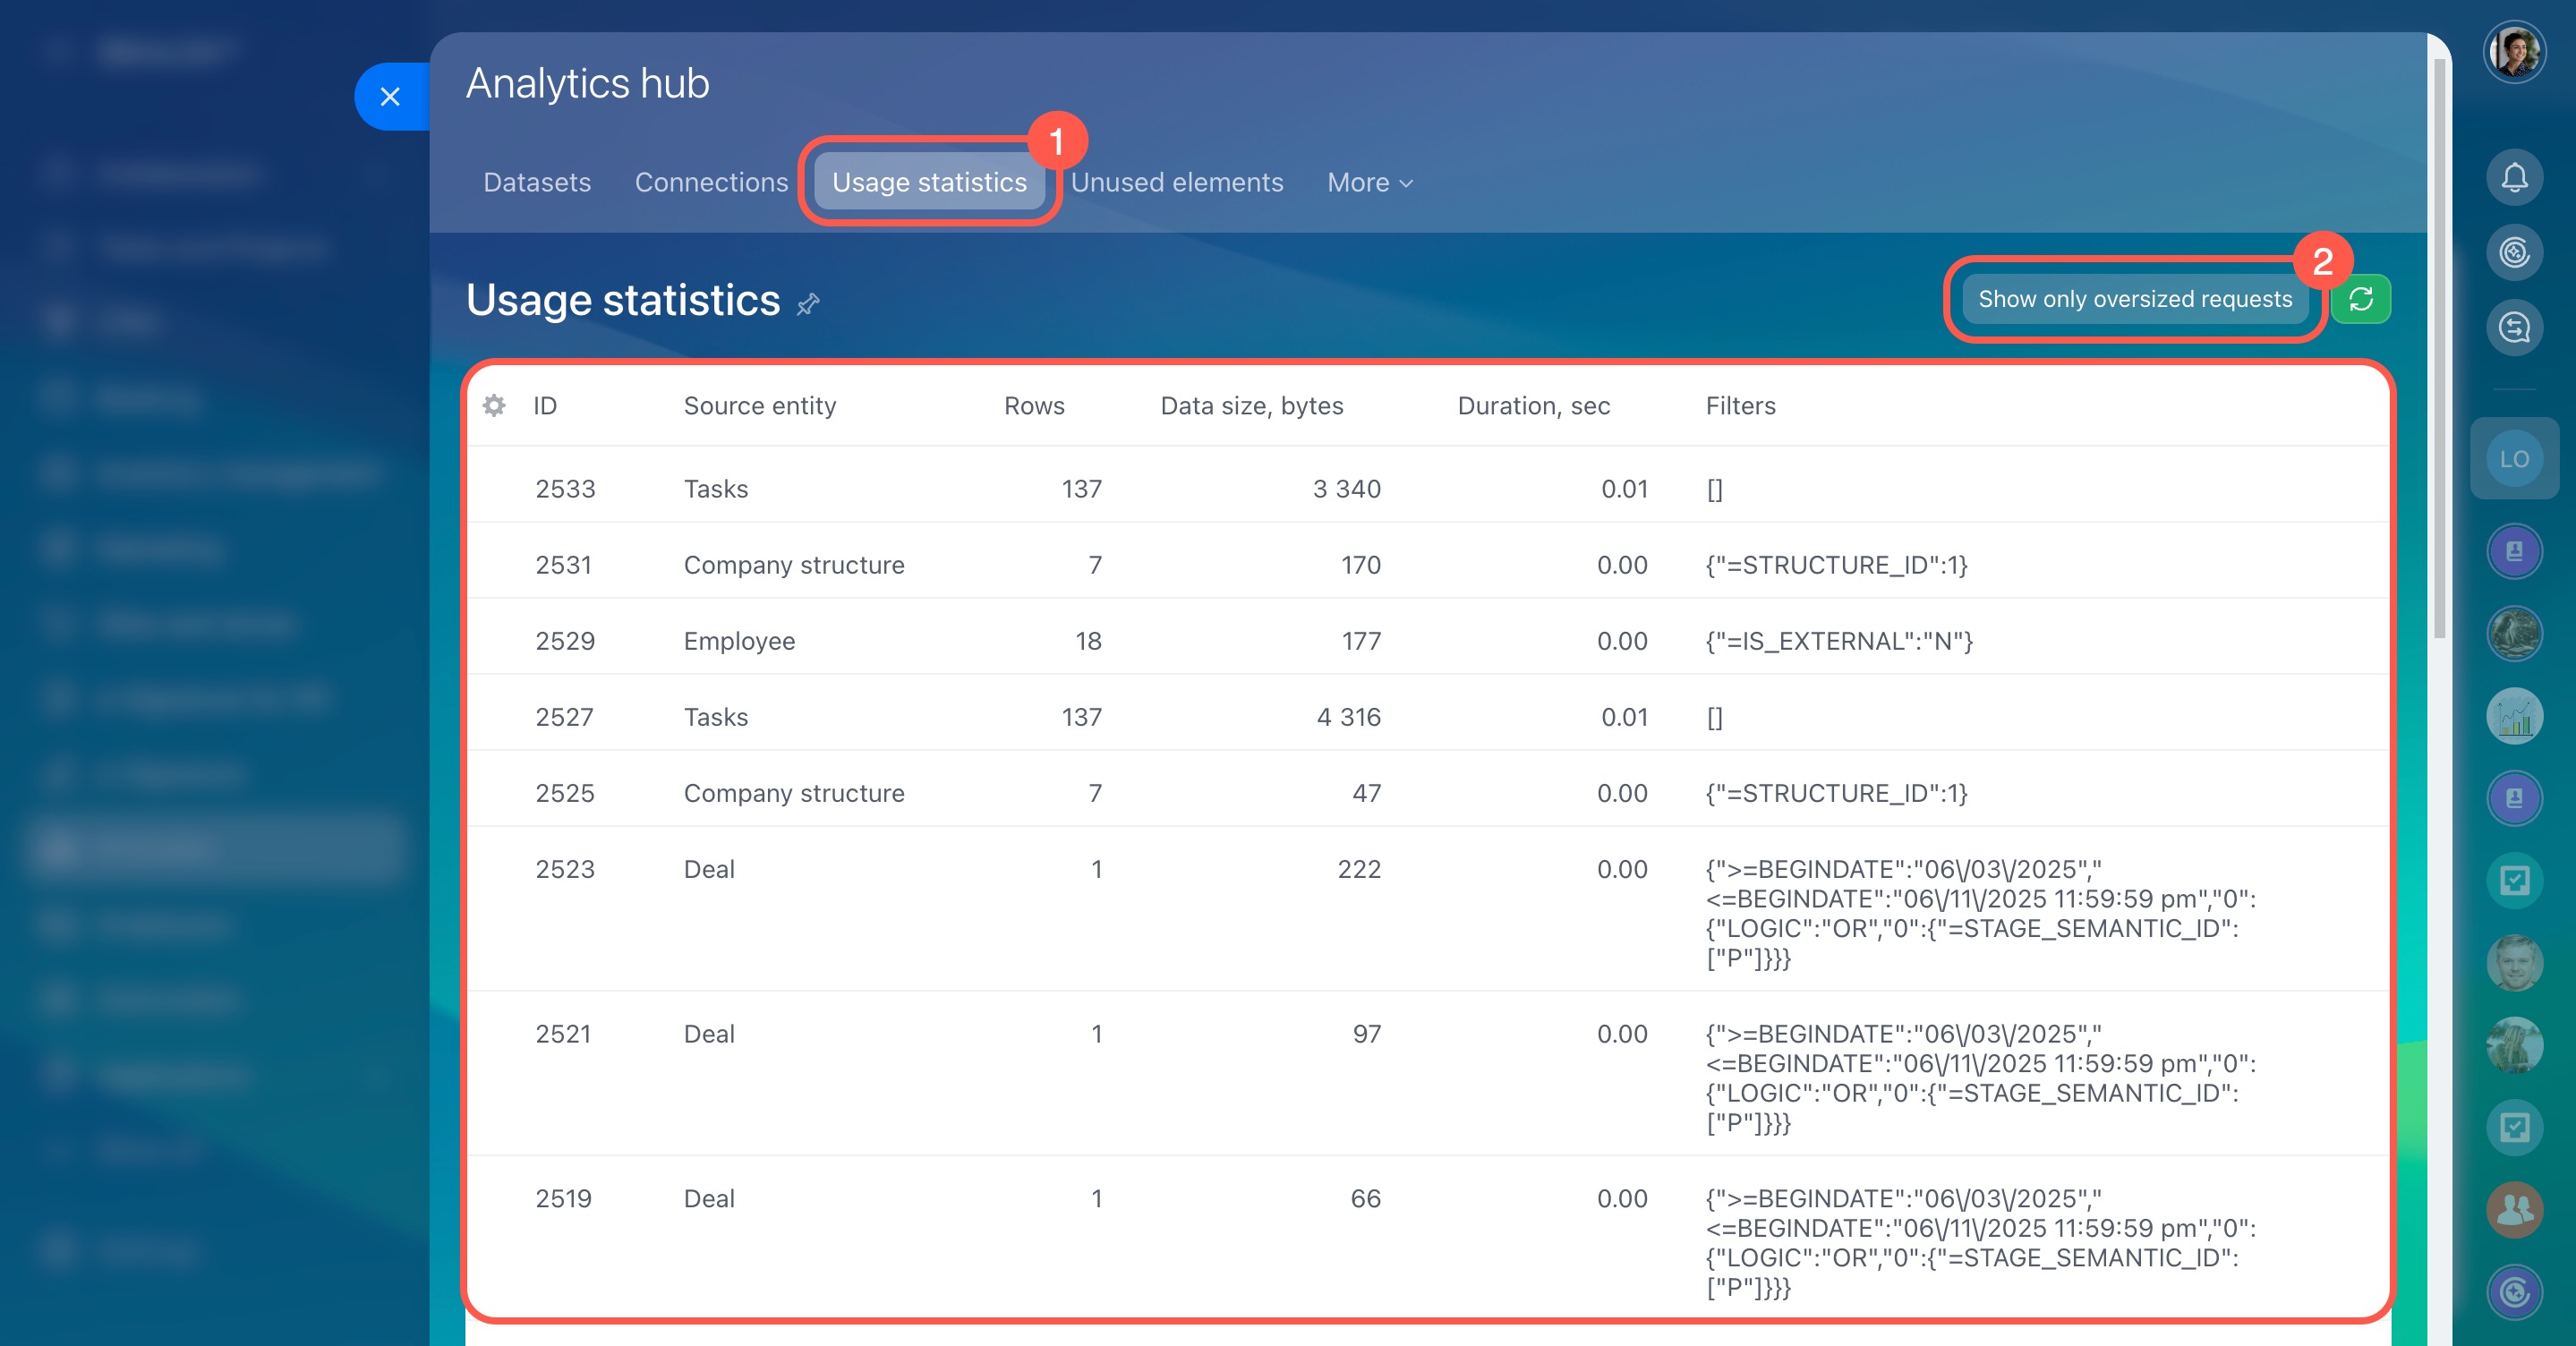
Usage statistics: Review how datasets are used in dashboards, track user activity, and monitor query loads to avoid exceeding limits.
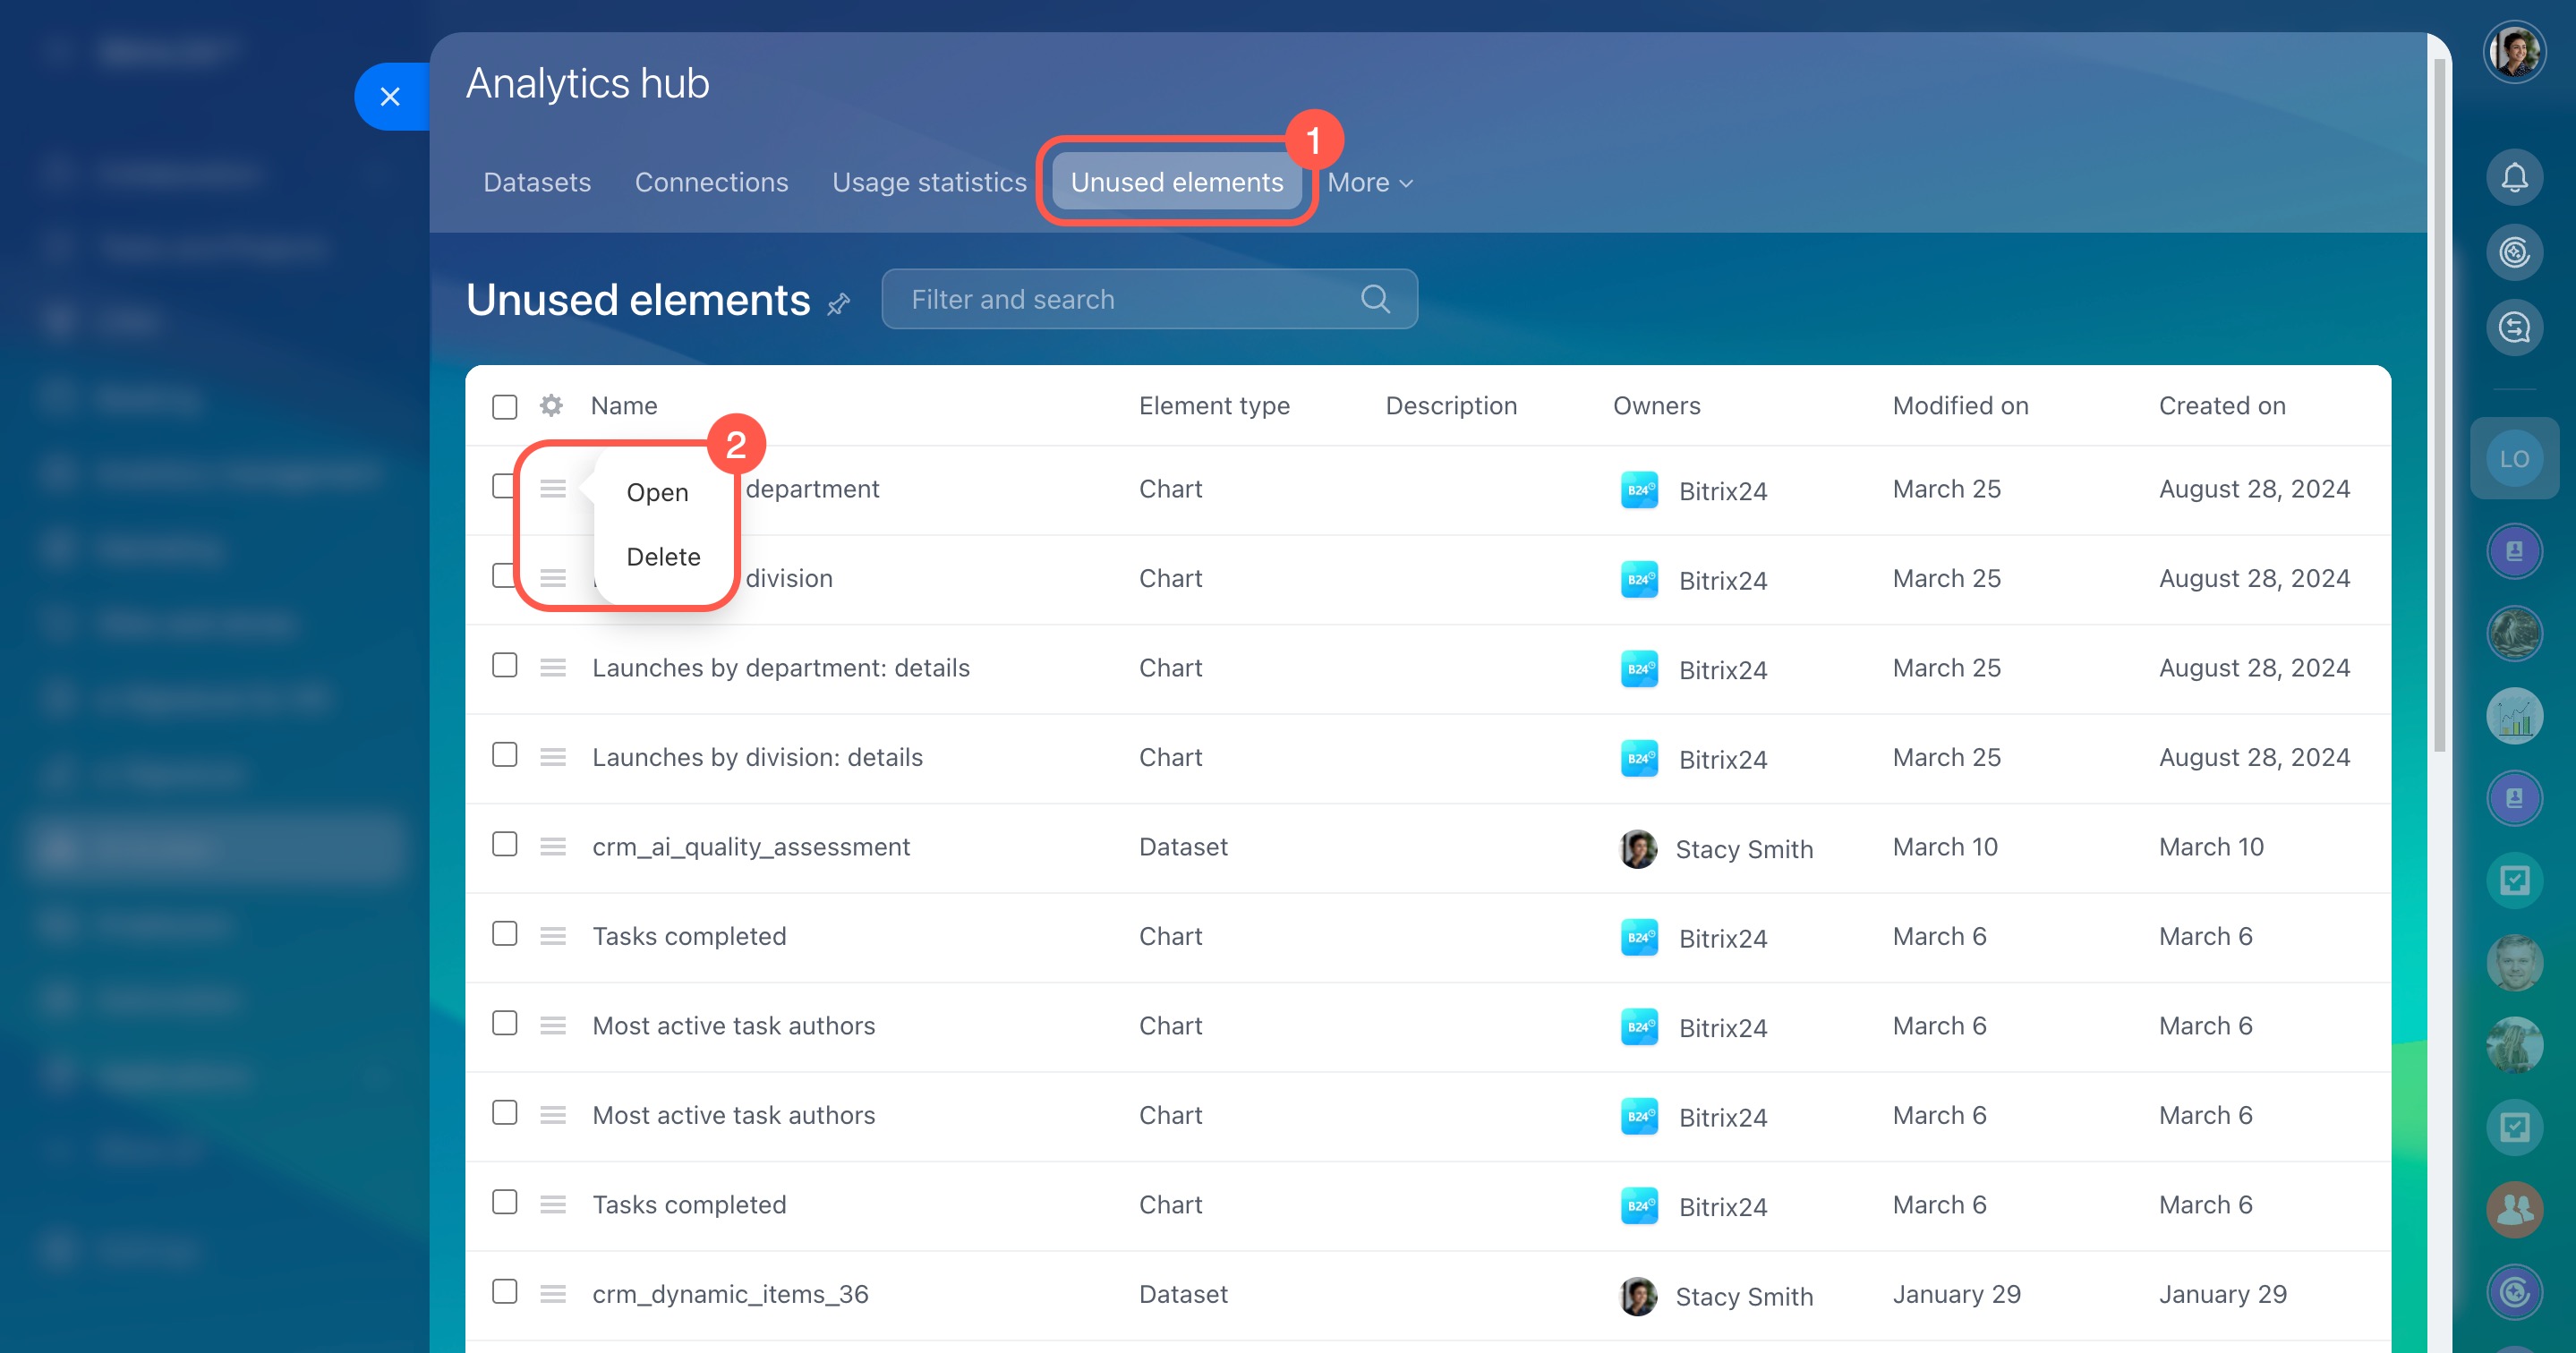
Unused elements: Identify and remove datasets and charts that are no longer in use to keep your workspace organized.
Import data from CSV files
To create a dataset from a CSV file, go to the Datasets section. If your data is stored in CSV files, you can upload it to BI Builder. For example, import a file with annual sales to analyze monthly trends, identify top-selling products, and evaluate revenue changes.
BI Builder: Create a dataset from a CSV file
Configure data formats and types for CSV file import
Connect ad accounts
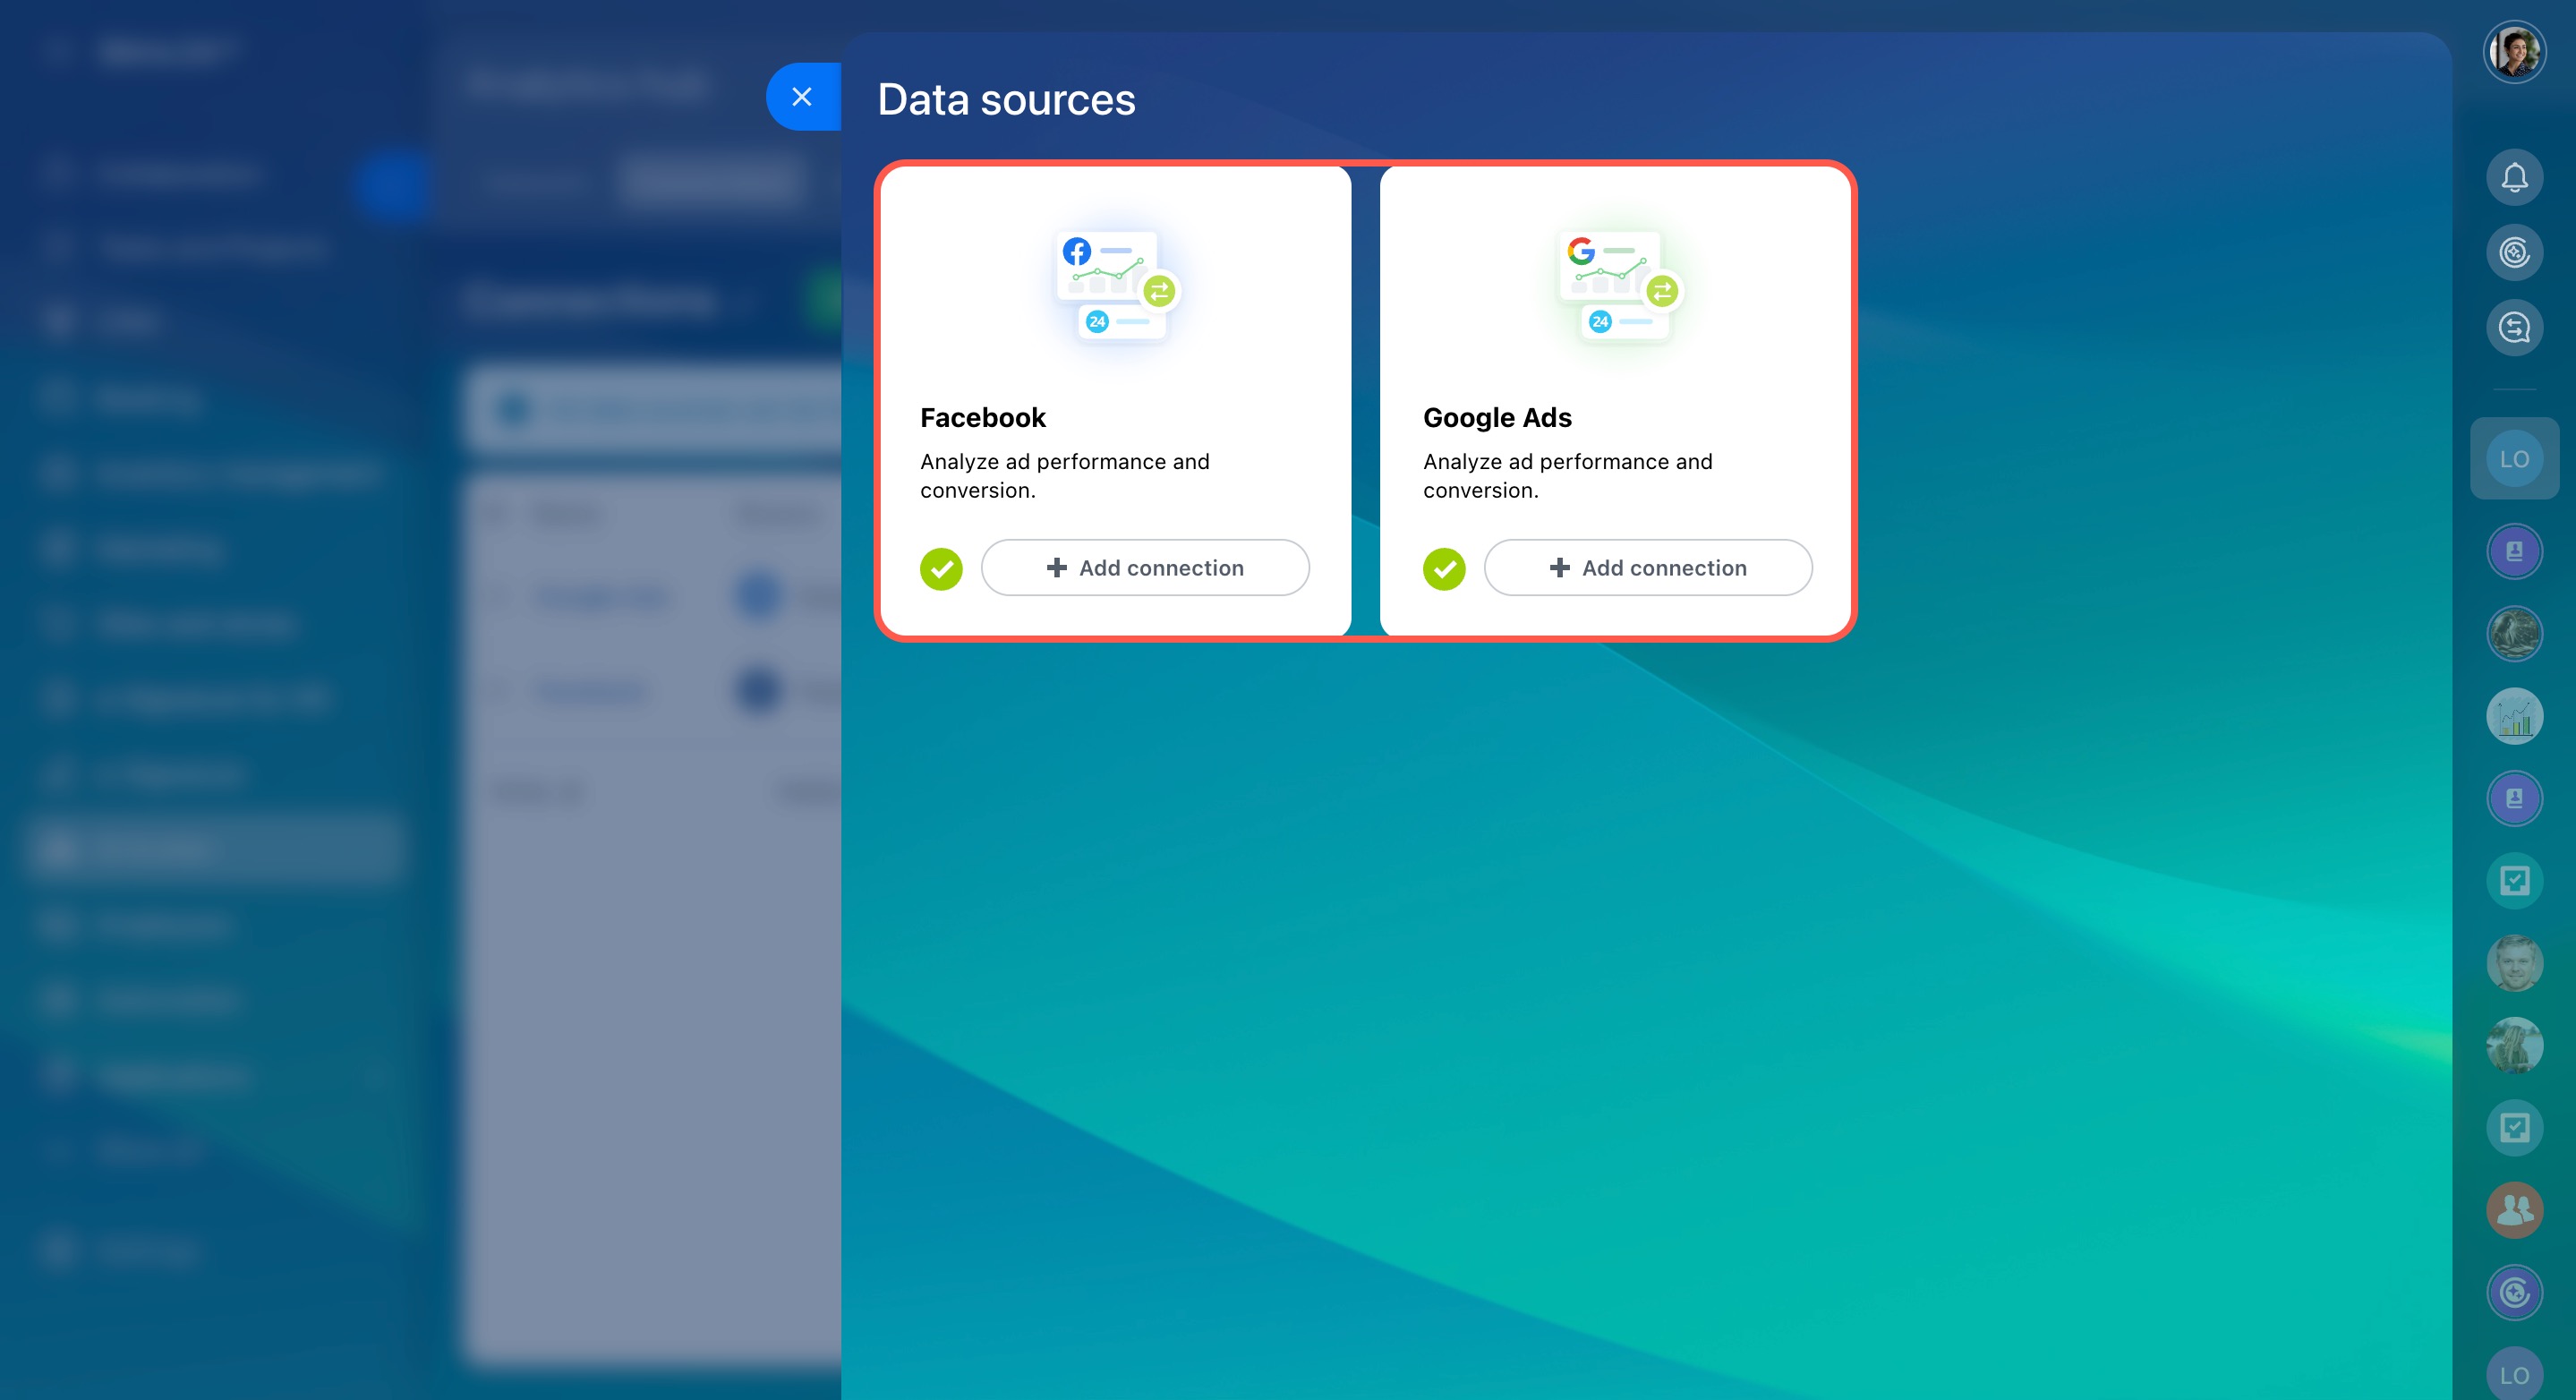
The Connections tab allows you to connect BI Builder to ad accounts like Facebook and Google Ads. Once connected, you can use data from these accounts in your datasets and dashboards.
For example, connect a Facebook account to track ad expenses and evaluate the effectiveness of your campaigns.
BI Builder: Get and use data from ad accounts
Check usage statistics
To view recent requests and possible limit exceedances, go to the Usage statistics tab. The table shows data for all sources, including the number of rows exported, data volume, and other metrics. To check only limit exceedances, click Show only oversized requests.
Find unused charts and datasets
In the Unused elements section, you can find charts and datasets no longer used in your dashboards. The table shows their names, types, and owners. To review an element, click Open. If it’s no longer needed, click Delete to keep things organized.
In brief
The Analytics hub in BI Builder simplifies working with external data sources.
Upload CSV files or connect ad accounts to access and analyze data.
Create datasets, design charts, monitor usage, and remove unused elements to maintain an organized workspace.

