The Regular clients report shows how many clients have made purchases from you during the selected reporting period.
To access this report:
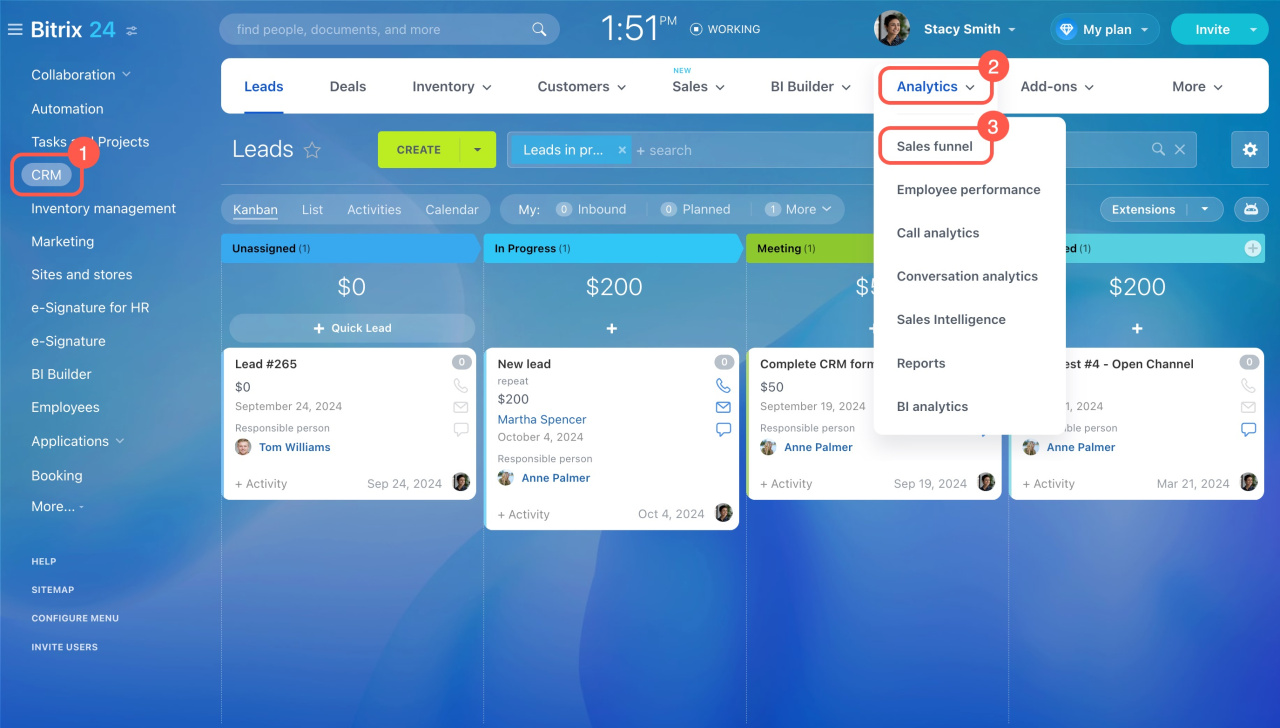
- Go to CRM.
- Expand Analytics.
- Select Sales funnel.
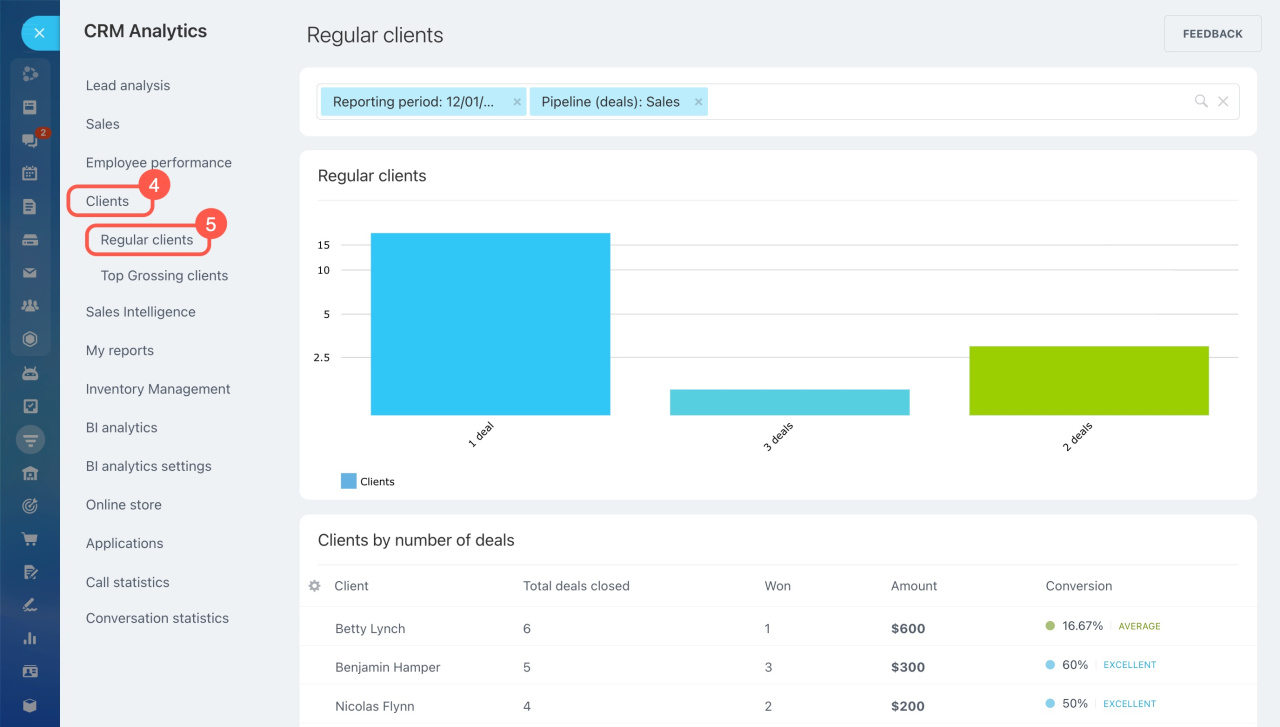
- Expand the Clients section.
- Select Regular clients.
The report columns are automatically generated and display the number of deals closed during the reporting period. You can also see how many clients have closed the same number of deals within this period.
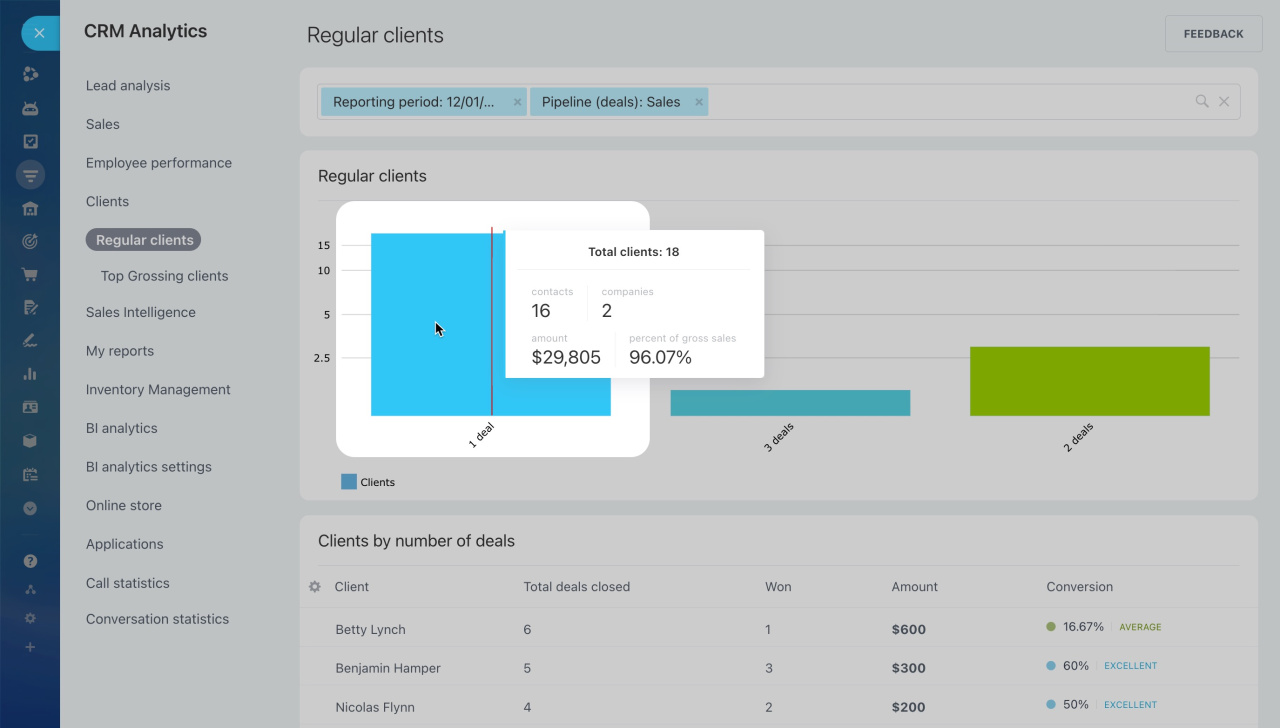
Hover over a column to see its statistics:
- Contacts: Number of contacts with successful deals.
- Companies: Number of companies with successful deals.
- Amount: Total amount of won deals in this group of clients.
- Percent of gross sales: Percentage of total won deals amount represented by this client group.
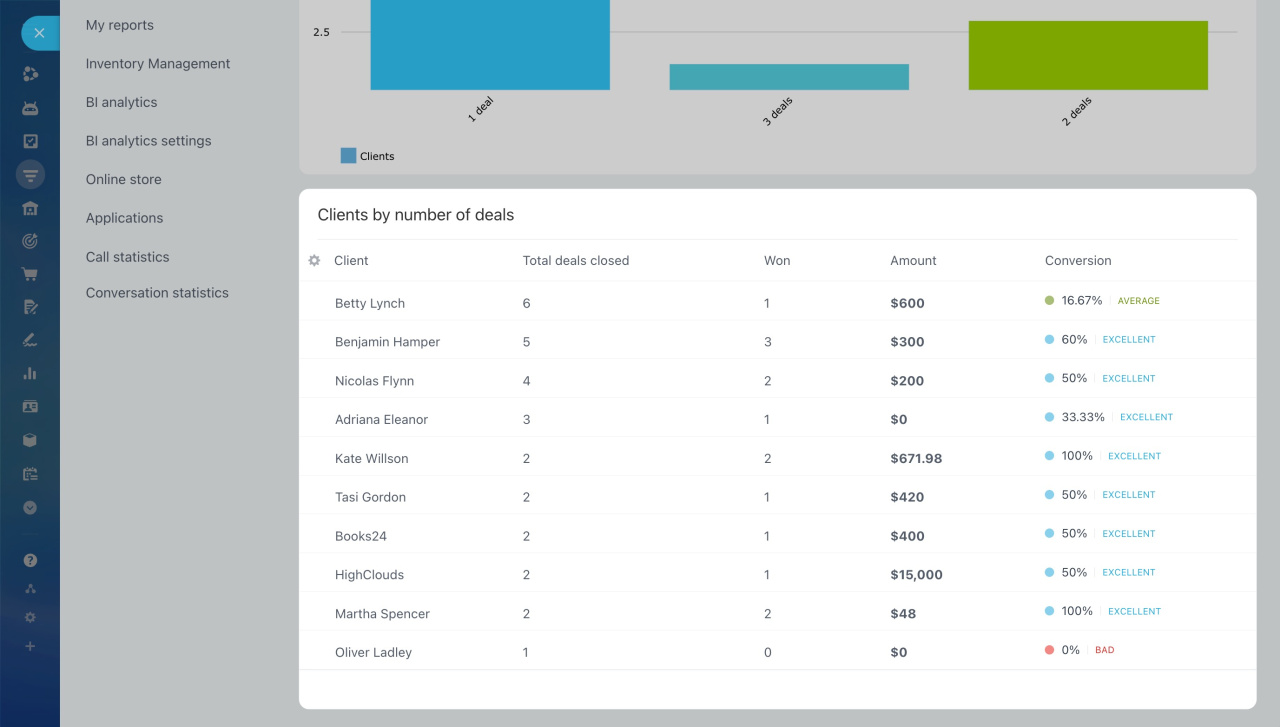
The Clients by number of deals table shows contacts and companies, the total number of deals, the total number of won deals, the total amount of won deals, and the conversion rate (percentage of won deals out of total deals).
Data in the report is filtered by the selected reporting period, and you can filter by other fields if needed.


