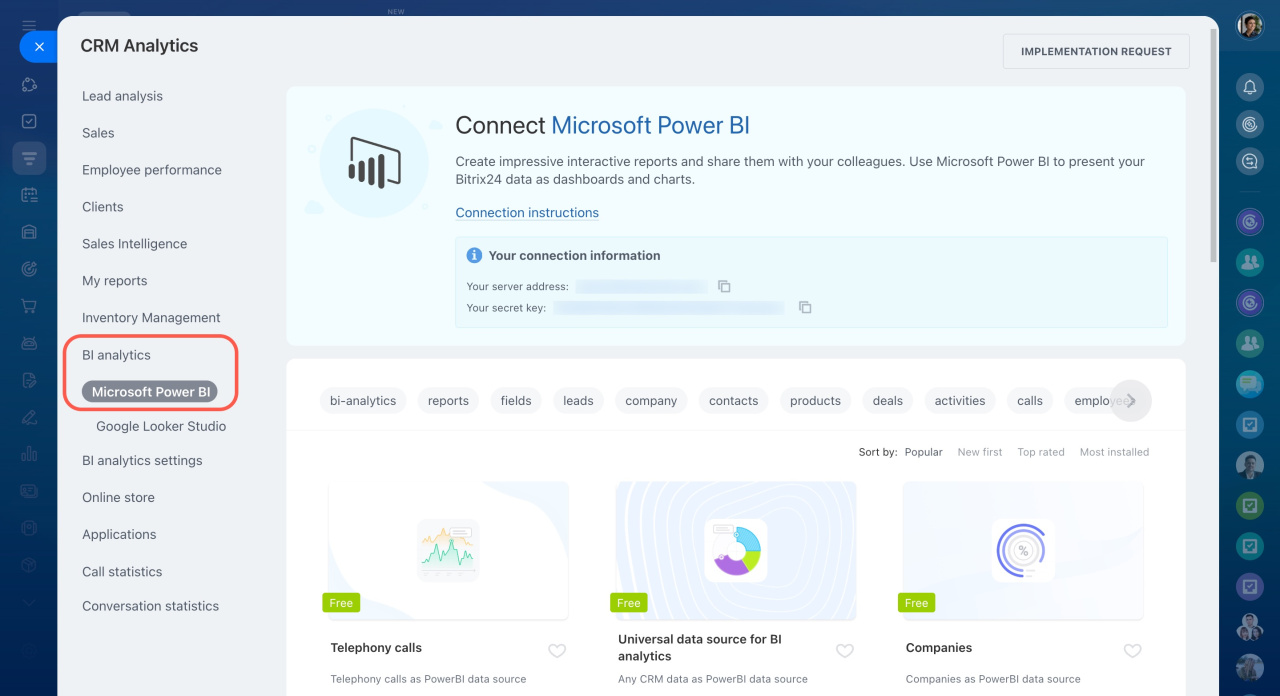
BI analytics is a tool for detailed analysis of data stored in your Bitrix24 account. Connect Google Looker Studio or Microsoft Power BI to create reports of any complexity to track important business indicators.
Report data limits
BI analytics is not available on the Free plan.
When data is uploaded to an external BI system, the maximum number of rows depends on your Bitrix24 plan.
Bitrix24 plan comparison: Report row limit
To reduce the number of uploaded rows, select a shorter reporting period, such as data for the last 3 months instead of the full history.
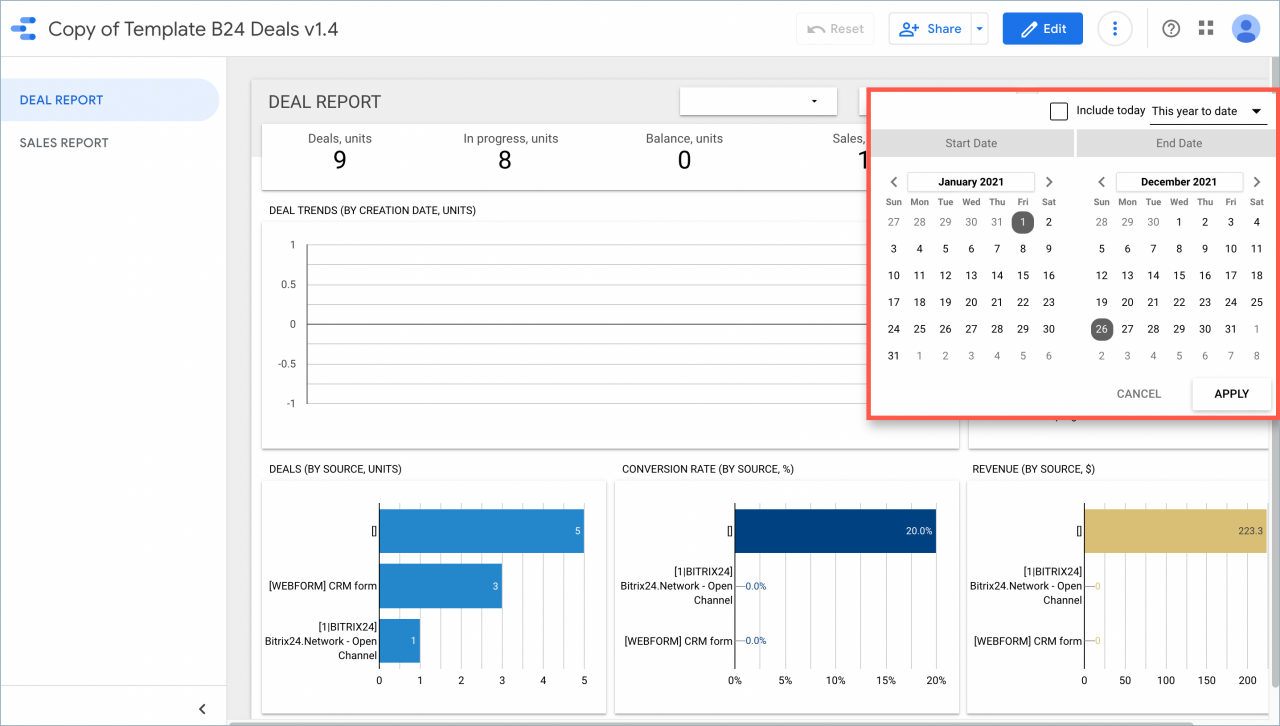
In Google Looker Studio.
- Open the report.
- Set the required date range before adding it to Bitrix24.
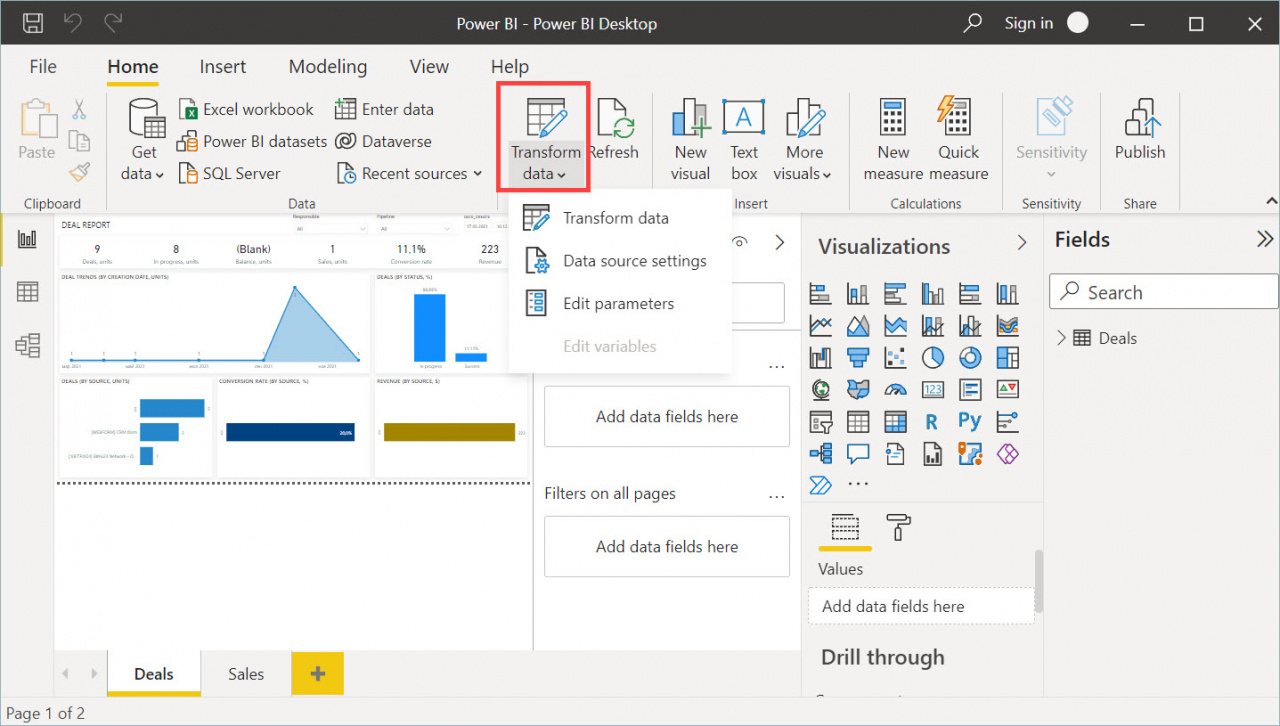
In Microsoft Power BI.
- Open the desktop application.
- Go to the Transform data tab.
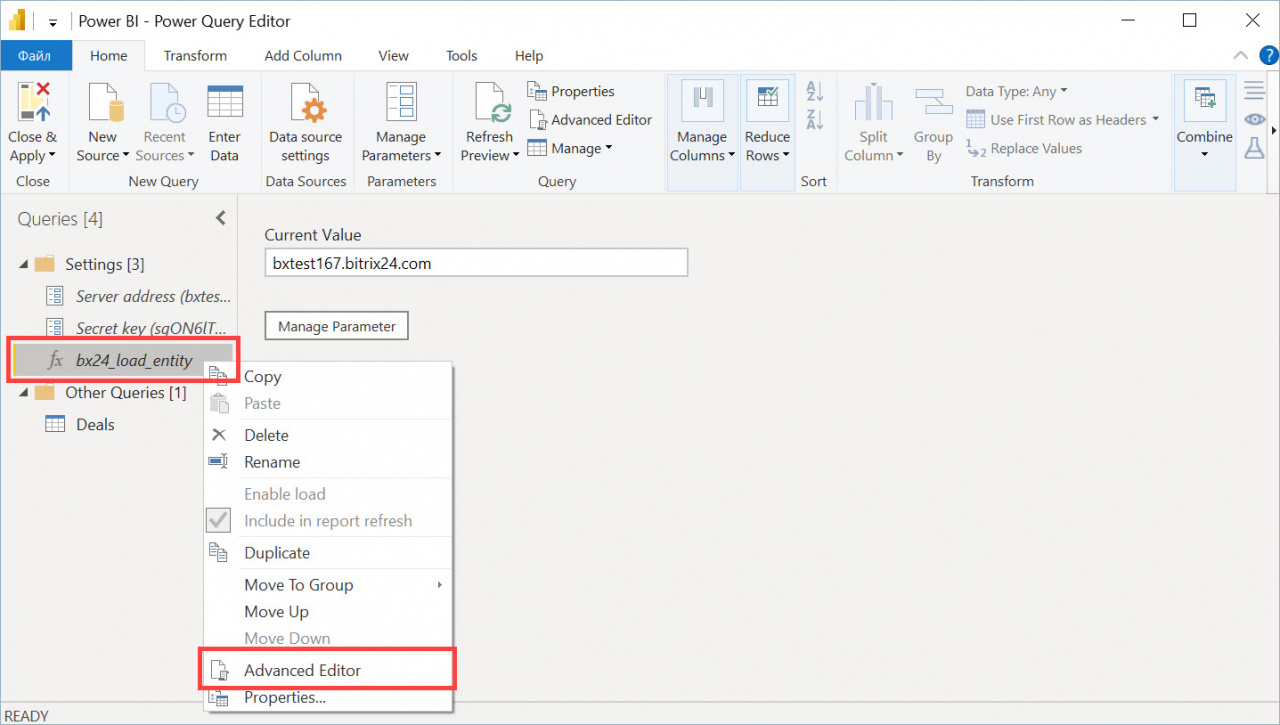
- Right-click bx24_load_entity and select Advanced Editor.
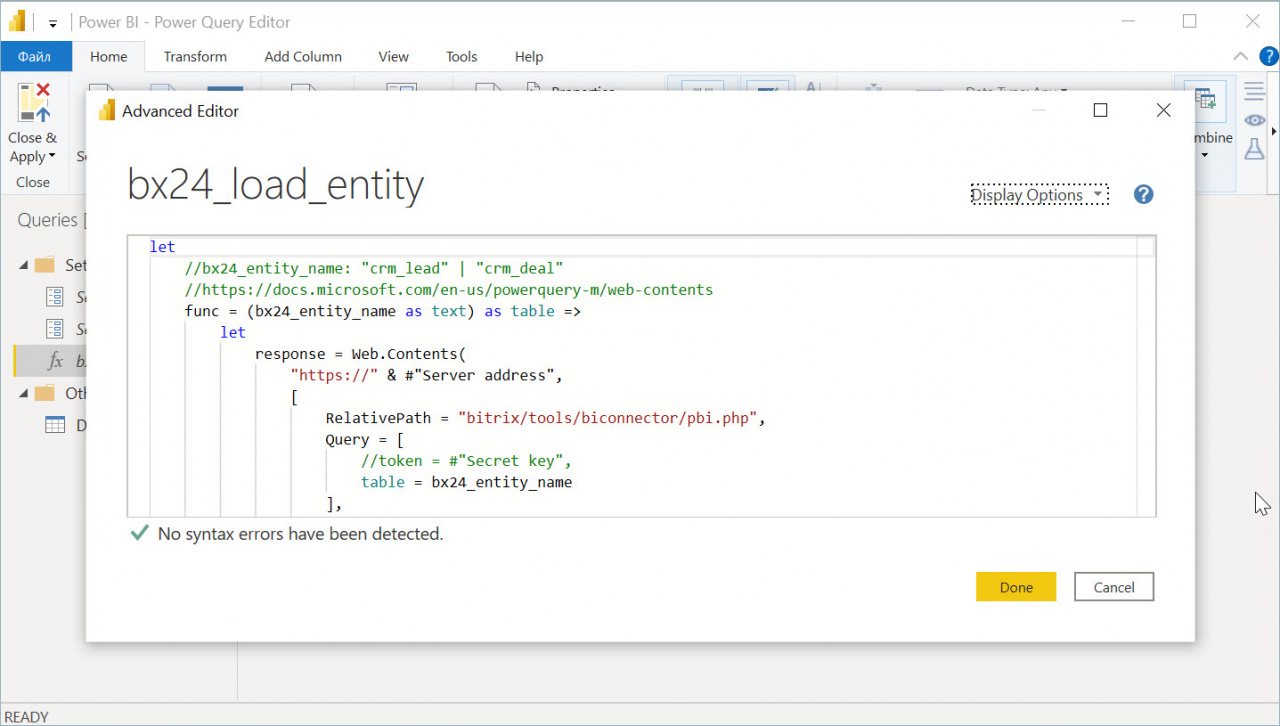
- In the editor window, set the reporting period.
Learn more: Bitrix24 BI Connector limits
Connecting analytical system
Connect Google Looker Studio or Microsoft Power BI to create reports, view them inside Bitrix24, and share them with your team.
Google Looker Studio.
- Sign in with your Google account (or create a new one).
- Connect Google Looker Studio to your Bitrix24 account.
- Create a report with the Bitrix24 BI-connector data source.
- View and share the report in your Bitrix24 account.
Microsoft Power BI.
- Install the free Microsoft Power BI Desktop app.
- Install a report template in Bitrix24.
- Connect Power BI to your Bitrix24 account.
- Publish the report to the cloud and copy the link.
- Add the report to Bitrix24 and share it with your team.
In brief
-
BI analytics helps you turn Bitrix24 data into clear, actionable reports using Google Looker Studio or Microsoft Power BI.
-
The number of rows you can export depends on your plan. To stay within limits, select a shorter reporting period when exporting data.


