In Google Looker Studio you can create a report that combines the data from both deals and their stage history. This will help you to control how well your employees work with the deals.
Also, you can track how many stages the deals actually went through, the date of the last activity, or how many days they were in progress.
How to add deals and stage history to a table
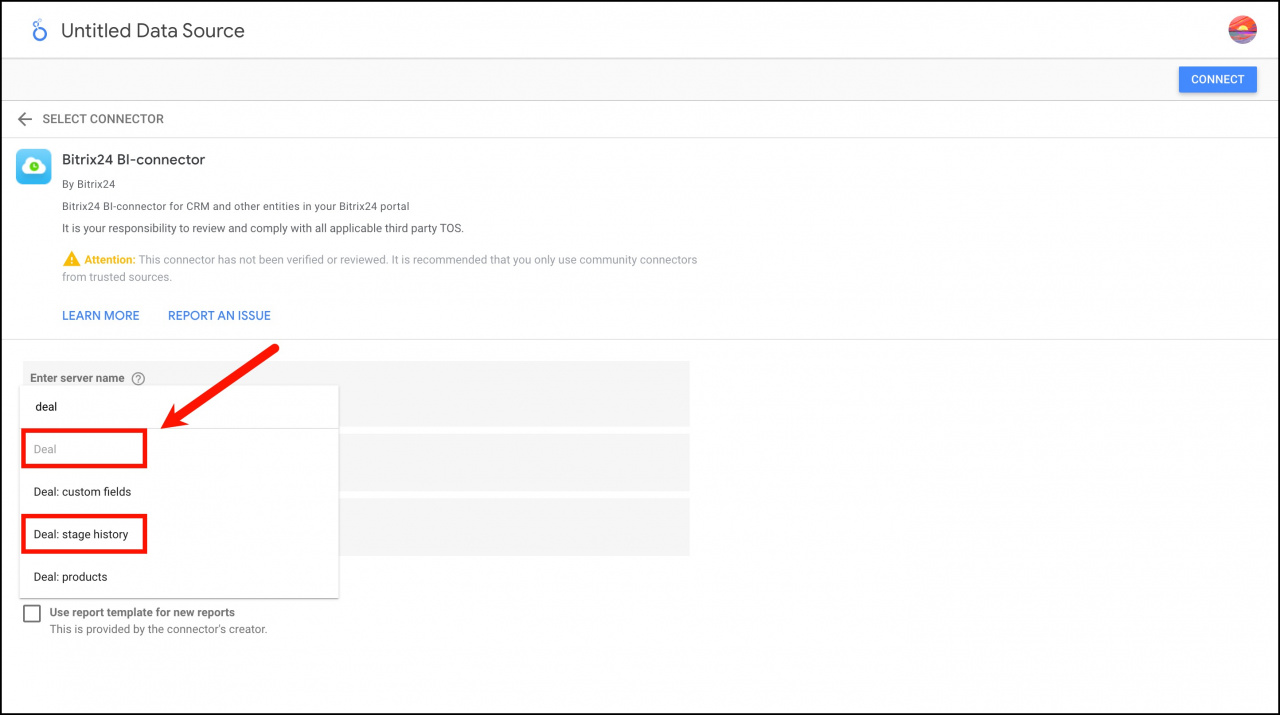
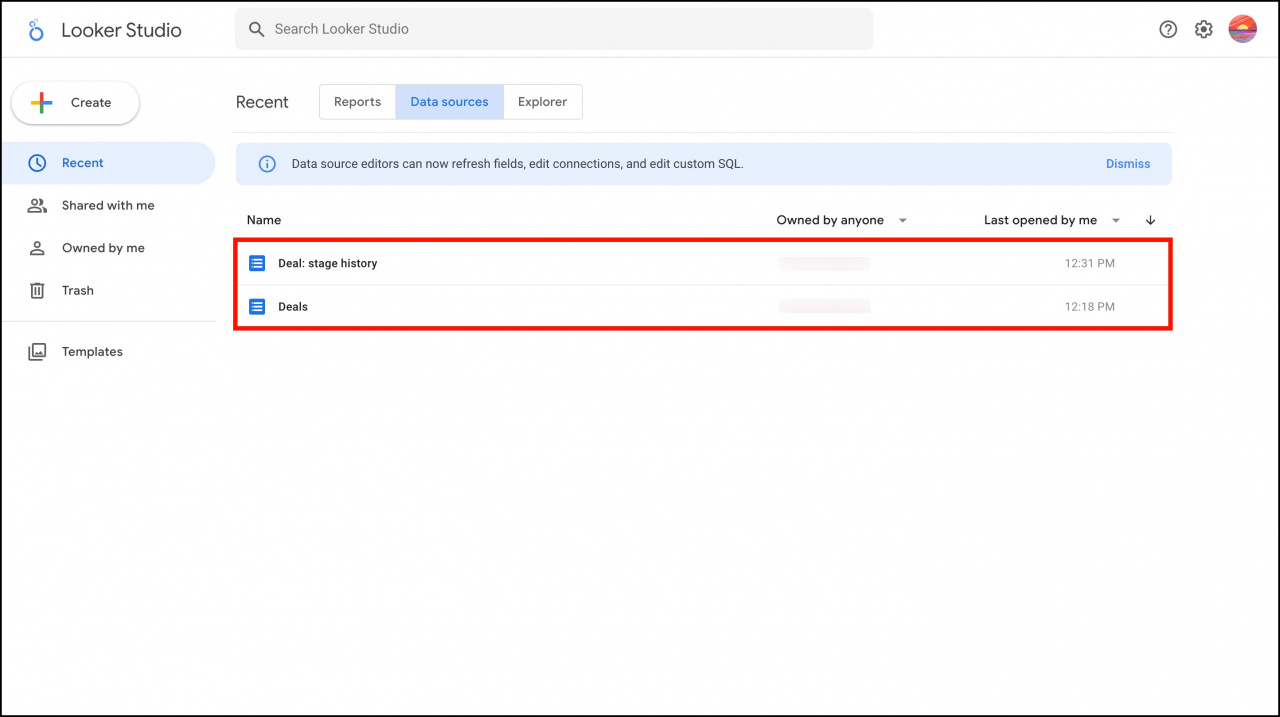
First, select the corresponding entities and create data sources in Google Looker Studio.
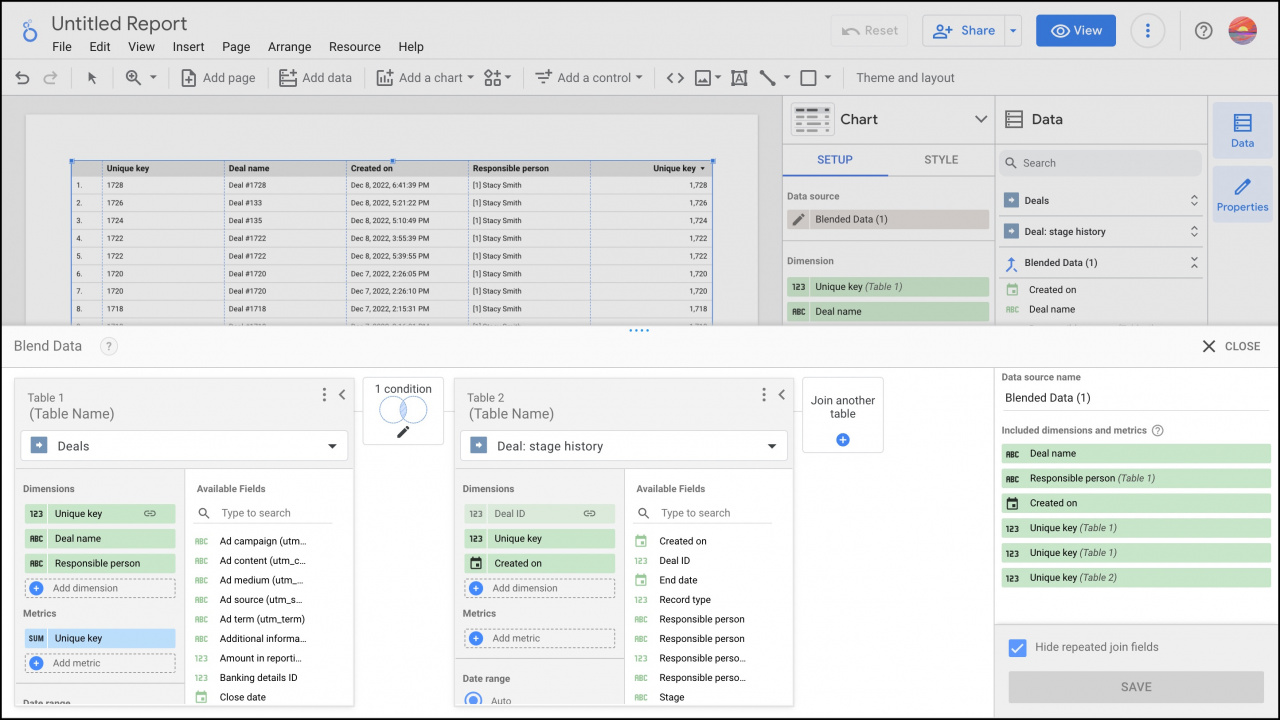
Then create a table and blend data from different sources.
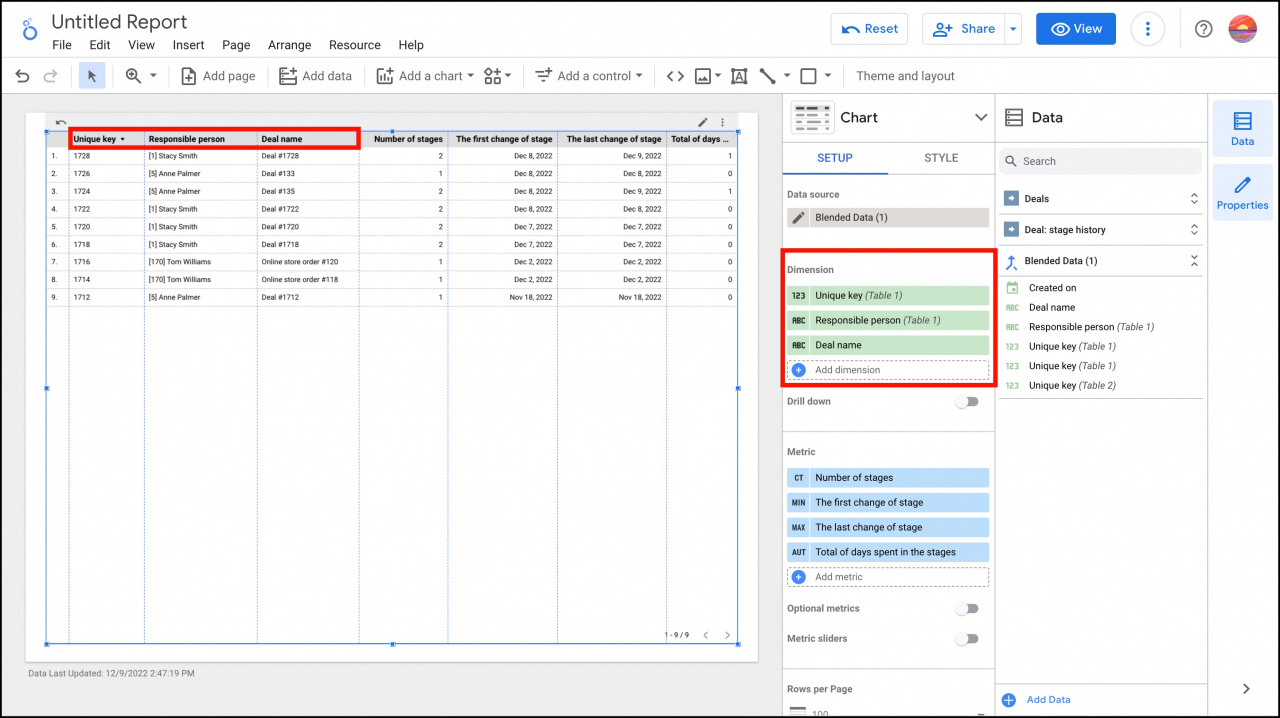
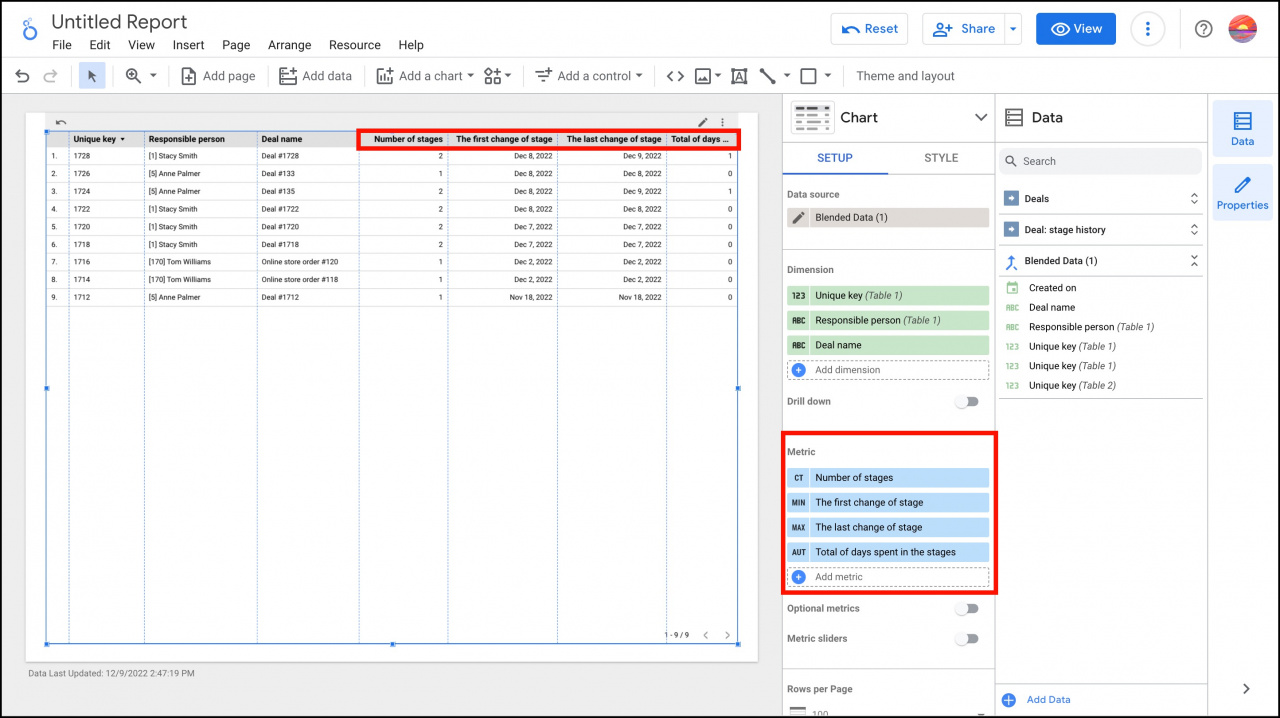
In our example, we used the following dimensions in the table:
- Unique key - ID number of the deal.
- Responsible person - name of the responsible person.
- Deal name - name of the deal.
Also, we manually added these metrics to see how many stages the deals went through and how many days they were in progress:
- Number of stages - shows the number of times the deal was moved to another stage. It is calculated from the Unique key from stage history (Table 2).
- The first change of stage - shows the date when the deal was moved to another stage for the first time. It is calculated using the formula
DATE(MIN(Created on)). Created on field comes from the stage history and shows date and time when a deal appears in a specific stage. - The last change of stage - shows the date when the deal was moved to another stage for the last time. It is calculated using the formula
DATE(MAX(Created on)). - Total of days spent in the stages - shows the difference between the first and the last change of stage as a number of days. It is calculated using the formula
UNIX_DATE(MAX(Created on)) - UNIX_DATE(MIN(Created on)).
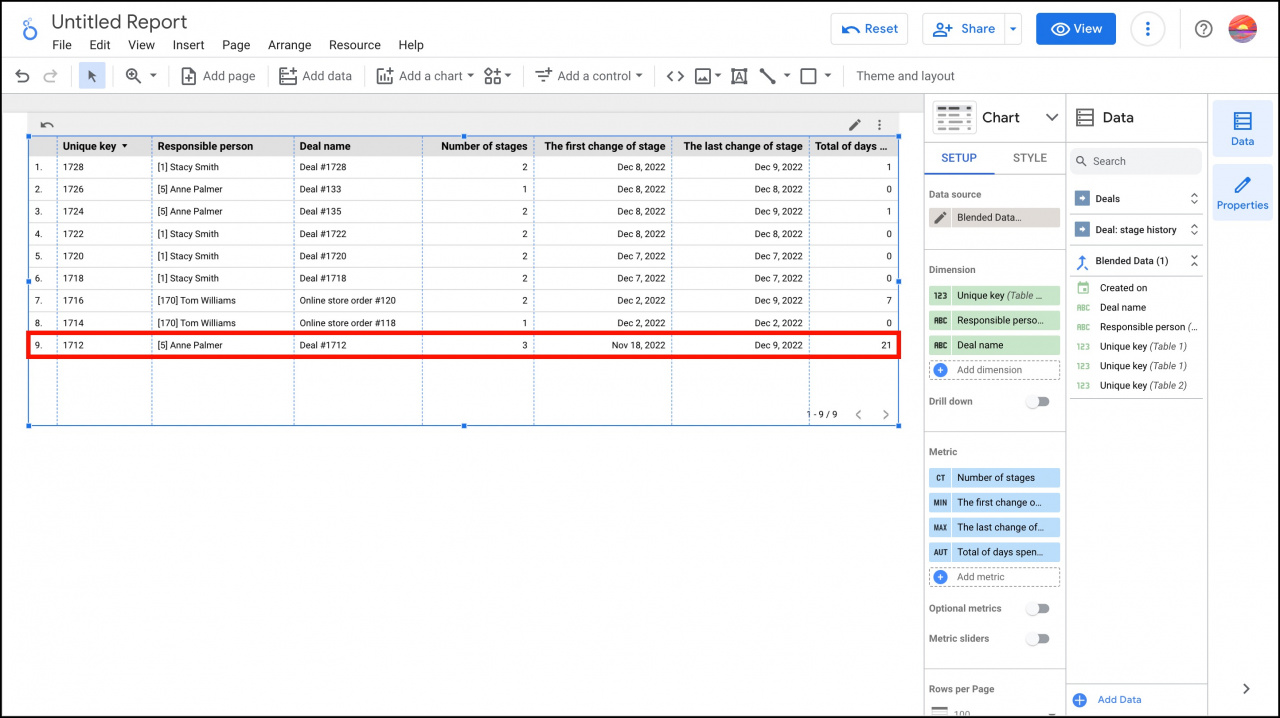
In this table you can see that the Deal #1712 was in progress for 21 days and went through 3 different stages. Hence, we conclude that there was a significant delay in processing this deal.

