Track paid and pending invoices’ ratio, visualize the company’s debts and payments using analytical invoices reports.
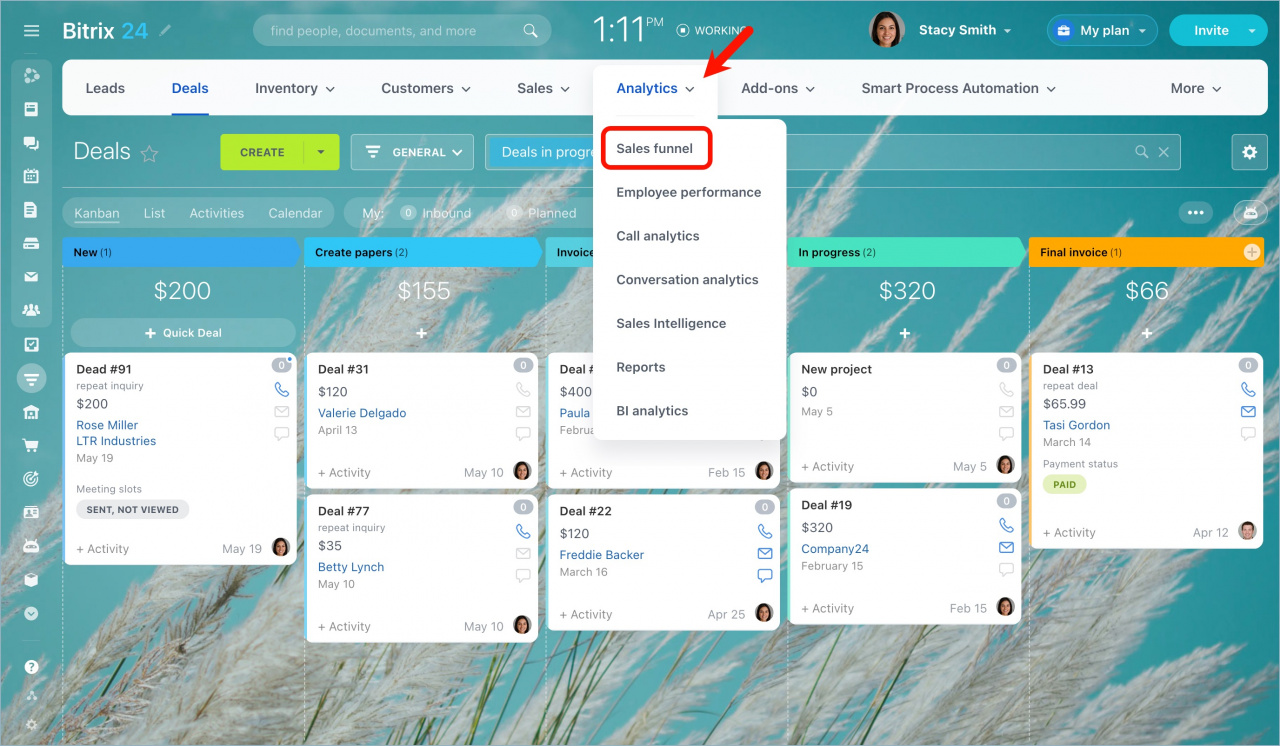
Go to CRM > Analytics > Sales funnel.
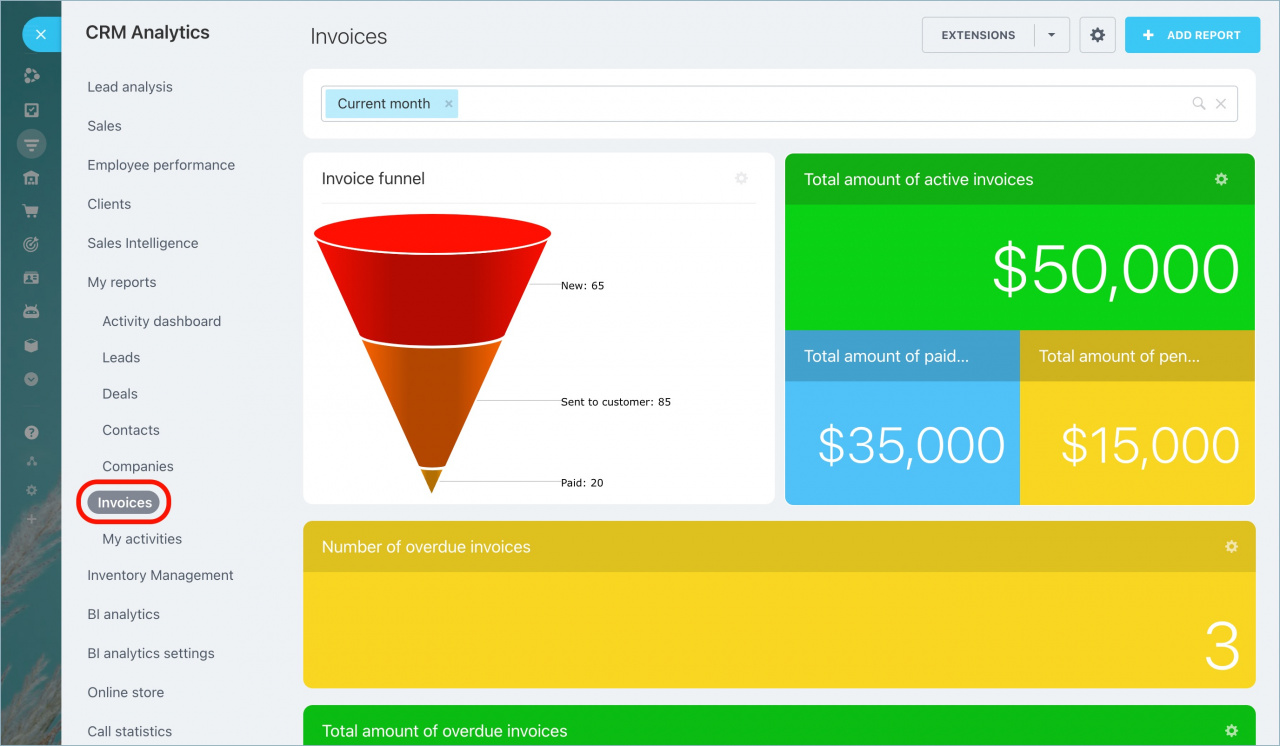
Expand My reports section and select Invoices.
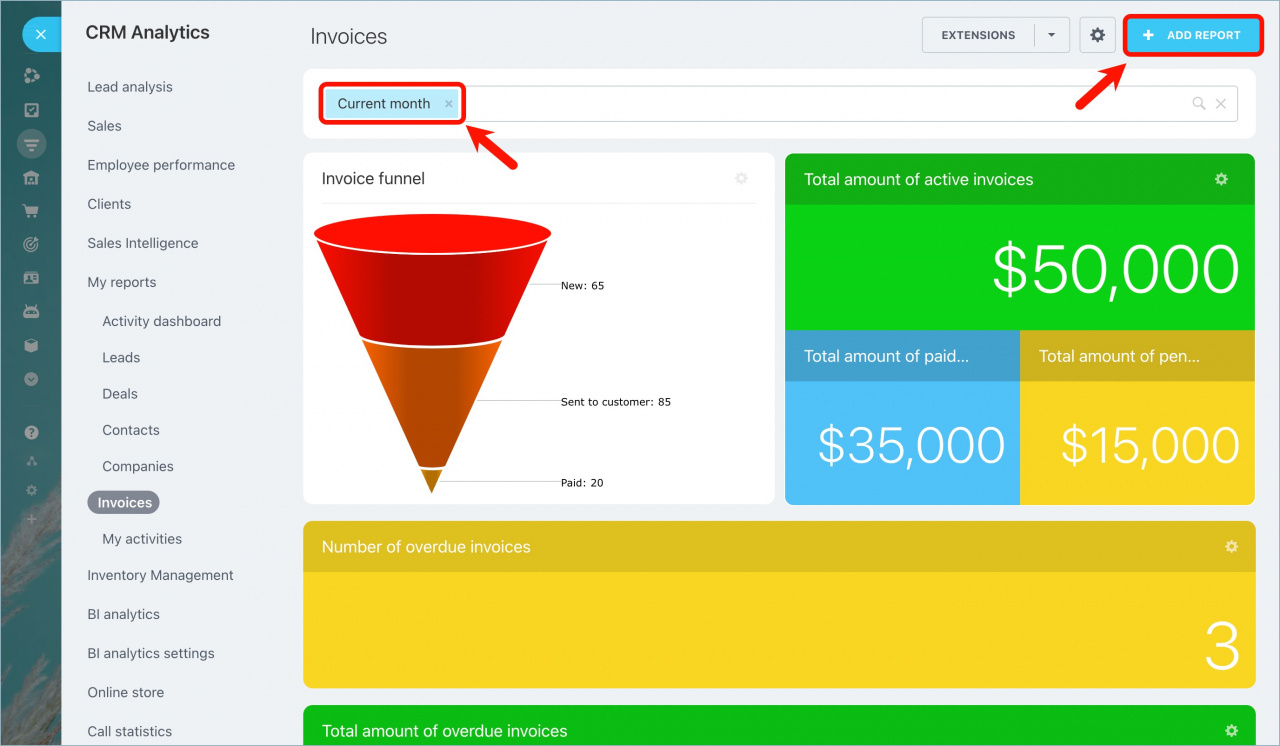
Use filters to change the reporting period. Click the Add report button to add a new report.
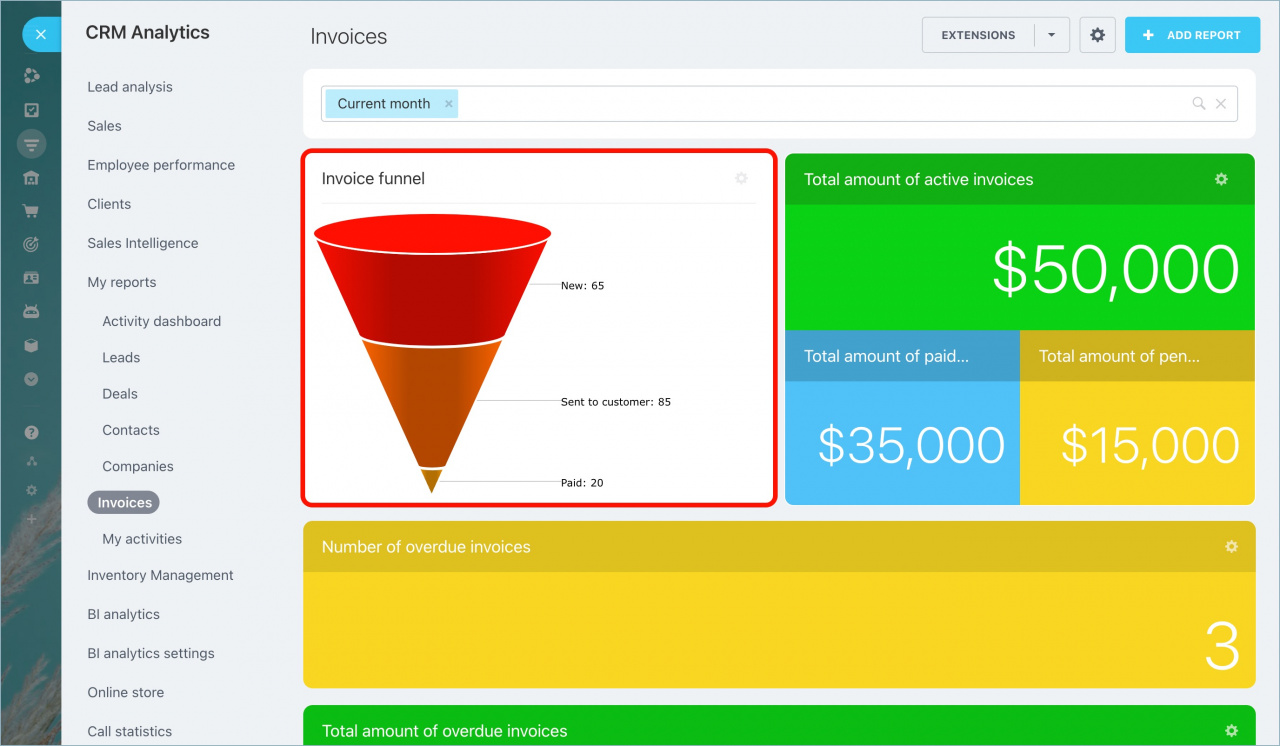
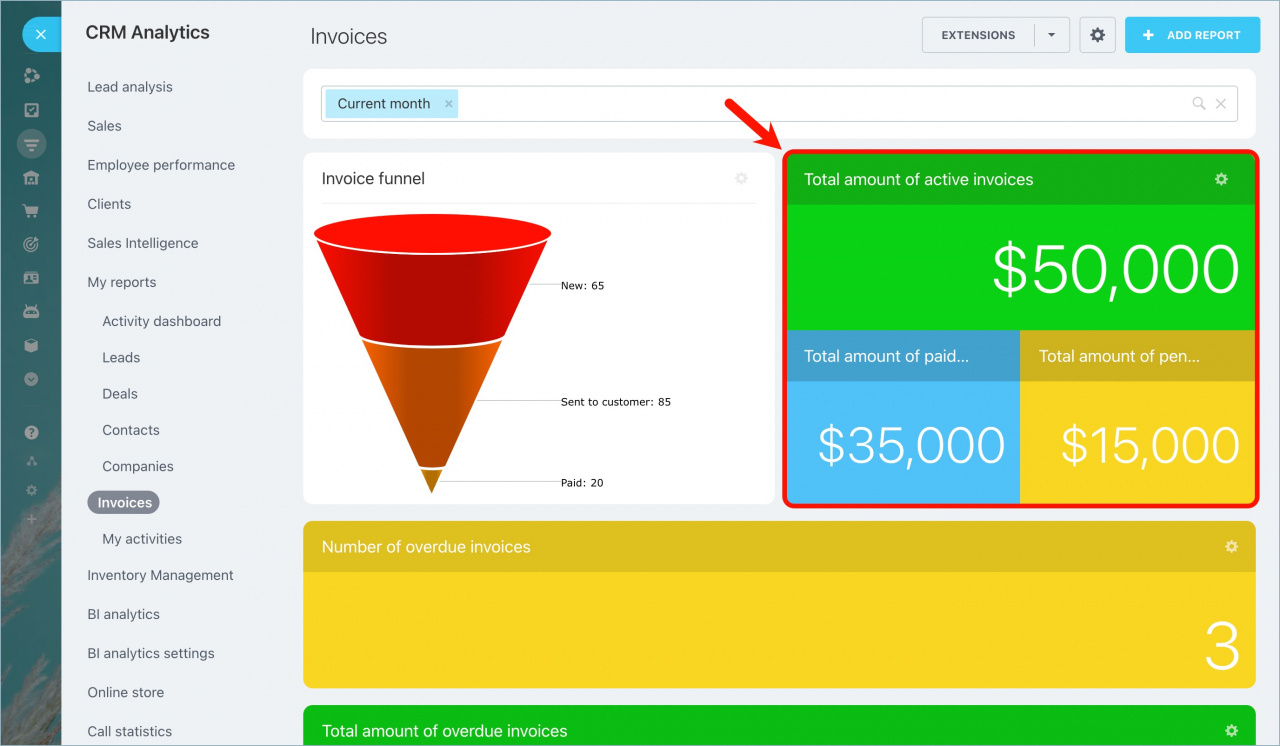
The Invoice funnel widget shows invoices distribution by statuses within the selected reporting period.
Total amount of invoices widget includes:
-
Active invoices - invoices that your sales team has been working with during the reporting period;
-
Paid invoices - invoices that have been paid within the reporting period;
-
Pending invoices - the difference between the total amount of active and paid invoices.
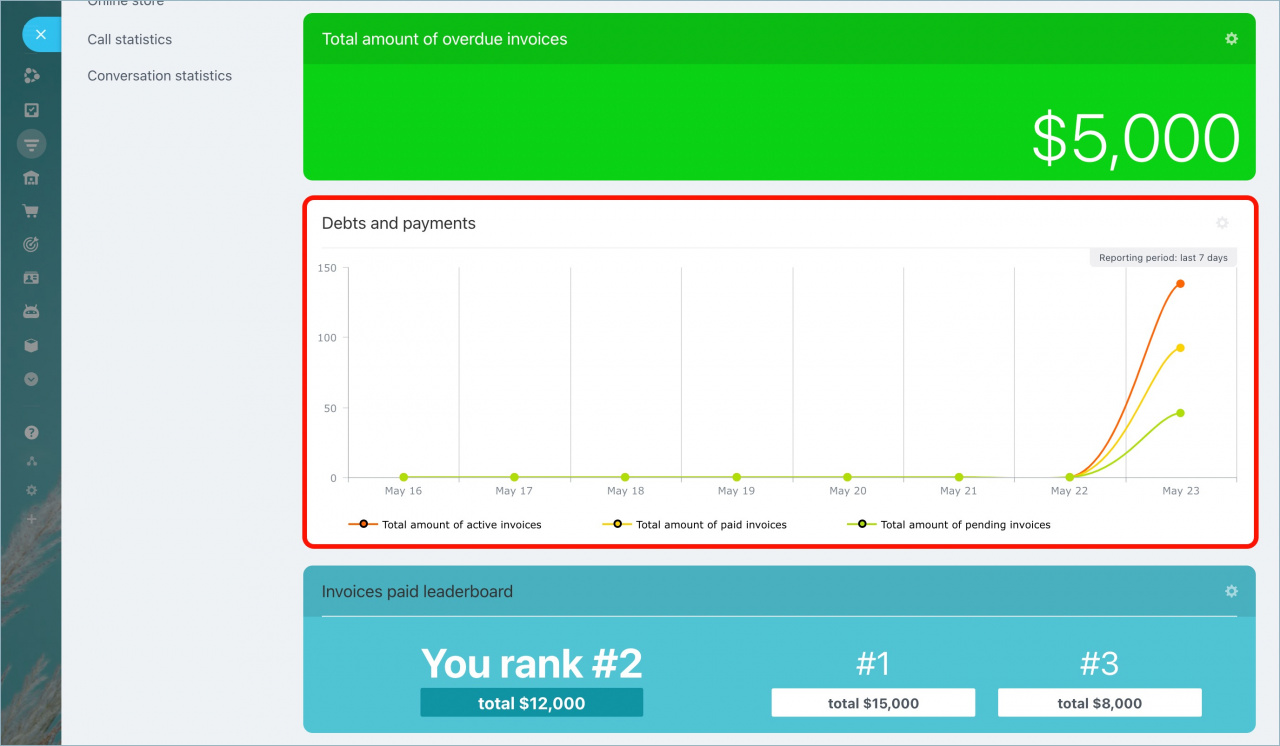
Debts and payments diagram shows the invoice statuses dynamics within the reporting period.
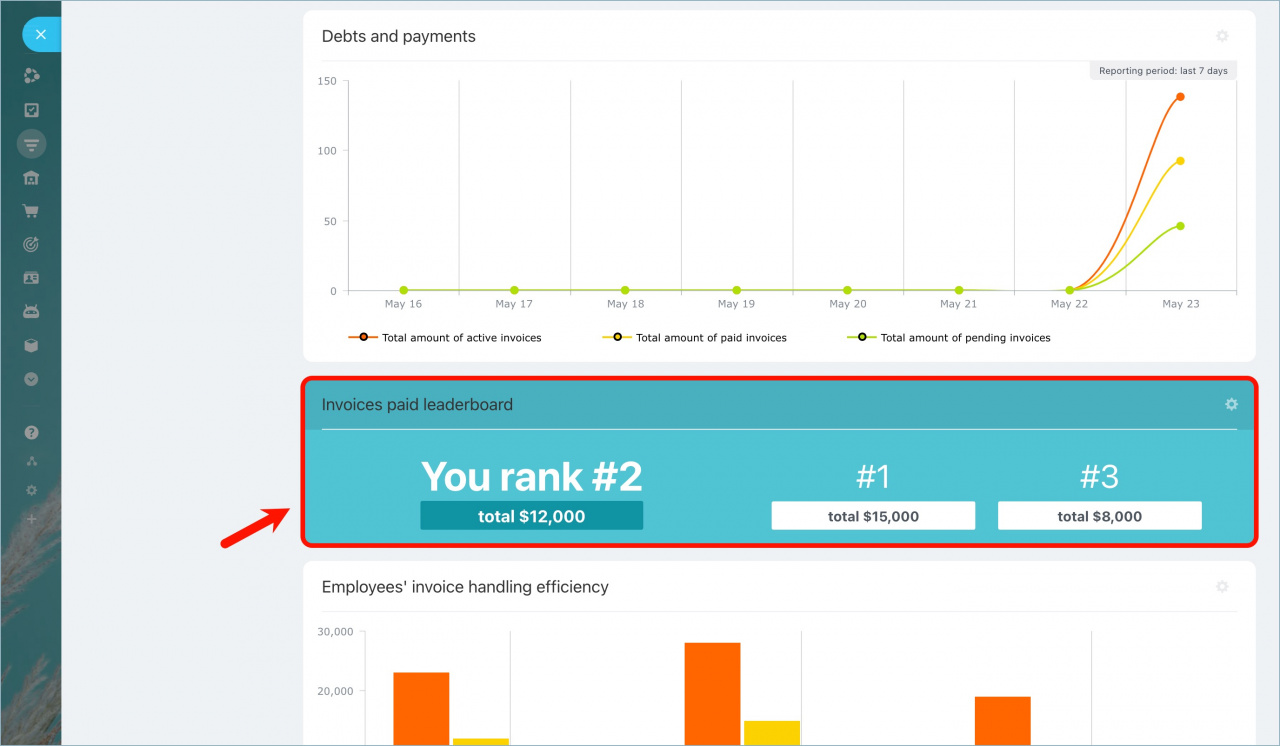
In the Invoices paid leaderboard, you can see your rank and the total amount of paid invoices within the reporting period. Also, you can see two closest to your rank users ("competitors").
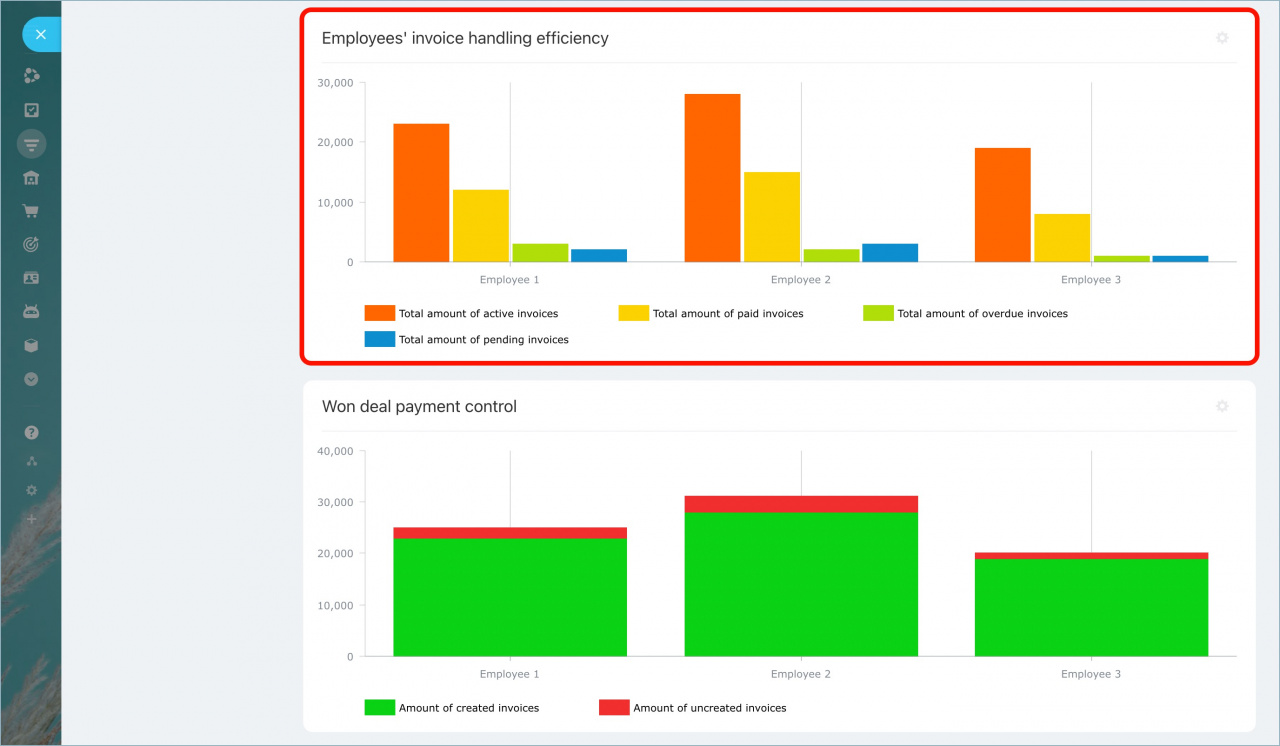
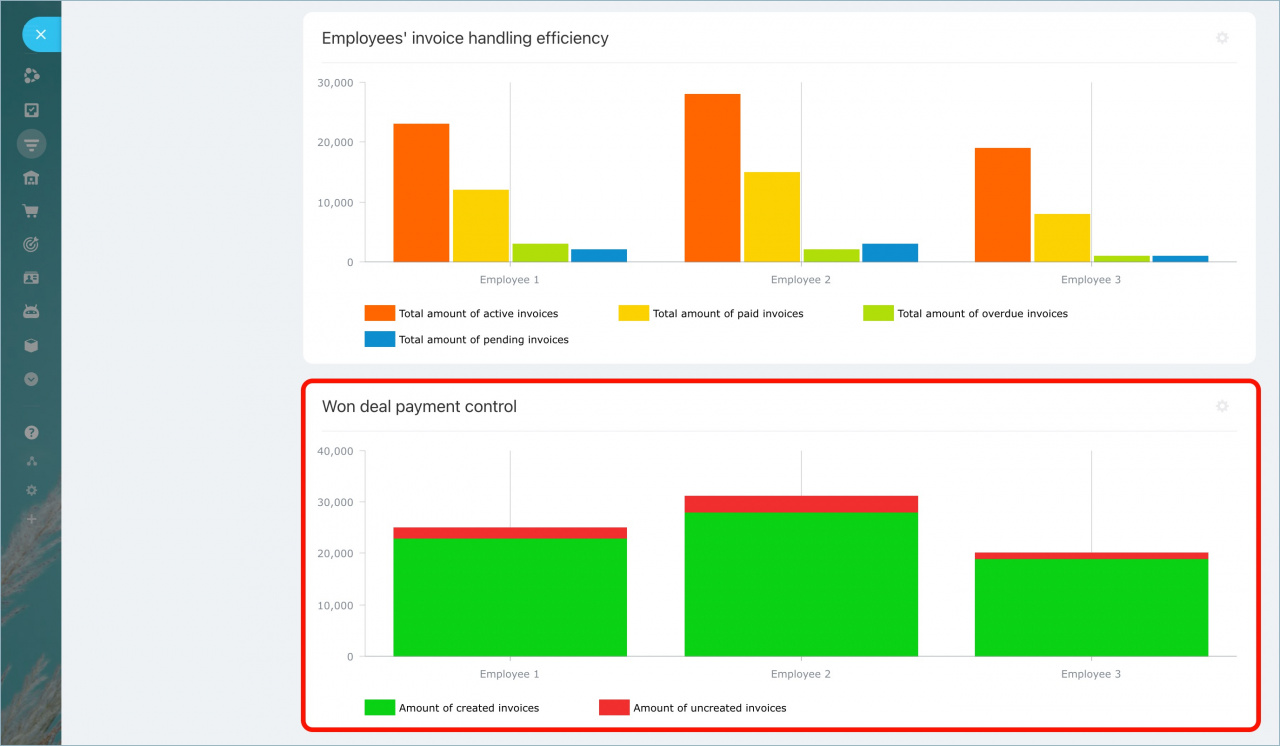
Employees' invoice handling efficiency report is the same as Debts and payments, but the data is shown for each employee.
Won deal payment control report shows the amount of won and invoiced deals and the amount of won but not invoiced deals for each employee.

