In the BI Builder, filters have been updated, presets added, and the logic for limits has been changed. These updates make it easier to switch between data slices and analyze reports:
- Filter interface — the calendar and selectors are now more intuitive.
- Filters by parameters and company structure — it helps view data for specific employees, task flows, or workflow templates.
- Presets — allow saving filter settings and reusing them in reports.
- New limit logic — when a limit is exceeded, only the request is blocked, and the BI Builder continues to function.
In this article:
Using filters
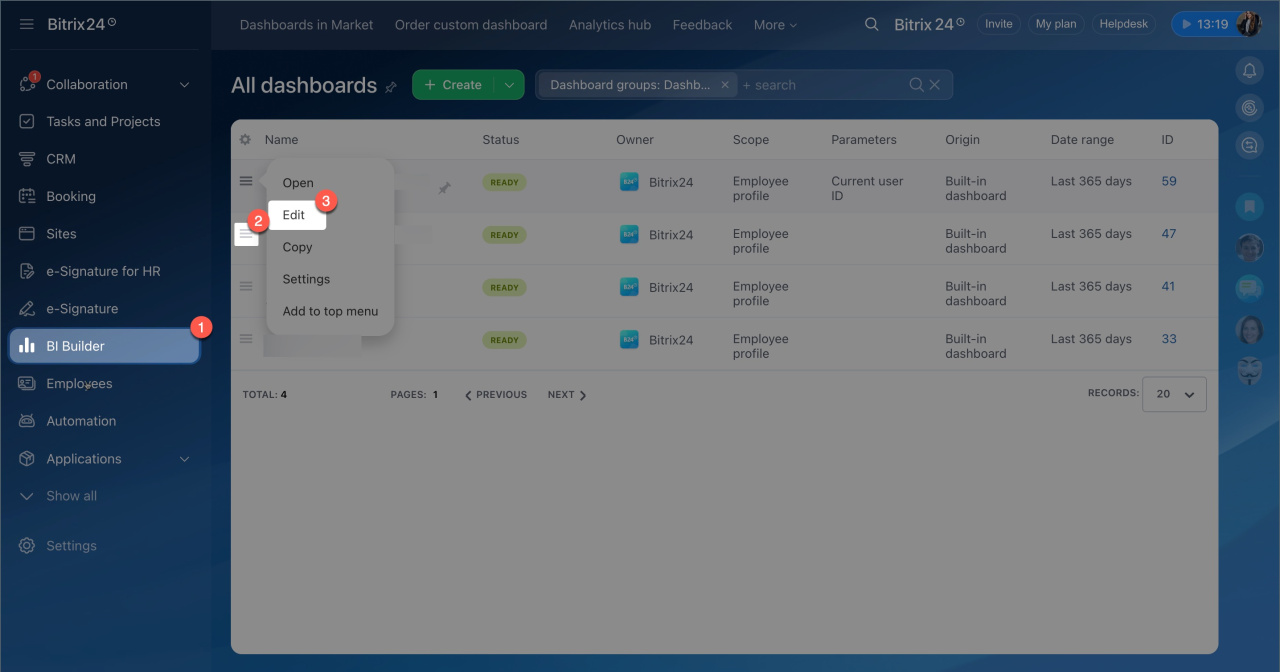
To add filters:
- Open the BI Builder section.
- Click the menu icon next to the desired dashboard.
- Select Edit.
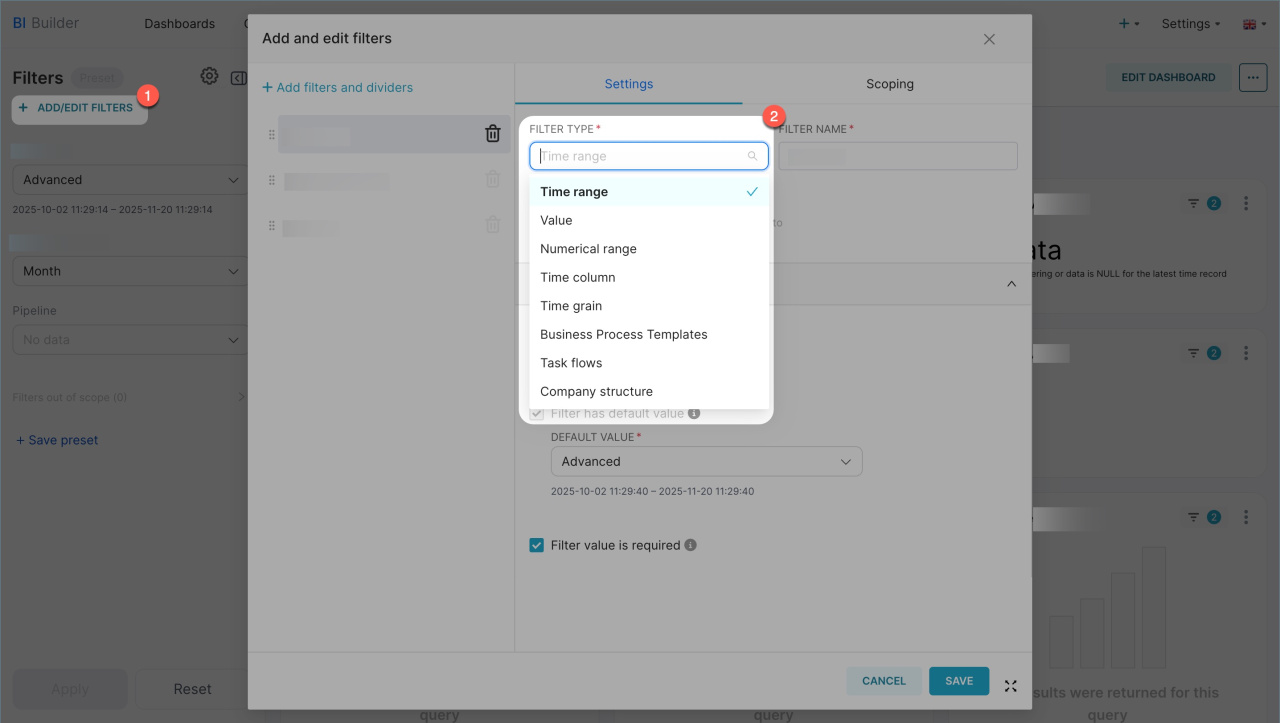
- Select Add/modify filters in the left panel.
- Specify the type, name, and other settings.
Filters allow you to manage report data: limit the period, select specific flows, employees, or workflow templates. Here's how to work with them:
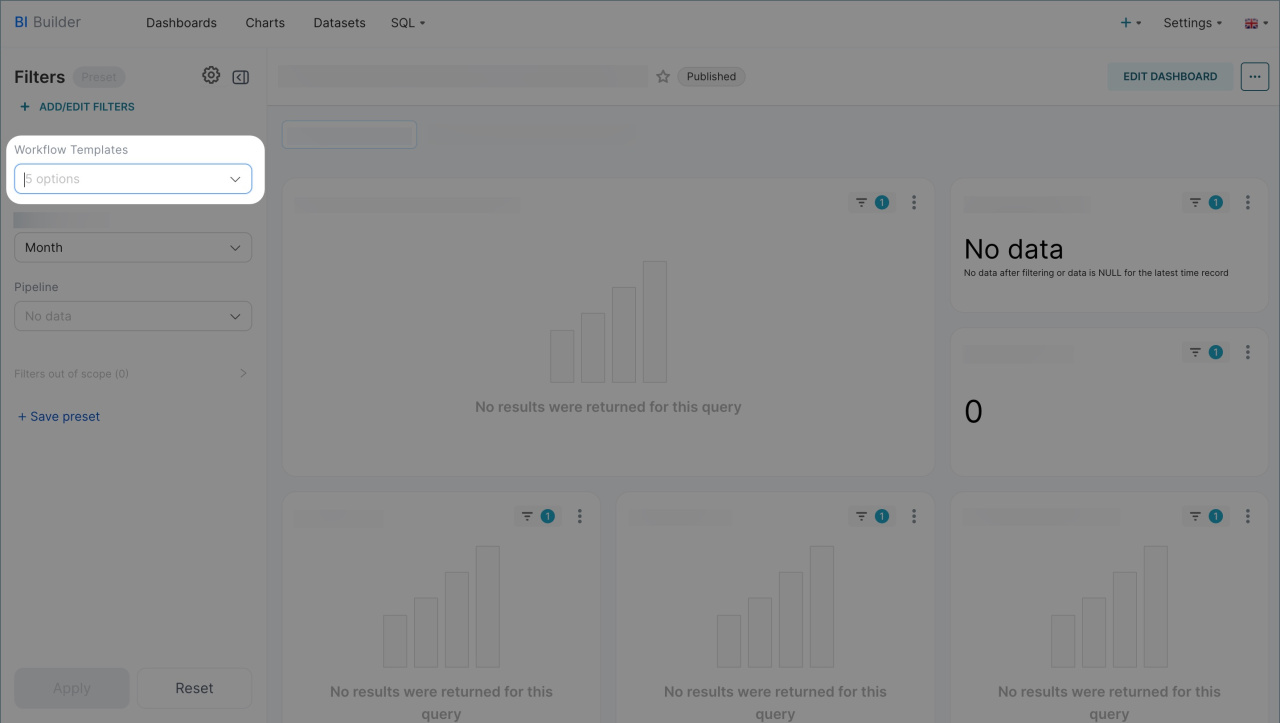
Filters by flows and workflow templates. These work with report parameters and automatically populate data depending on where the report is opened from. They help narrow down the selection and display information only for the required flow or workflow template. For example, if a report is opened from a workflow journal, the user will only see related data without unnecessary information.
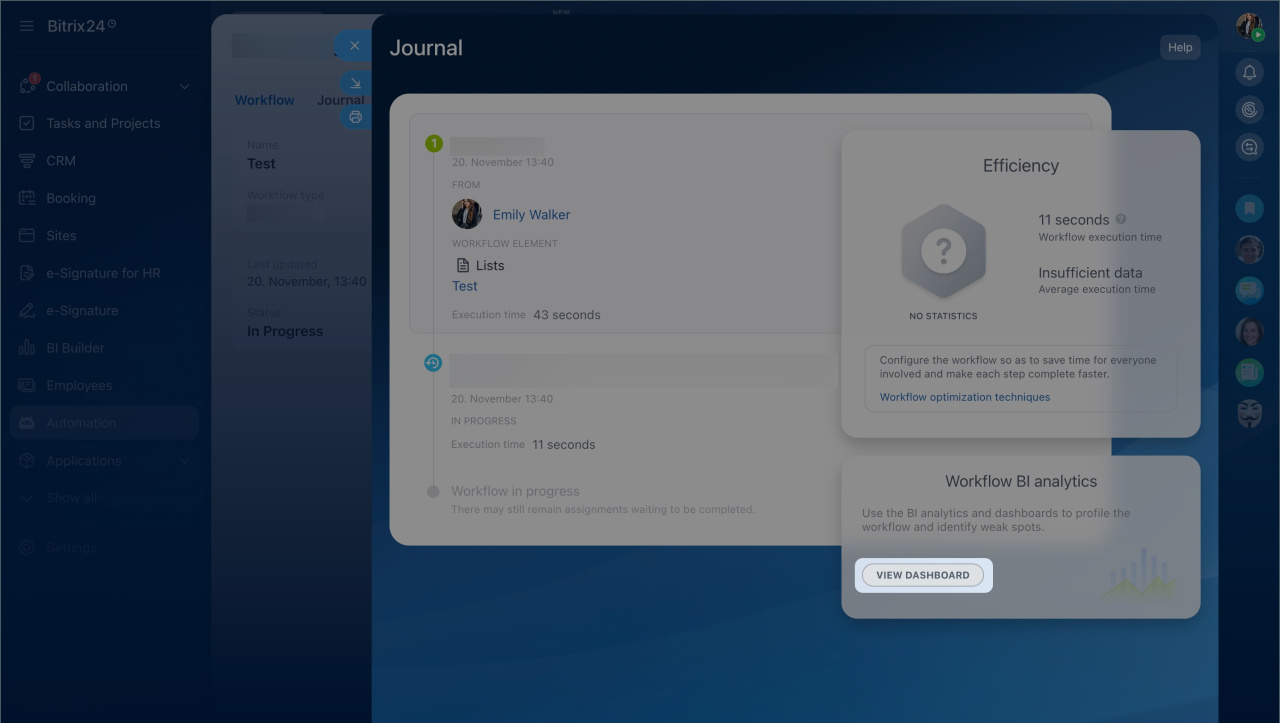
The report was opened from a workflow journal form. The filter automatically selected data only for this template.
To use filters, add the corresponding parameters to the report settings and the SQL query that builds the charts. In built-in dashboards, these parameters appear automatically, and the filter works immediately. In custom reports, the query needs to be edited manually.
Configure filters by flows and workflow templates
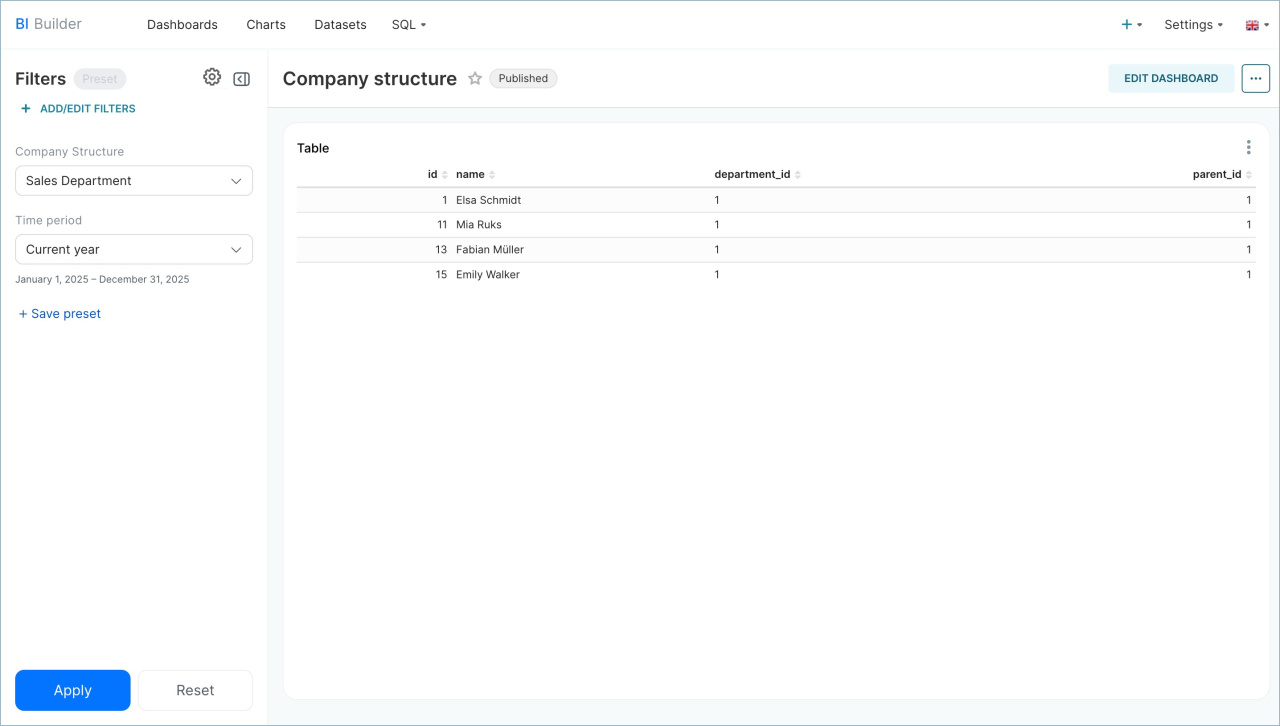
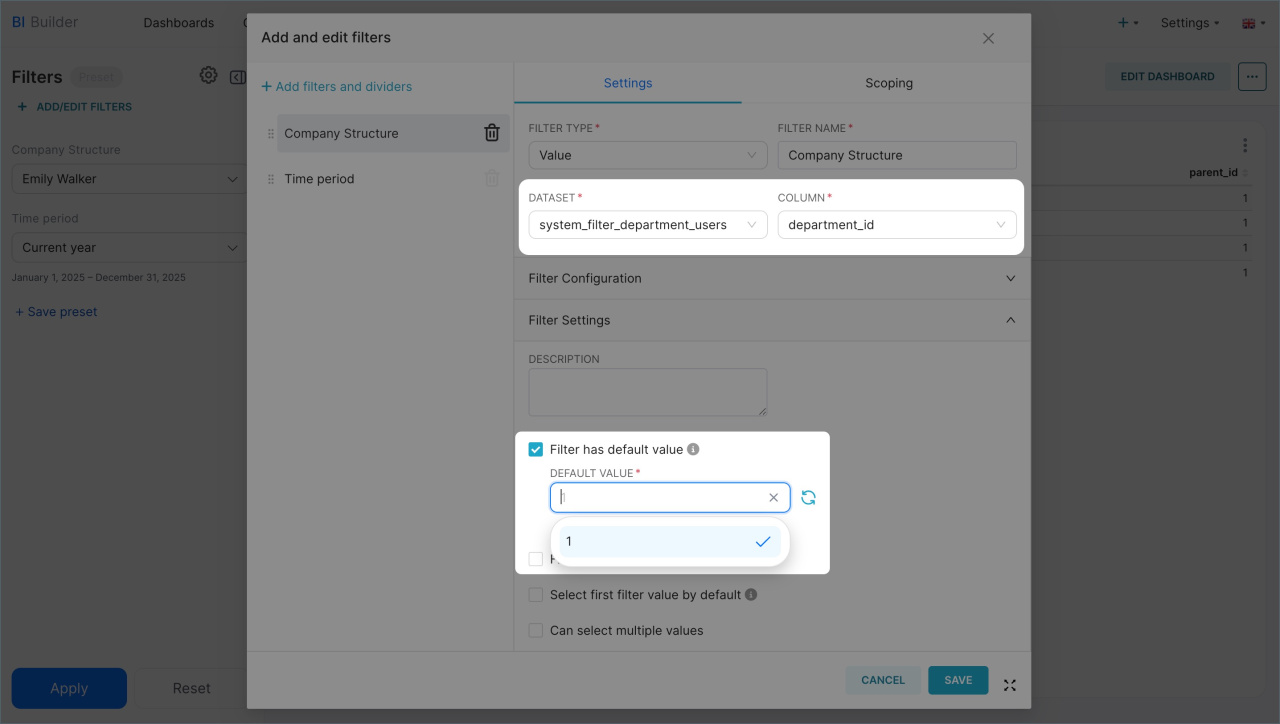
Filter by company structure. This filter allows analyzing data by departments and employees. It works like the employee selector in Bitrix24: you can select a department, all employees in subdivisions, or specific individuals. For example, a supervisor can select the marketing department and view the required metrics in the report. This is more convenient than creating a separate report for each department.
To use this filter in a report, configure the following:
- Select a dataset containing a field with only employee IDs, and specify this field in the filter settings.
- Set a default value, such as selecting a specific company department.
After this, you can switch between departments in the report and view analytics for specific employees or subdivisions.
Other filters. The appearance of filters has been updated. The interface is now more user-friendly. The calendar is larger, making it easier to select start and end dates or predefined ranges like a day, month, quarter, or year.
Configuring presets
Presets are saved filter sets. They save time by eliminating the need to configure filters repeatedly. The report creator can select the required parameters — period, employees, or deal amount — and save them as a preset. Users can then choose a preset from the list, and the report will immediately adjust to the specified conditions.
To configure presets:
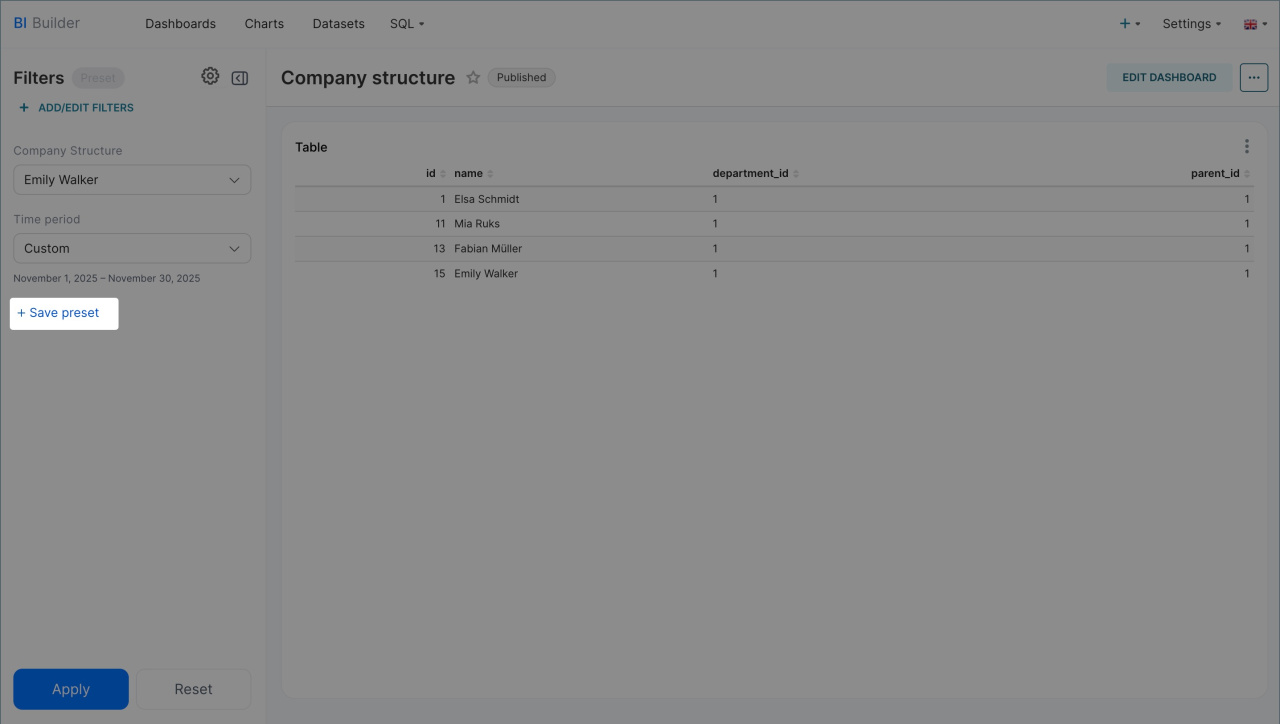
- Open the report, set the required filter parameters, and click Save preset.
- To allow other employees to use it, enable the Make public option.
- Once saved, the preset will appear in the report's left panel. Select it to quickly apply the desired filters.
New limit logic
Previously, exceeding limits would block data exports regularly. To remove the block, users had to contact Support. Now, a warning appears in response to a request. If a request exceeds the limit, only that request is blocked. It can be adjusted, and work can continue.
The transition to the new limit logic happens as follows:
- The transition is automatic for BI Builder and Looker Studio users.
- If you use Power BI, update the data loading code in working reports.
How to update the data loading code in Power BI
Copy the data loading code from the latest template and update it in the working report.
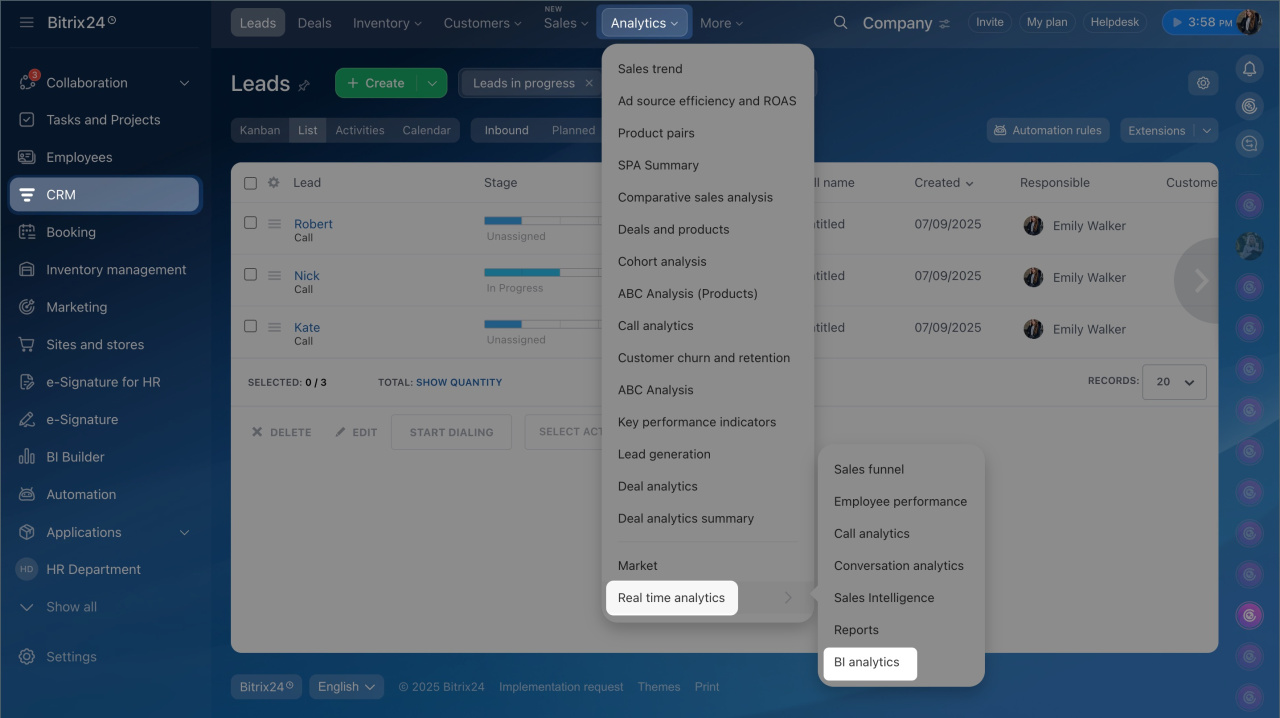
- Open the CRM section > Analytics > Real time analytics > BI analytics.
- Click Microsoft Power BI tab and download the template.
Update the data loading code in the working report where the block occurred:
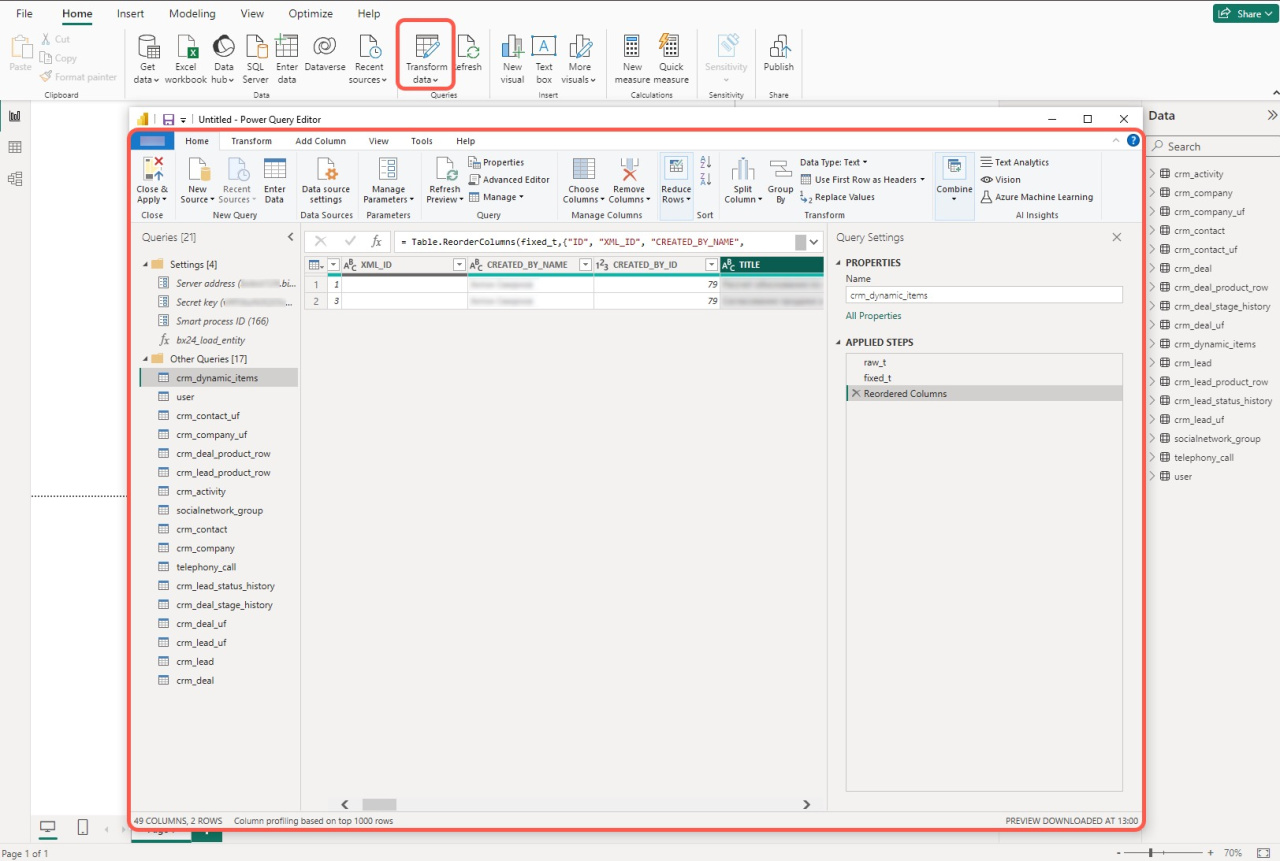
- Open the downloaded template and go to the Transform data section.
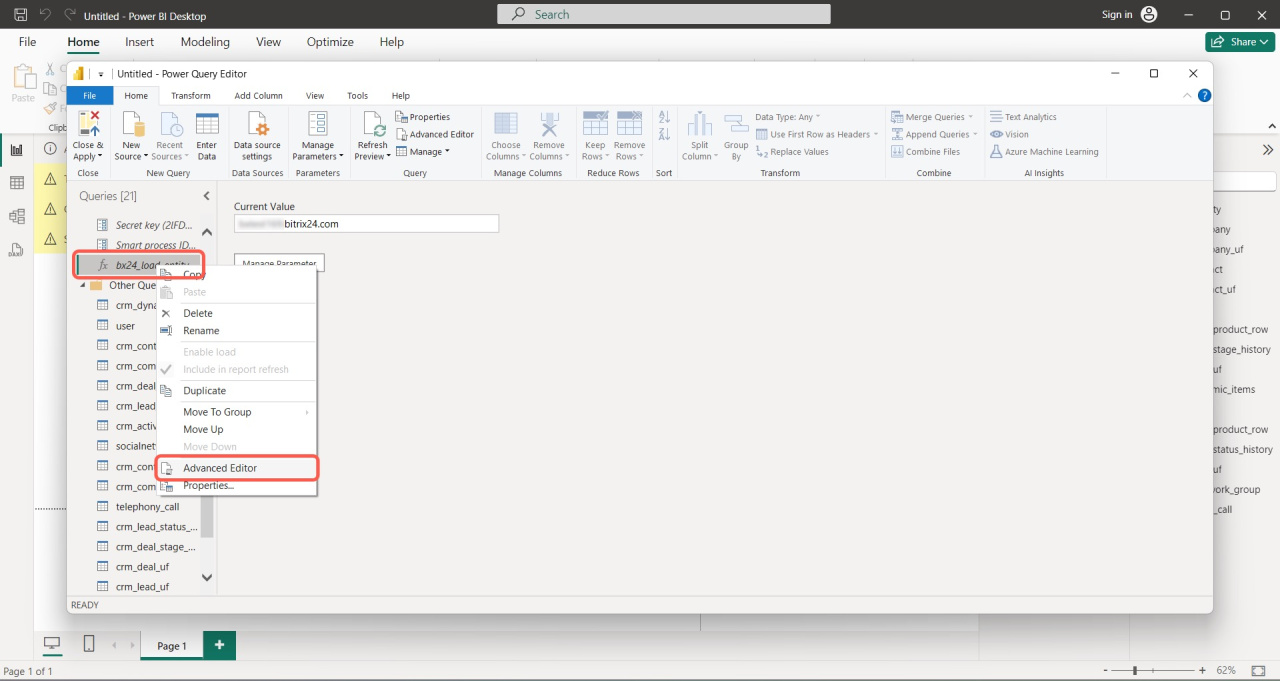
- Right-click on b24_load_entity and select Advanced editor.
- Copy the entire code from this query and paste it into the working report in the b24_load_entity query.
- After updating the code, the new limit logic will take effect. There will be no more blocks when limits are exceeded.
In brief
- New filters by parameters, presets, and updated limit logic are now available in the BI Builder.
- Filters allow quick switching between flows, workflow templates, and departments.
- Presets save filter settings, so you don't need to configure them repeatedly.
- When limits are exceeded, reports are no longer blocked: a warning appears, and the request can be adjusted.
- The transition to the new logic is automatic. For BI Builder and Looker Studio, no action is required. In Power BI, update the data loading code.

