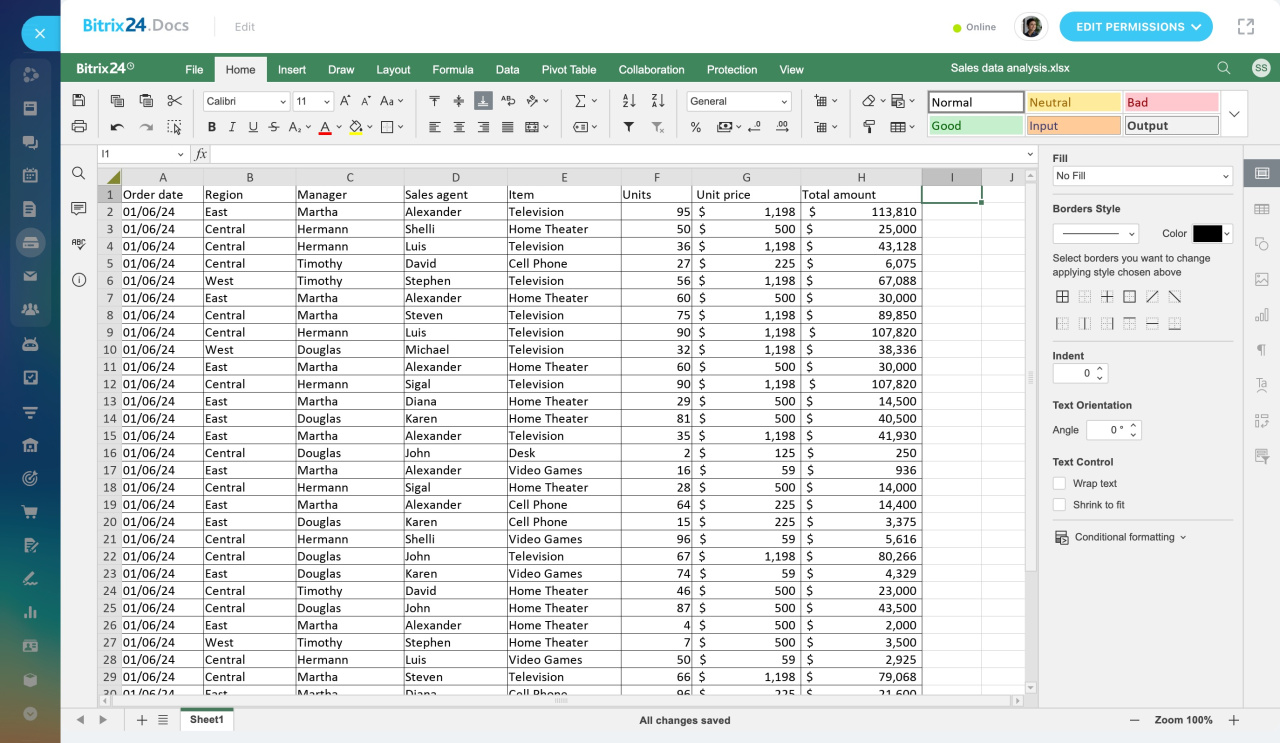
Spreadsheets are great for storing, organizing, and analyzing data. You can use the built-in Bitrix24.Docs editor to work with them.
OnlyOffice Docs: Spreadsheet Editor
In this article:
Create a spreadsheet
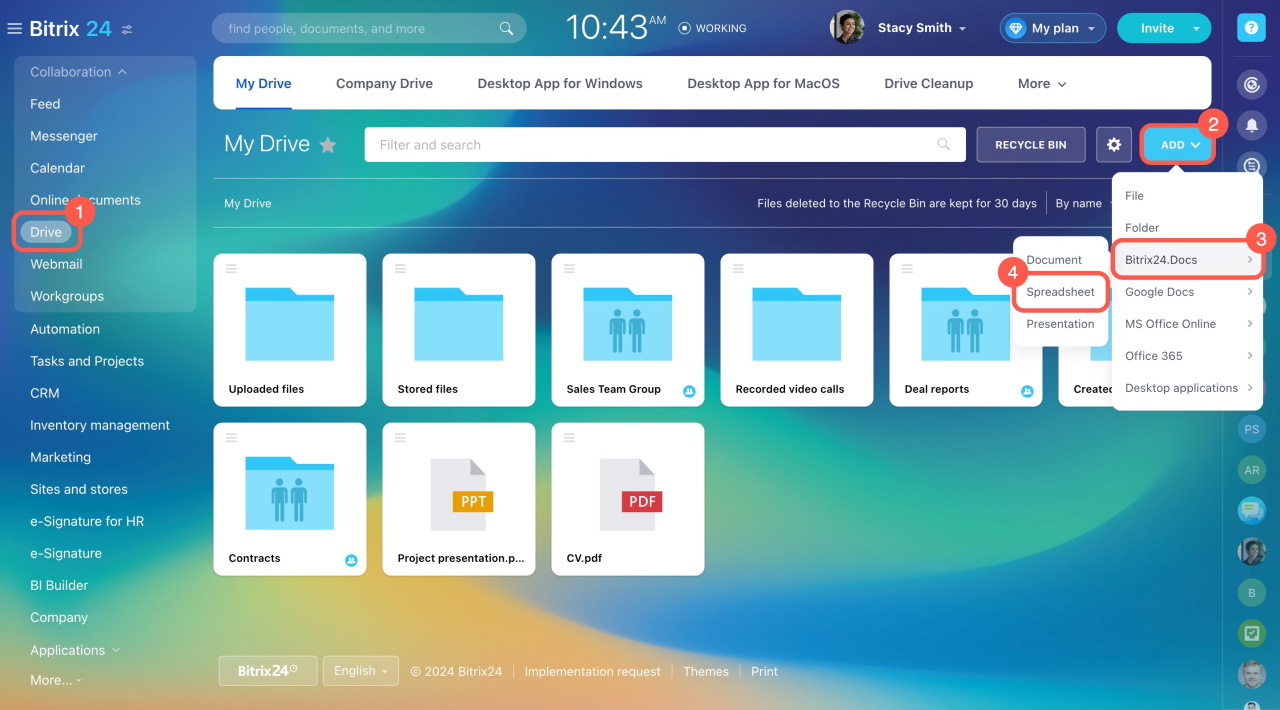
In Bitrix24.Docs, you can create a new spreadsheet or upload an existing one. To create a new spreadsheet:
- Go to the Drive section.
- Click Add.
- Expand Bitrix24.Docs.
- Select Spreadsheet.
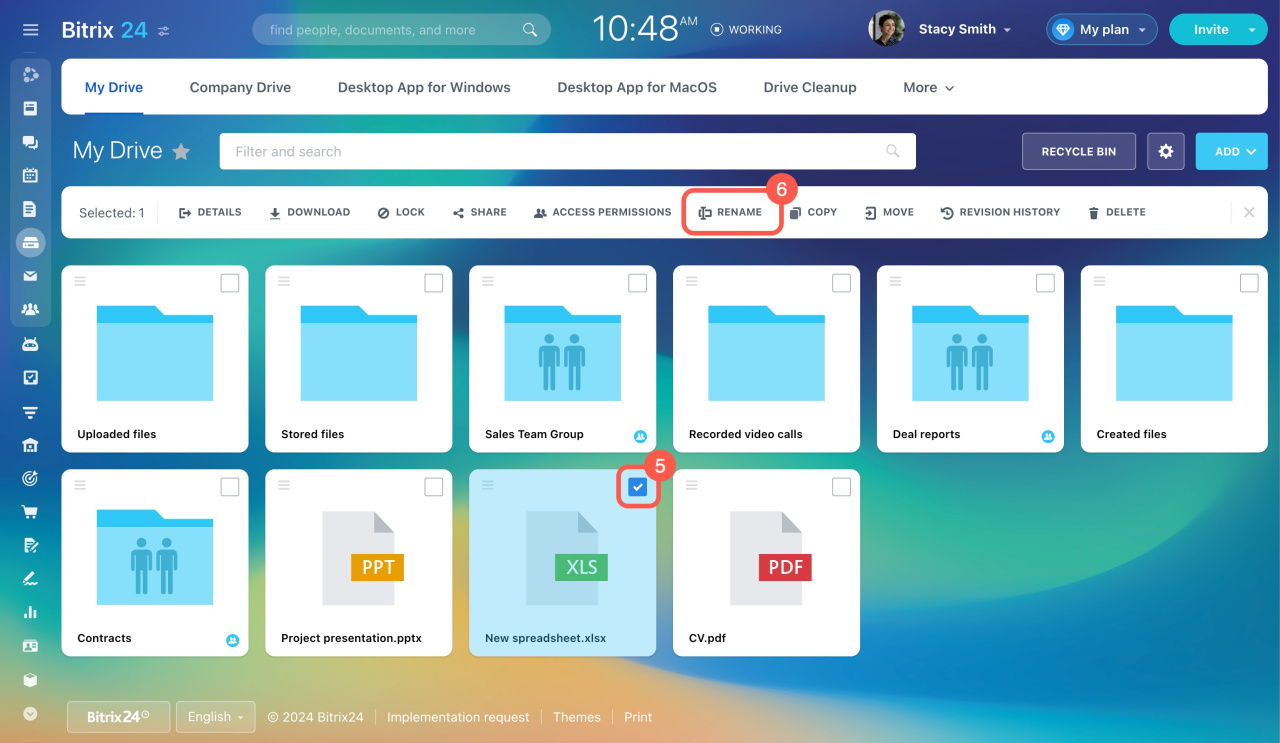
- To name your spreadsheet, check the file and select Rename.
Set spreadsheet access
Decide who can view and edit your spreadsheet. For example, grant access to specific employees and departments.
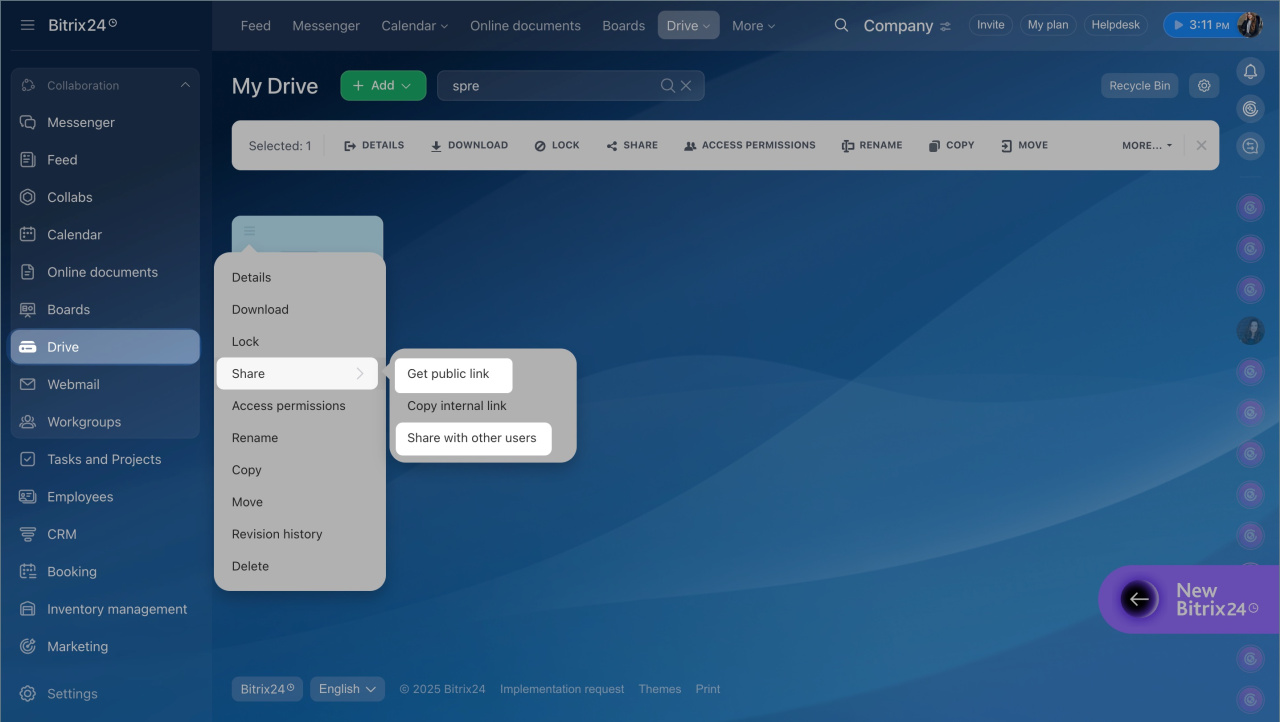
To configure this, check the file, select Access permissions, and click Add more.
Configure access to documents
Fill in a spreadsheet
Enter your data by adding rows, columns, and the table header. You can add new rows and columns whenever needed.
Change the spreadsheet layout
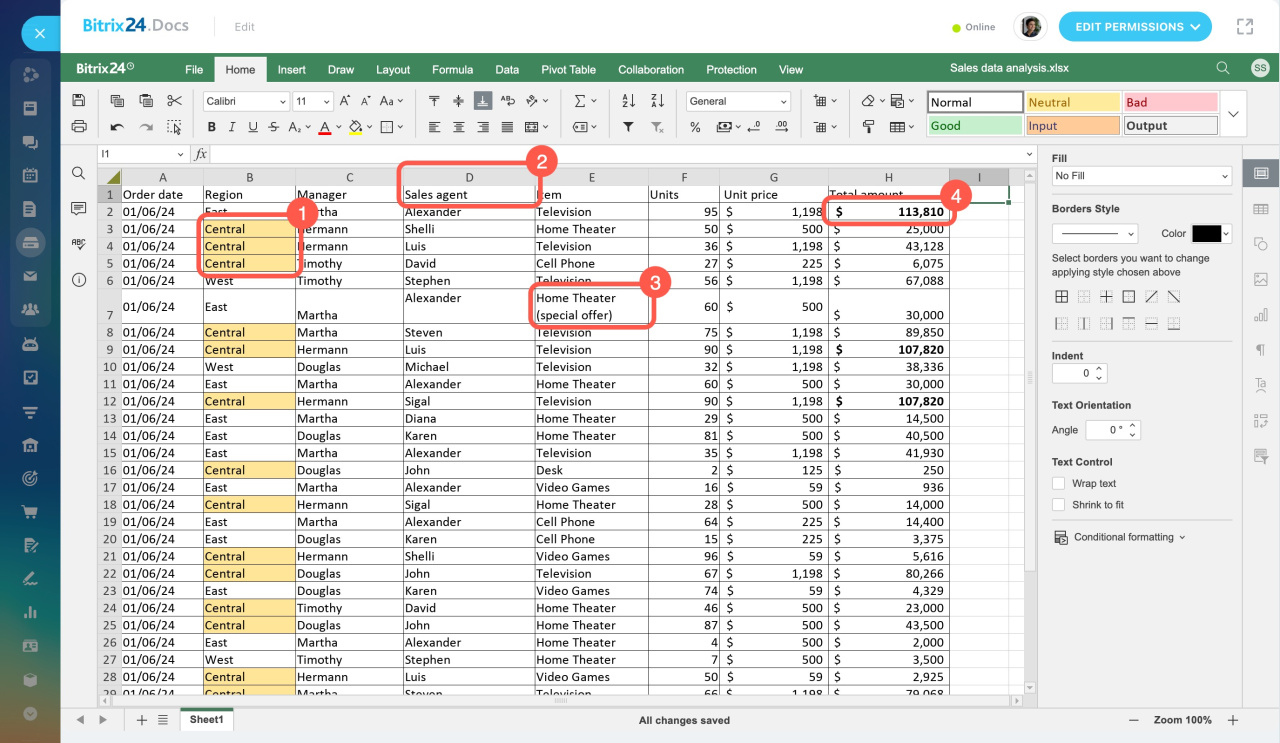
To make your spreadsheet easier to read, organize the cells. You can highlight key cells (1) or adjust column widths (2).
Also, manage line breaks (3) and use bold for important information (4).
Add formulas and functions
In spreadsheets, you can apply functions for rounding and formulas to calculate averages, totals, and more.
For example, use formulas to quickly calculate the total cost of items sold.
- Simply type the = sign and enter the SUM formula.
- Select the range you want to calculate and press Enter.
You can find all formulas and functions in the Formula section (3).
Add data visualization
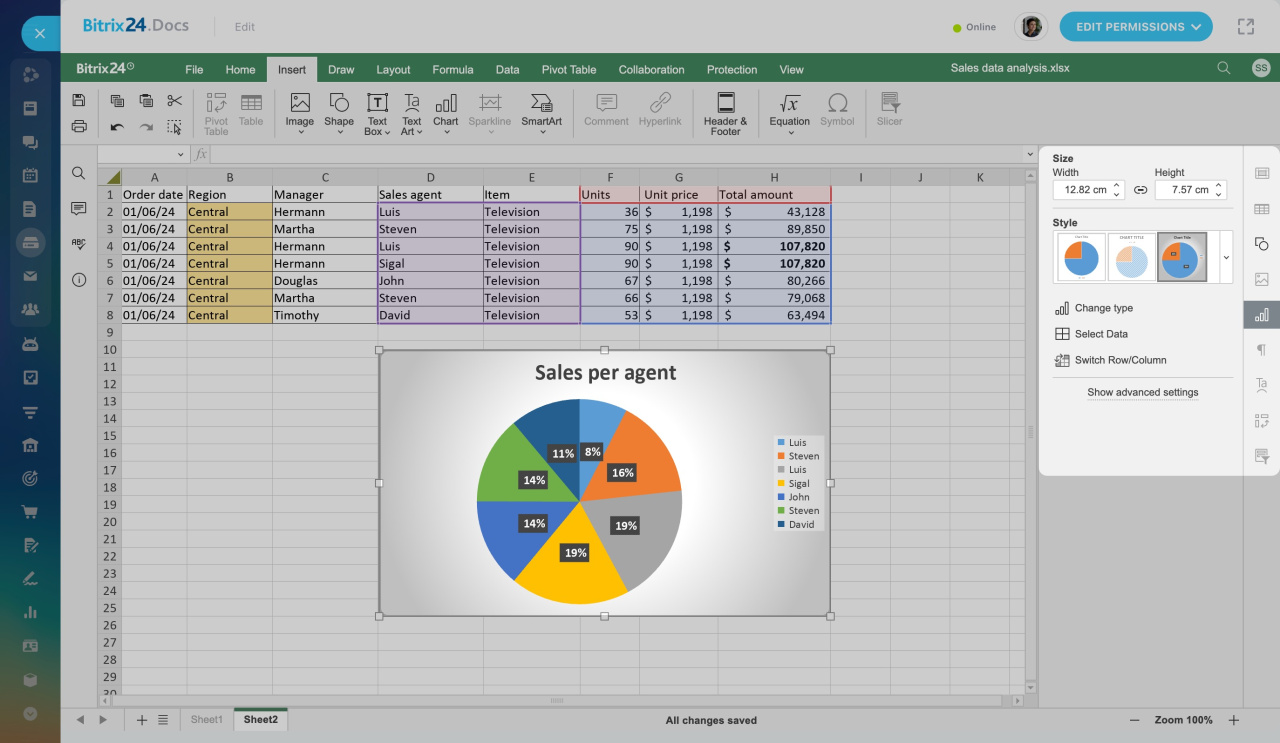
You can add charts, graphs, and other visual elements in your spreadsheets.
To add a chart:
- Select the area in the table you want to visualize.
- Open the Insert tab.
- Click Chart.
Use the panel on the right to customize your chart. You can select the data to display, change colors, choose the chart type, and more.
Create a pivot table
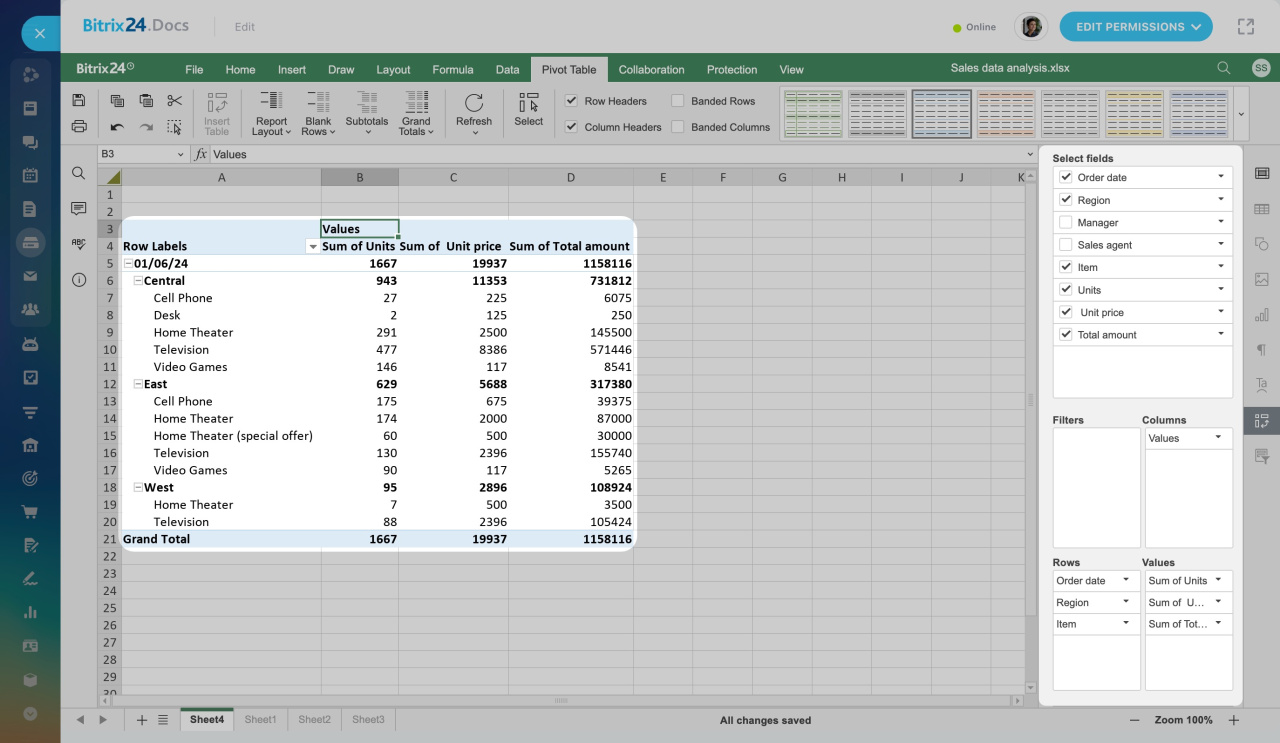
Use a pivot table to compare, group, and filter data.
With a pivot table, you can track changes, like how the total amount varies each month.
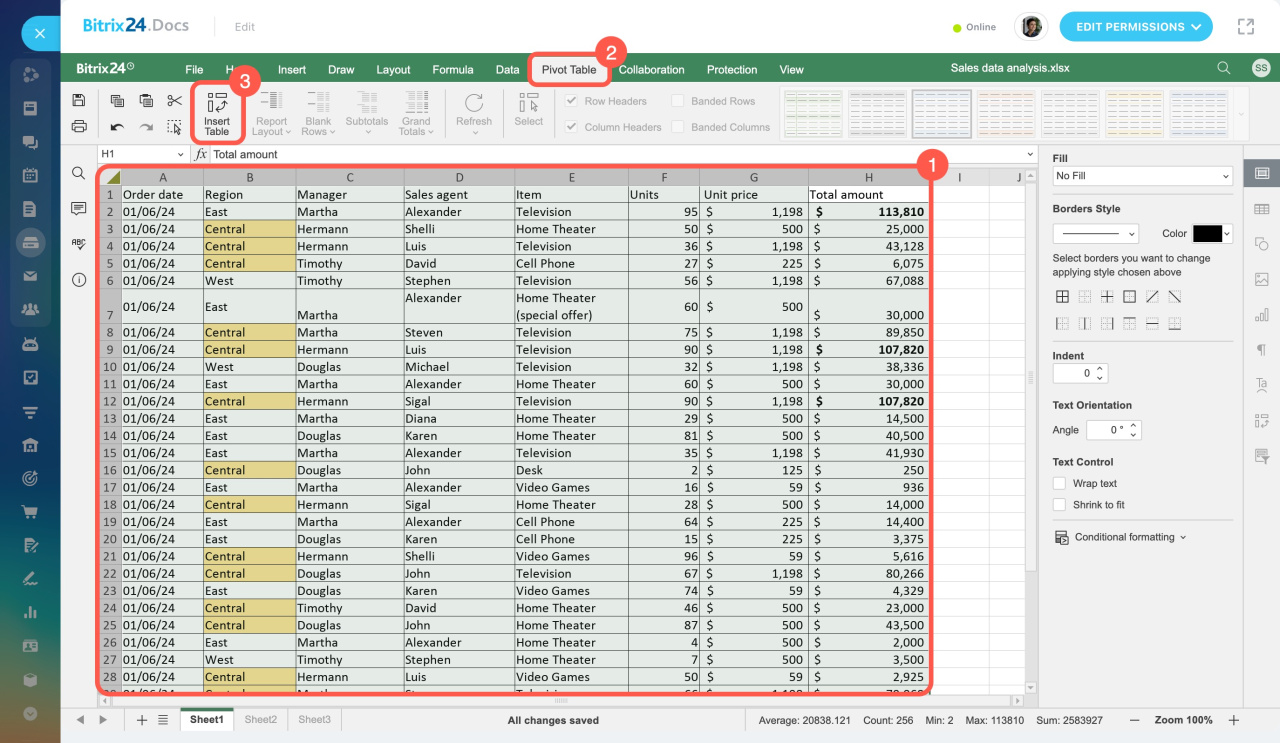
To create a pivot table:
- Select the area in the table you want to analyze.
- Open the Pivot Table tab.
- Click Insert Table.
Use the panel on the right to customize the table. You can select the data to display, add filters, and change the data range.
In brief
-
In Bitrix24, you can work with spreadsheets using the built-in Bitrix24.Docs editor.
-
Create, share, and co-edit spreadsheets directly in Bitrix24.
-
In Bitrix24.Docs, you can create a new spreadsheet or upload an existing one.
-
Configure access permissions to decide who can view and edit your spreadsheet.
-
In Bitrix24.Docs, you can change the spreadsheet layout, use formulas, analyze data, add charts, and more.

