Bitrix24 has a special constructor for creating reports on work with tasks. You can gather the necessary information you want to see in the report. Reports help the manager to evaluate how efficiently his employees work with tasks.
Create a report
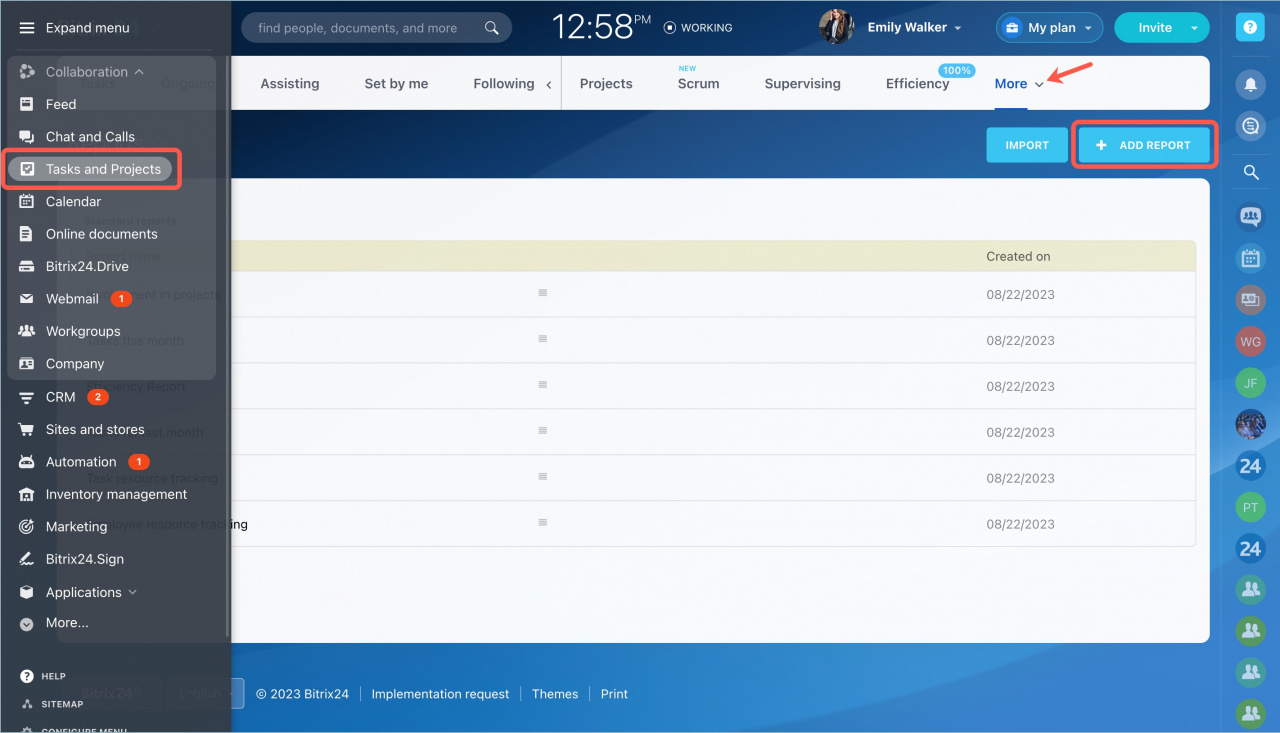
Go to the Tasks and projects section - More - Reports and click the Add report button.
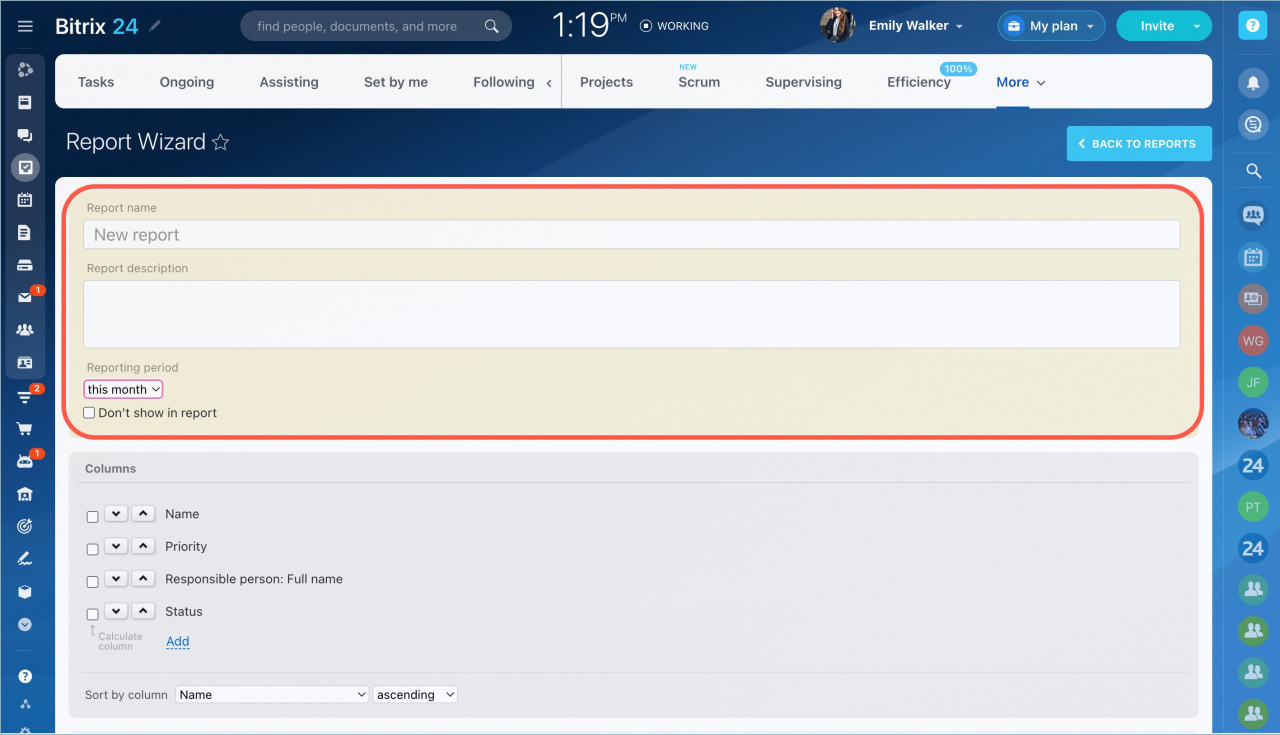
Enter a name for the report, add a description and specify the reporting period. The report will include tasks that were active during the specified time period.
Check the Don't show in report box to hide the reporting period in the file.
Configure the report columns
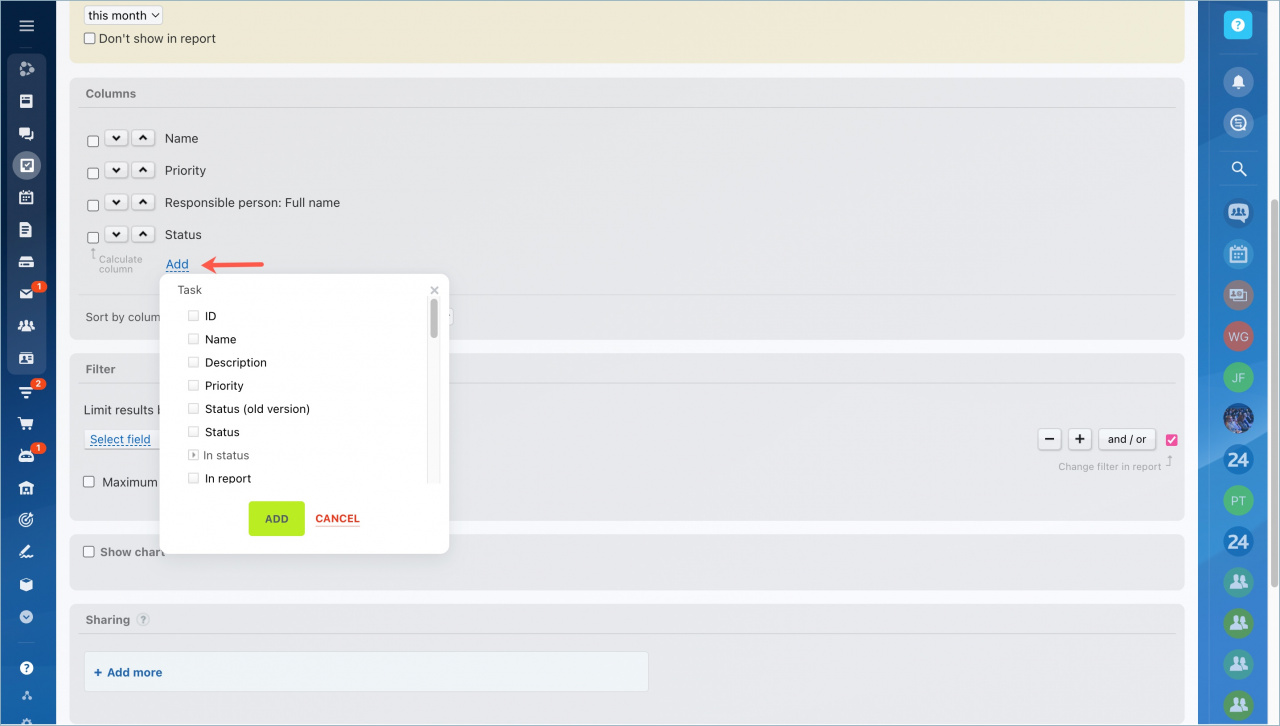
Select the columns you want to add to the report. Click Add and select one or more items for the columns.
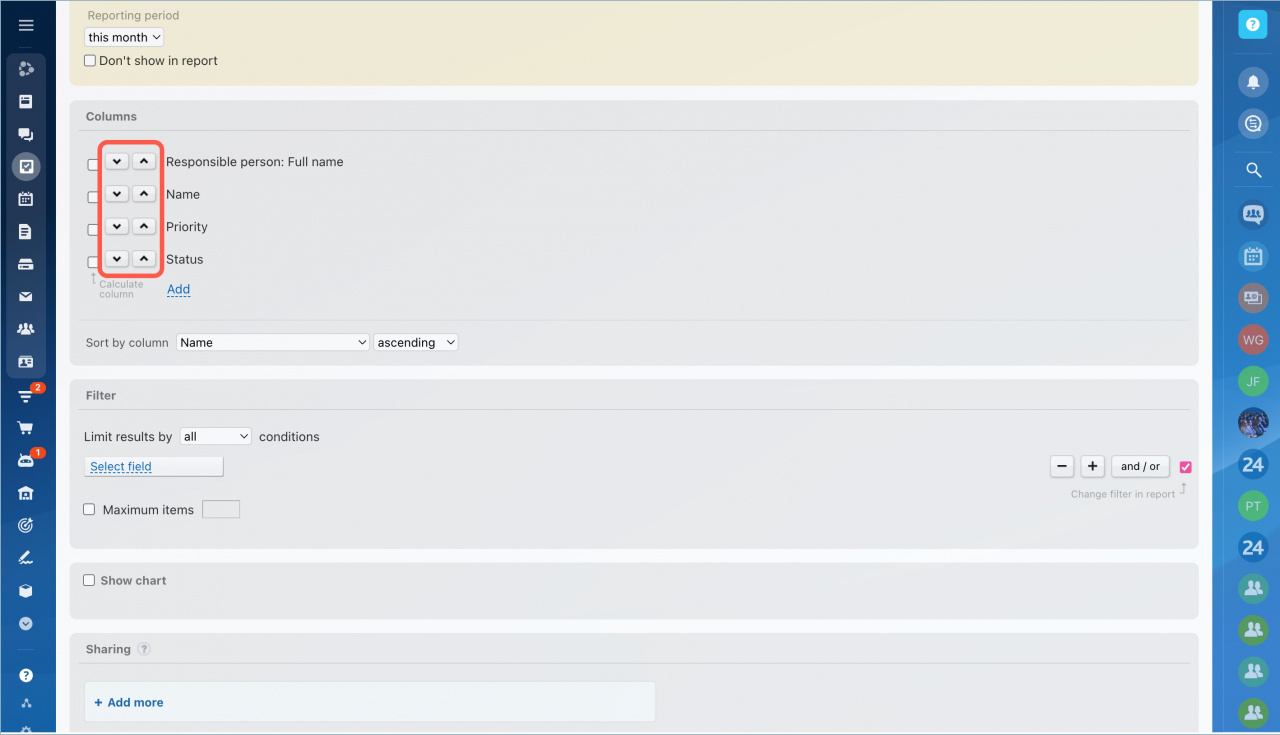
Click "↓" or "↑" icons to set field position in the report.
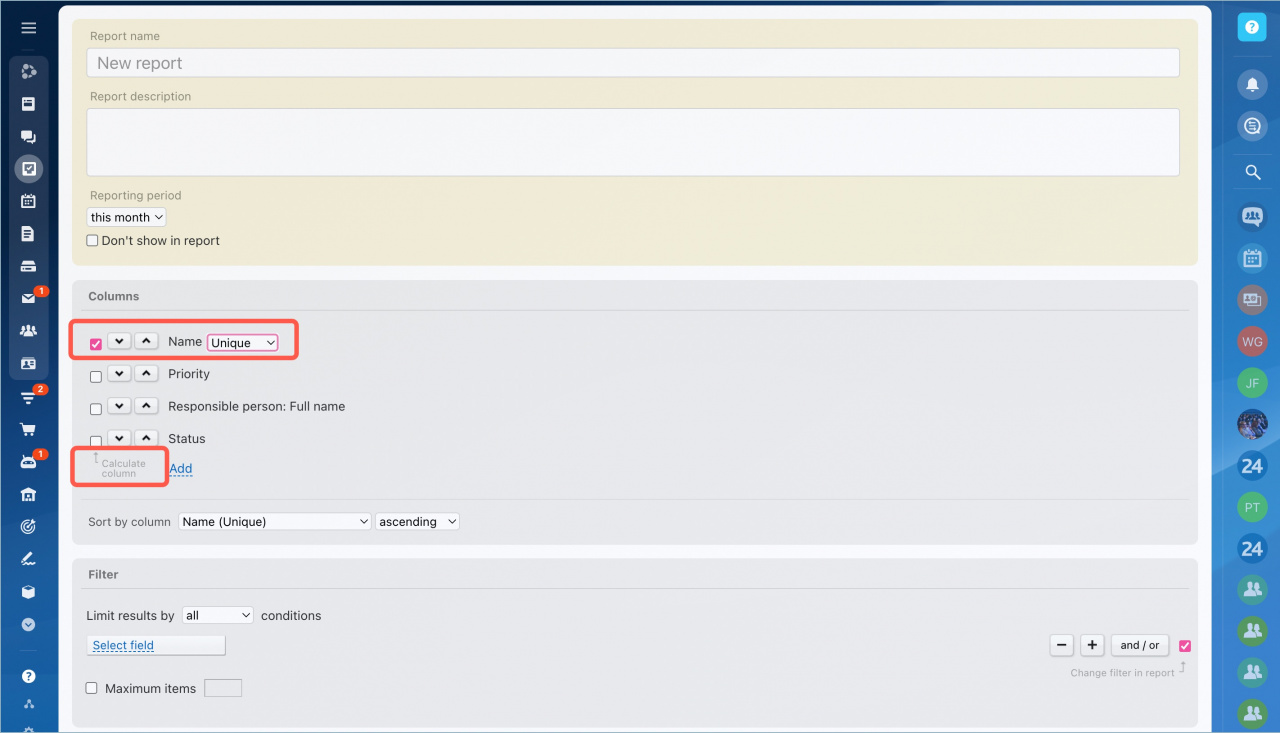
Use the Calculate column option to have the report show the number of unique data in each column and their sum instead of the list of tasks. Check the required columns. This option will also help to display the data chart in the report.
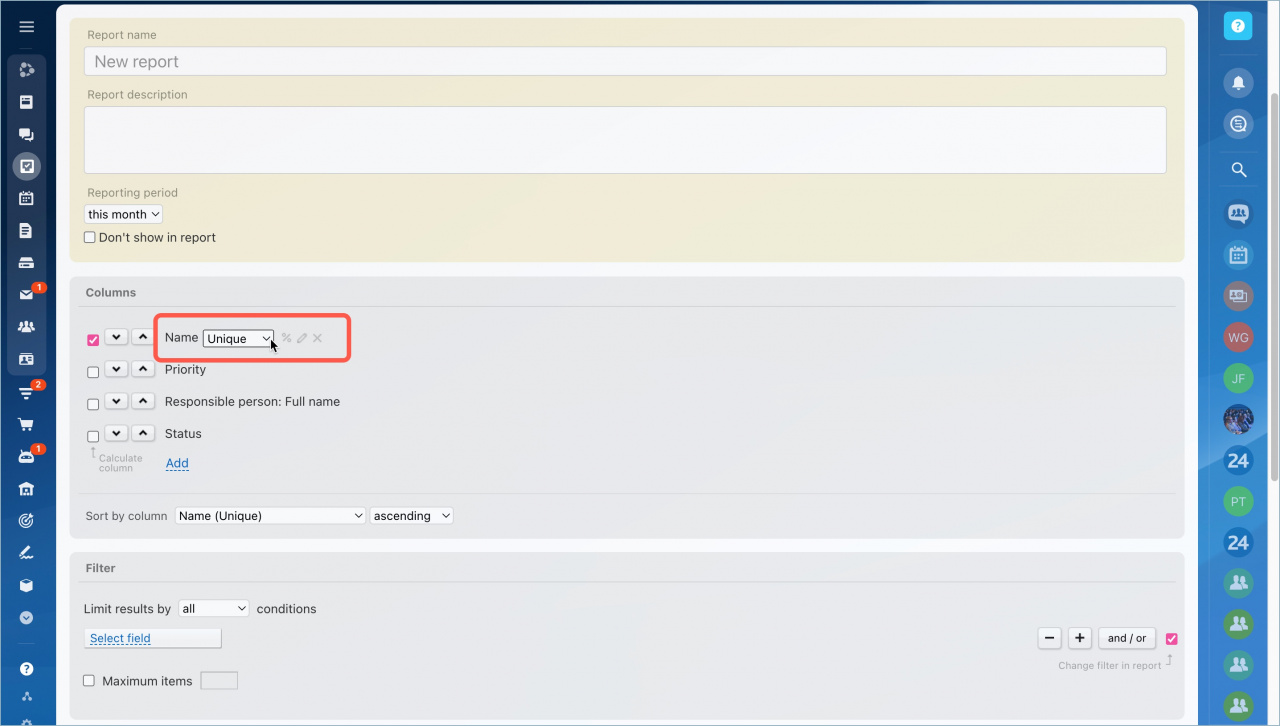
Hover the cursor over a column field to perform the actions:
- percentages of column value
- edit a column name
- delete a column
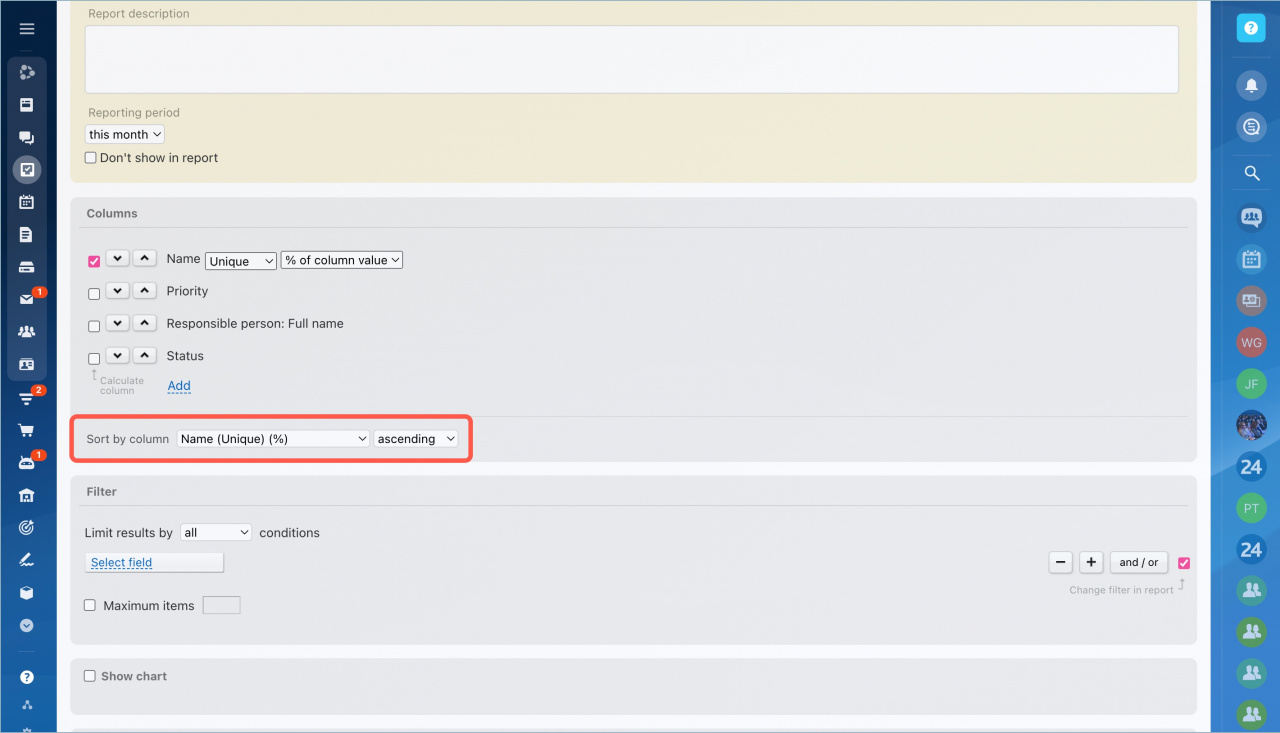
In the Sort by column section, select a column to sort all fields in the report. Specify the sorting criteria: ascending or descending.
Configure a report filter
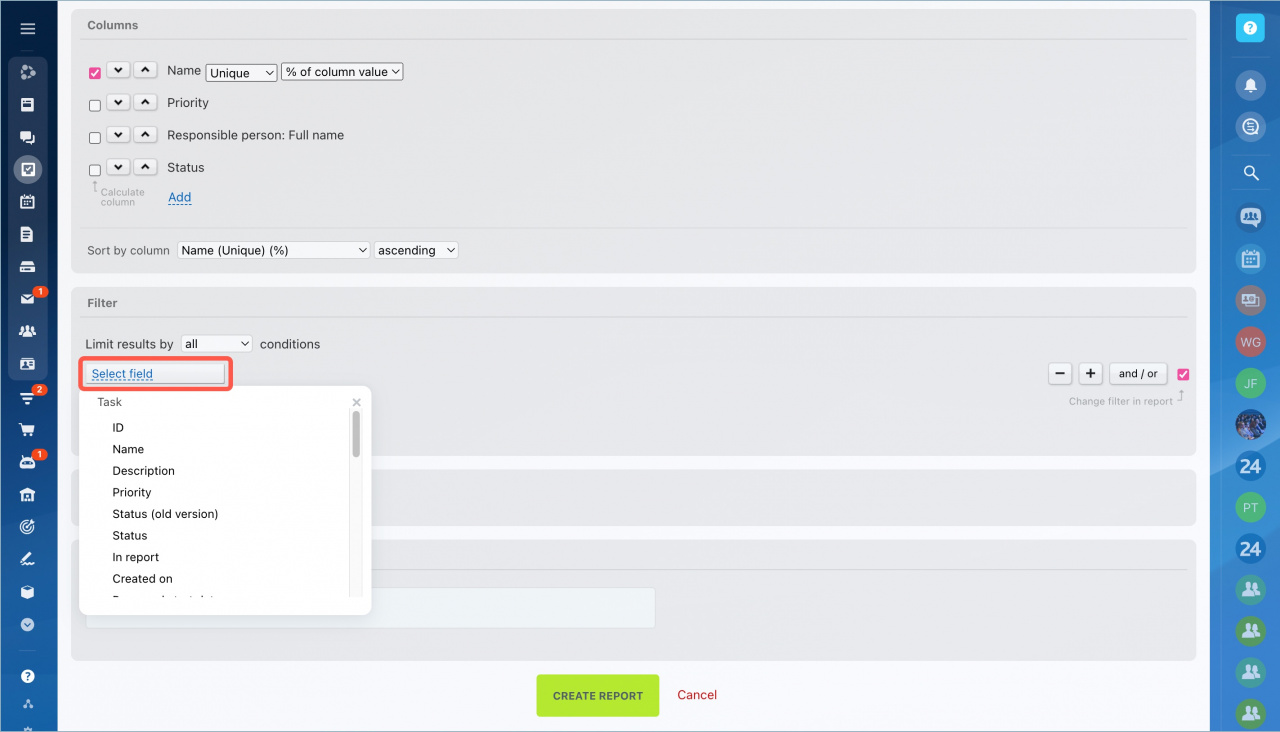
Configure the conditions for the report to be generated. It can be specific employees, task creation date and other elements. Click Select field and select the desired condition item.
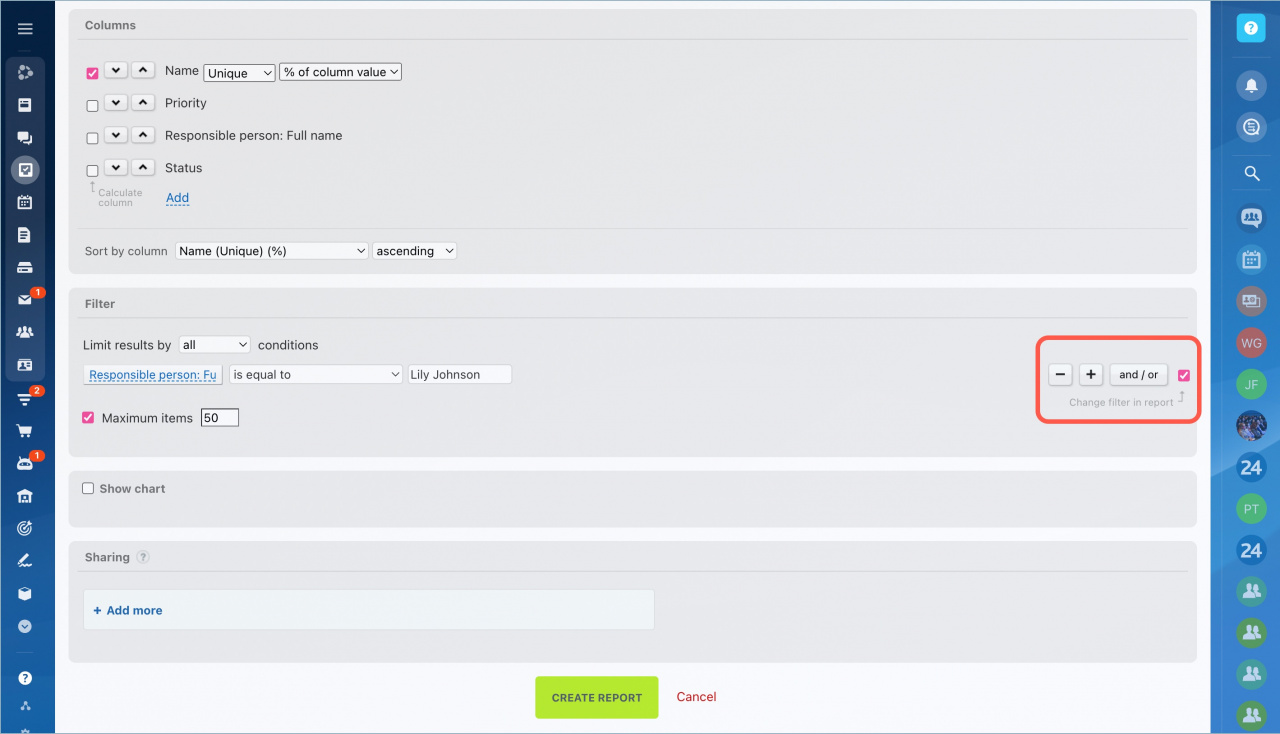
To add or remove additional filter conditions in the report, click + or - icons. You can also build a tree of conditions using the AND/OR button.
Change filter in report option will help you change the value of this field in the report display mode without editing the template.
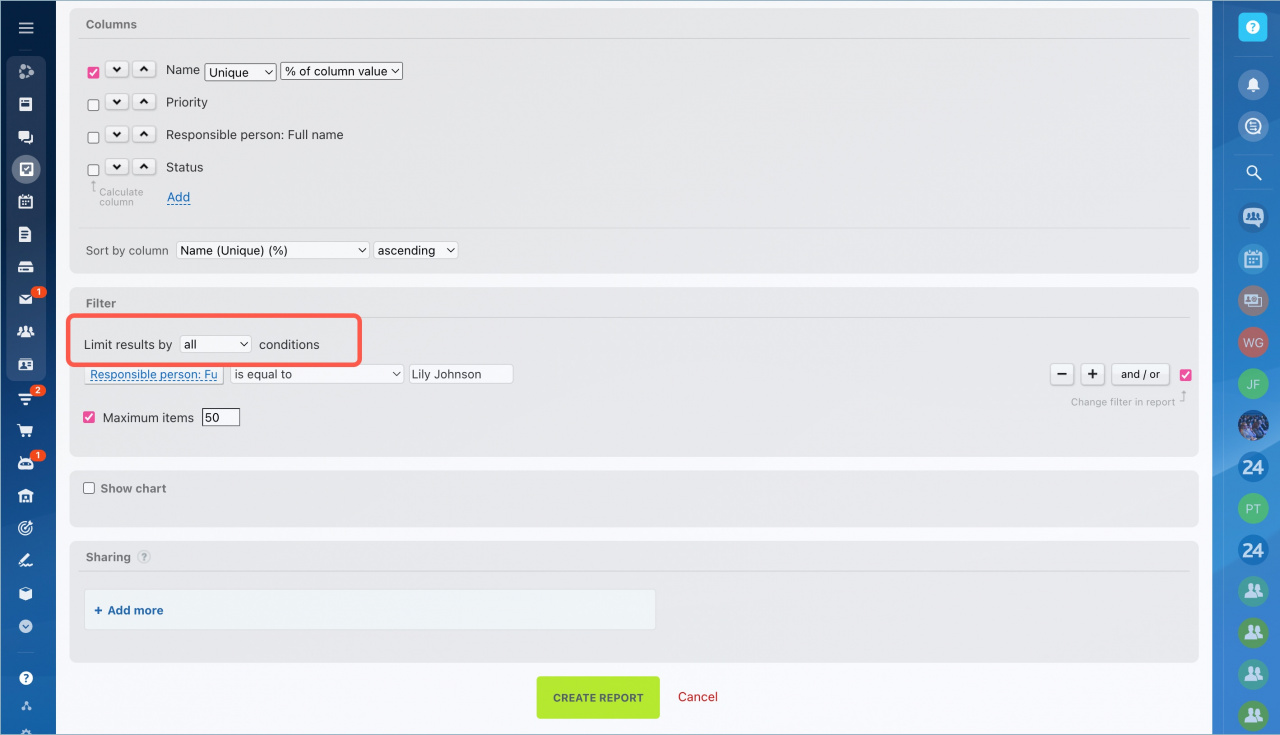
You can Limit results by all or any of the added filter conditions.
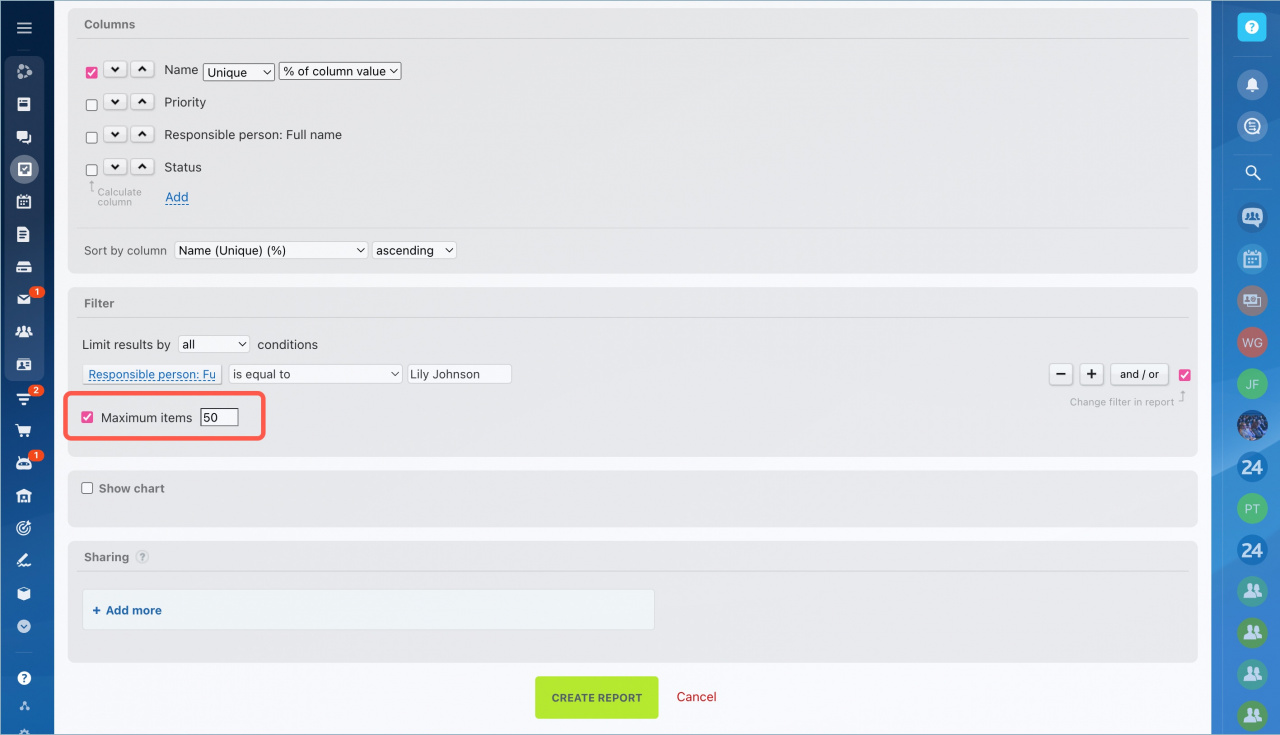
You can specify the maximum number of the items.
Show chart
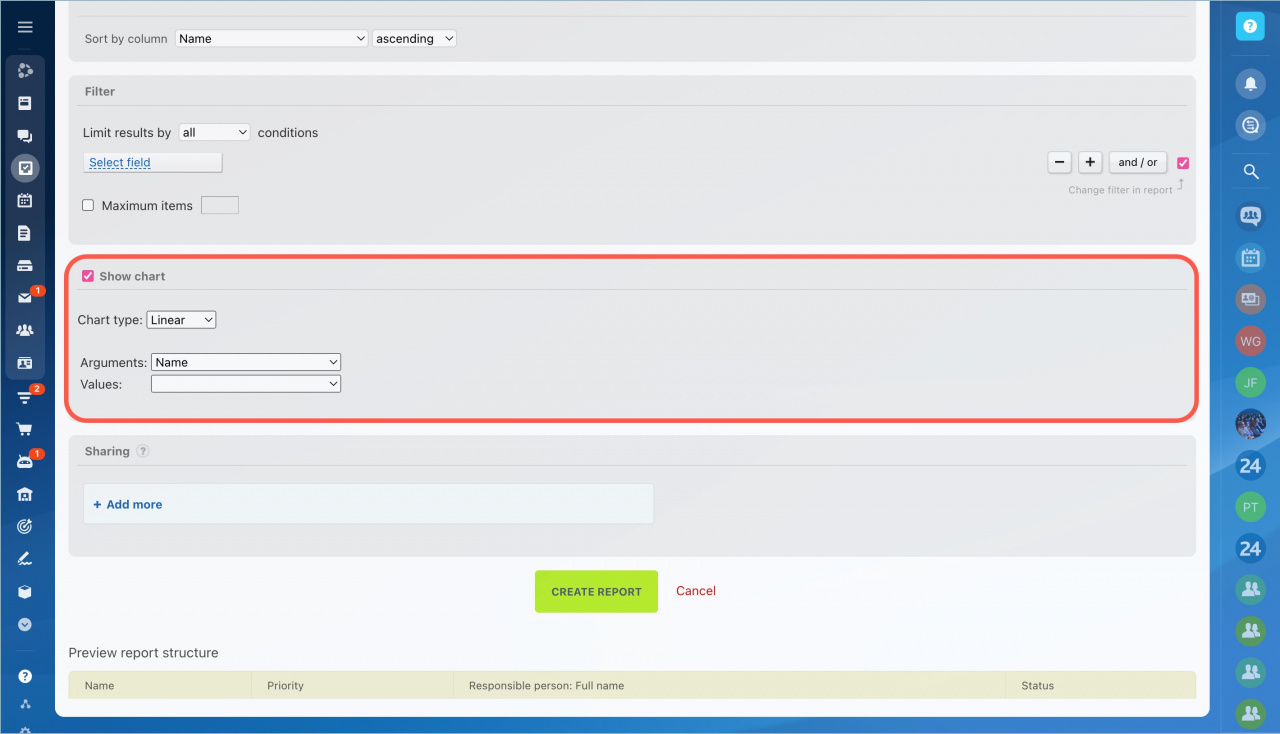
Check the Show chart checkbox to create a graphical element in the report. Configure the chart data:
- Chart type - the data will be displayed in the form of the selected graphic element.
- Arguments - the field by which data with values will be collected.
- Values - fields, information on which will be shown in the diagram.
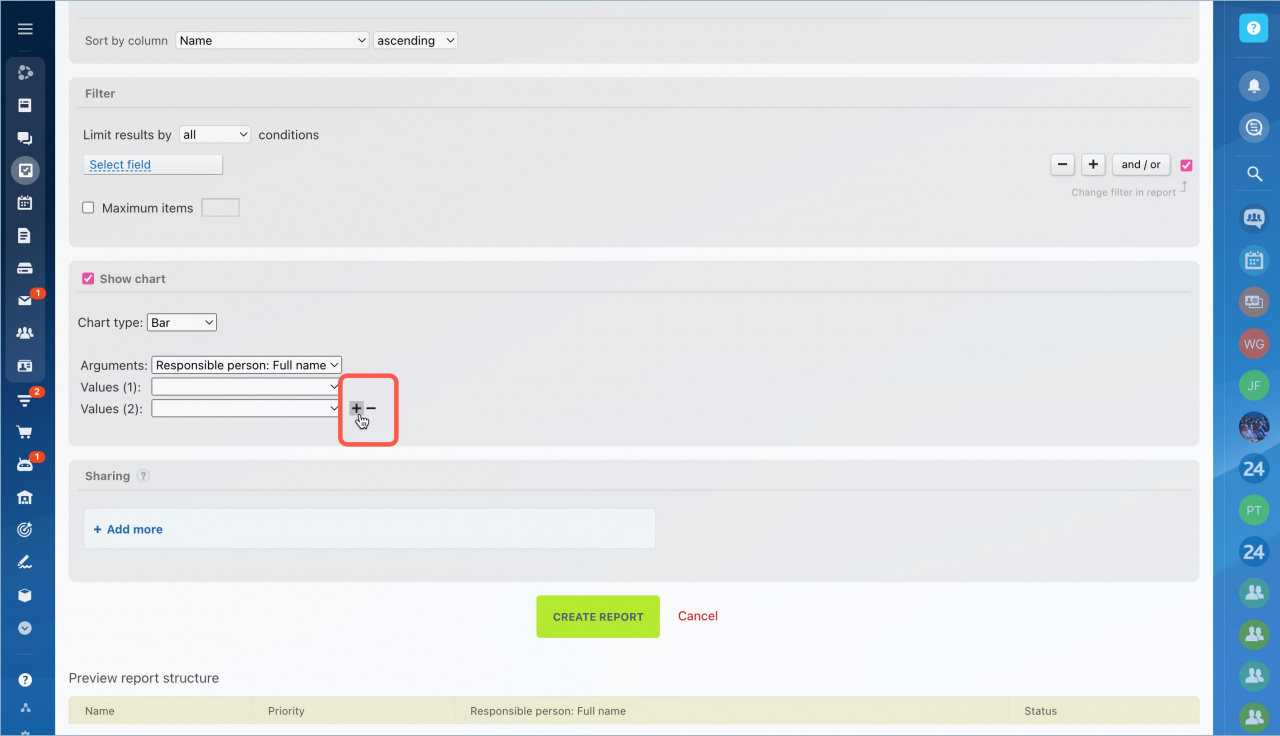
To add or remove values, hover the cursor next to the field and click + or - .
Configure access to the report
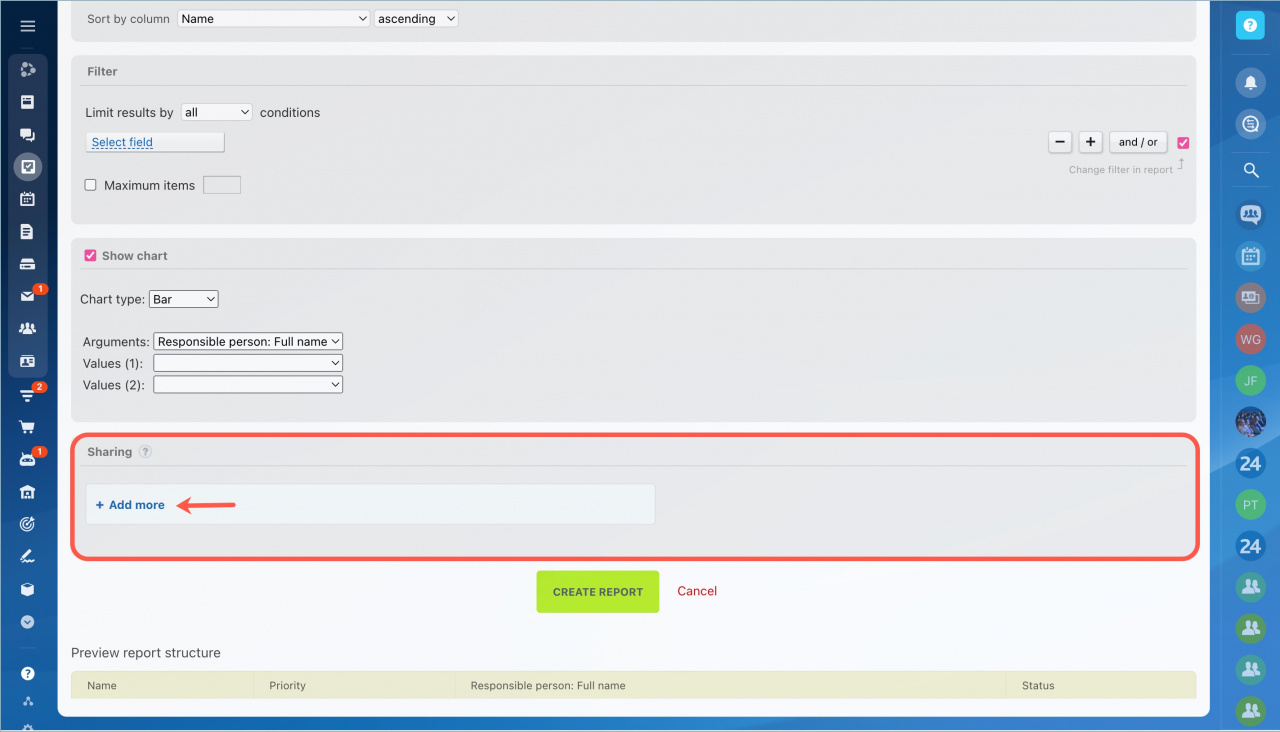
To share the report, click Add More and select an employee or a department from the list.
Read permissions will be automatically configured for all employees. Report templates will appear in the list of available templates for everyone you specify.
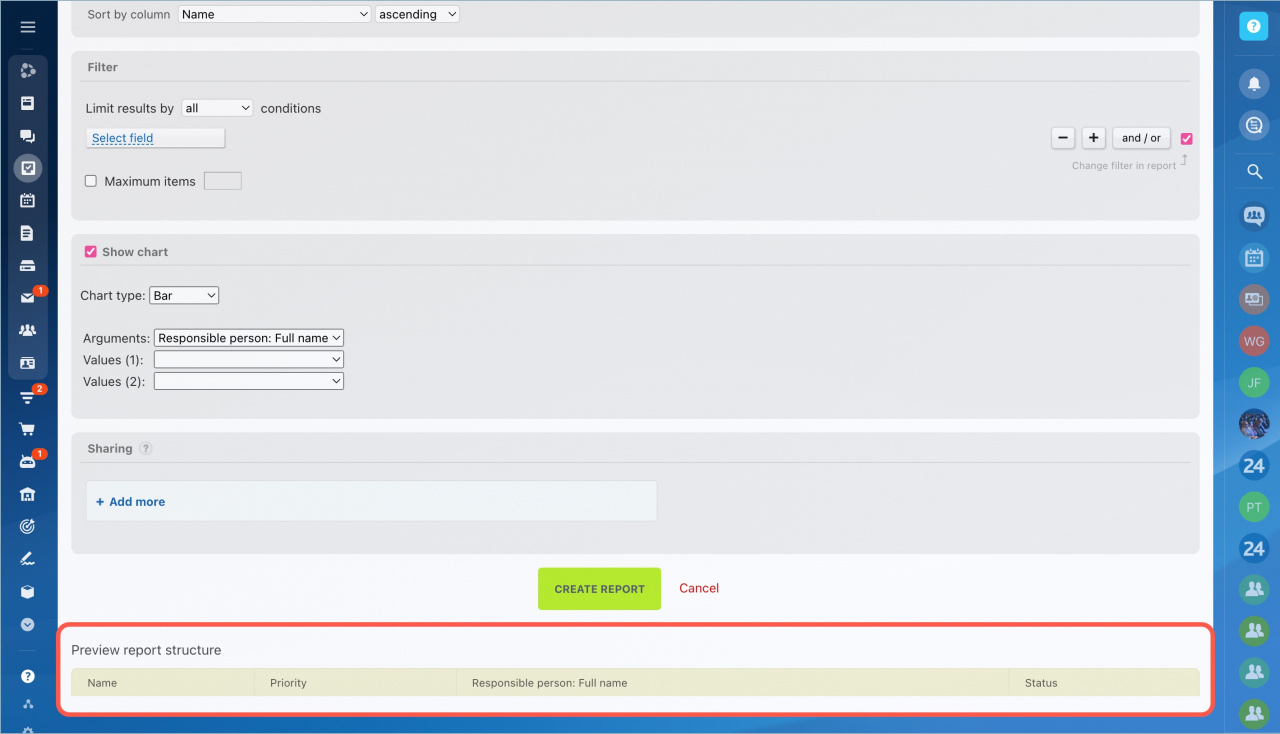
Preview report structure. You will see a preview of the report in this section. If all fields and values are configured correctly, click Create Report.
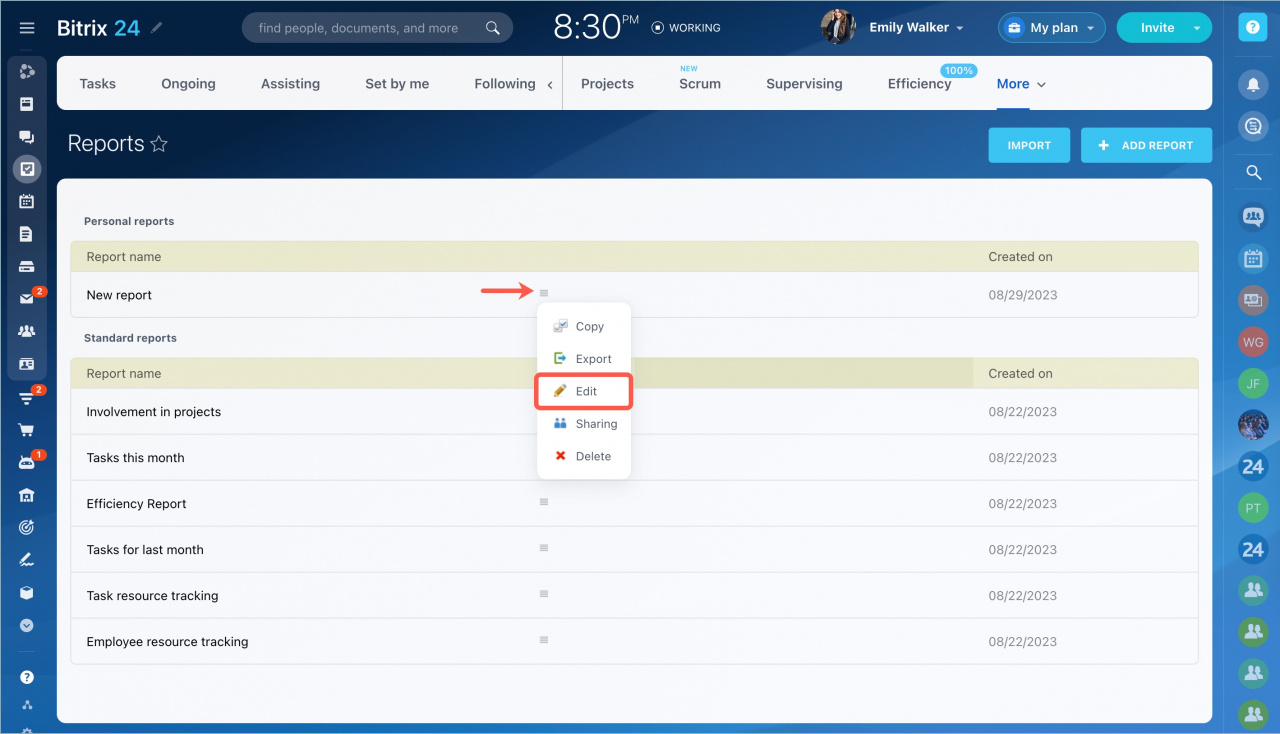
After creating personal reports, you can edit them. Select Edit in the action menu.
In brief
- The task report collects the required information for a certain period. The reports help the supervisor to evaluate employee efficiency.
- Filling out the report takes several steps: filling in the information, selecting data for the report and configuring filters.
- The numerical data can be converted into a graphical chart.
- Personal reports can be shared with colleagues.

