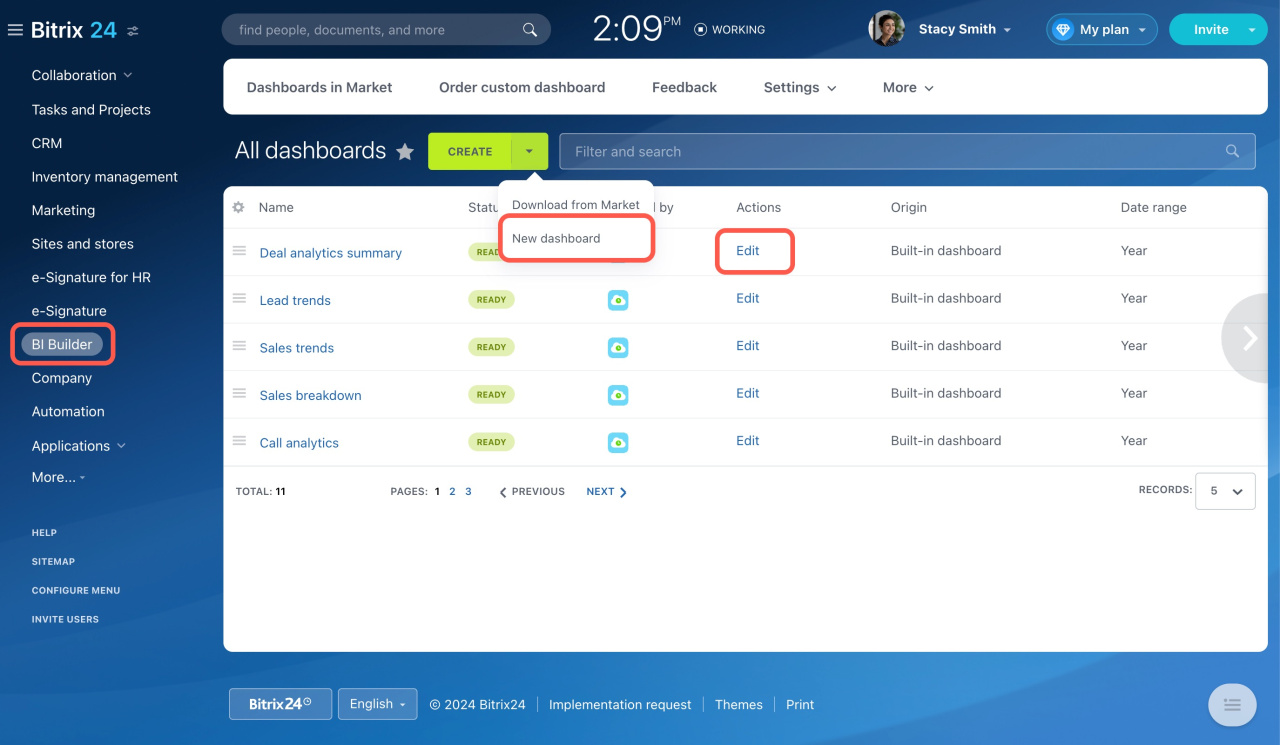
Go to the BI Builder section. Here, you can view all dashboards, edit them, or add new ones.
Explore the features of the BI Builder by integrating several new charts or tables into a built-in dashboard.
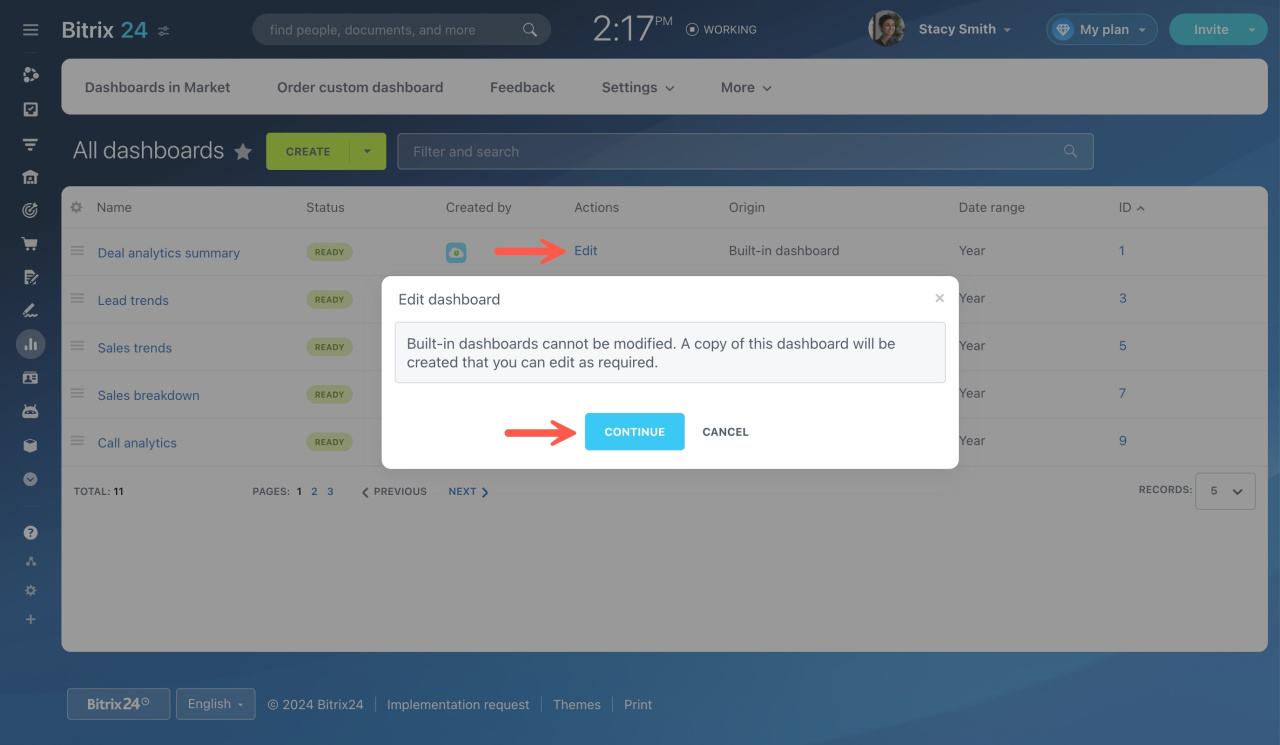
For example, let's configure the Deal analytics summary report. Click Edit under the Actions column, and Bitrix24 will create a copy that can be customized.
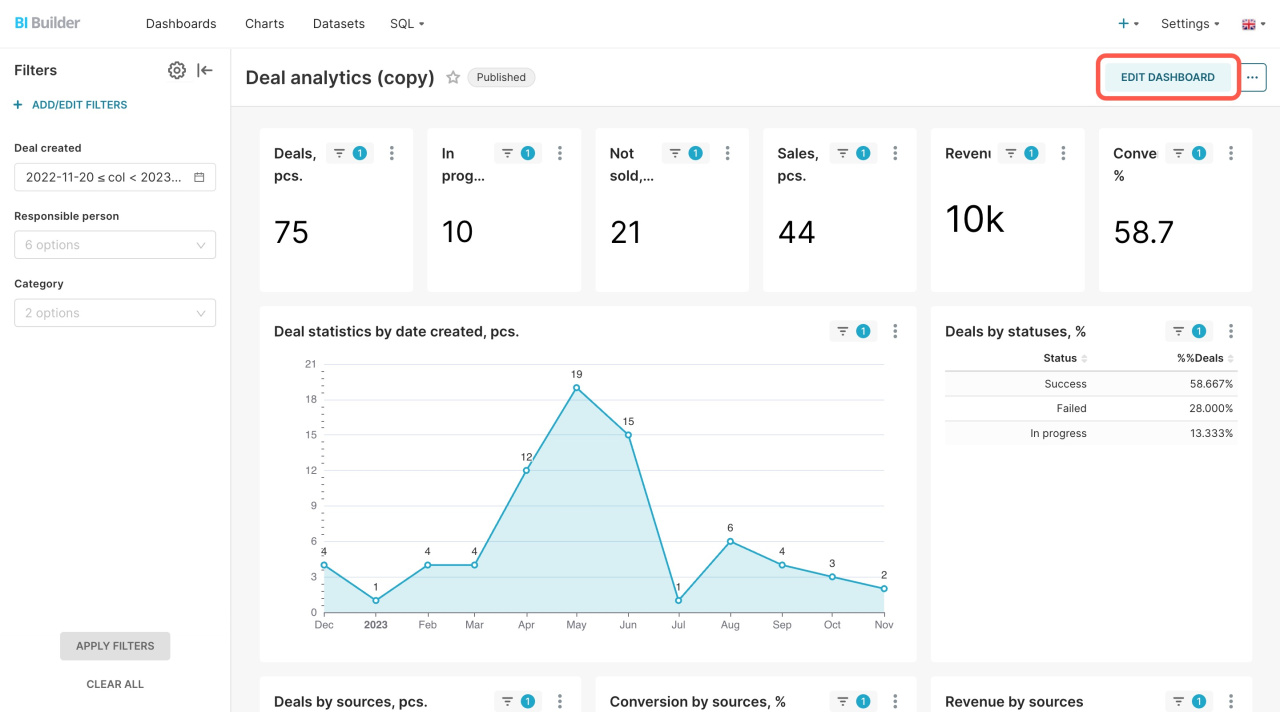
BI Builder opens in a new tab. To add other charts to your report, click Edit dashboard.
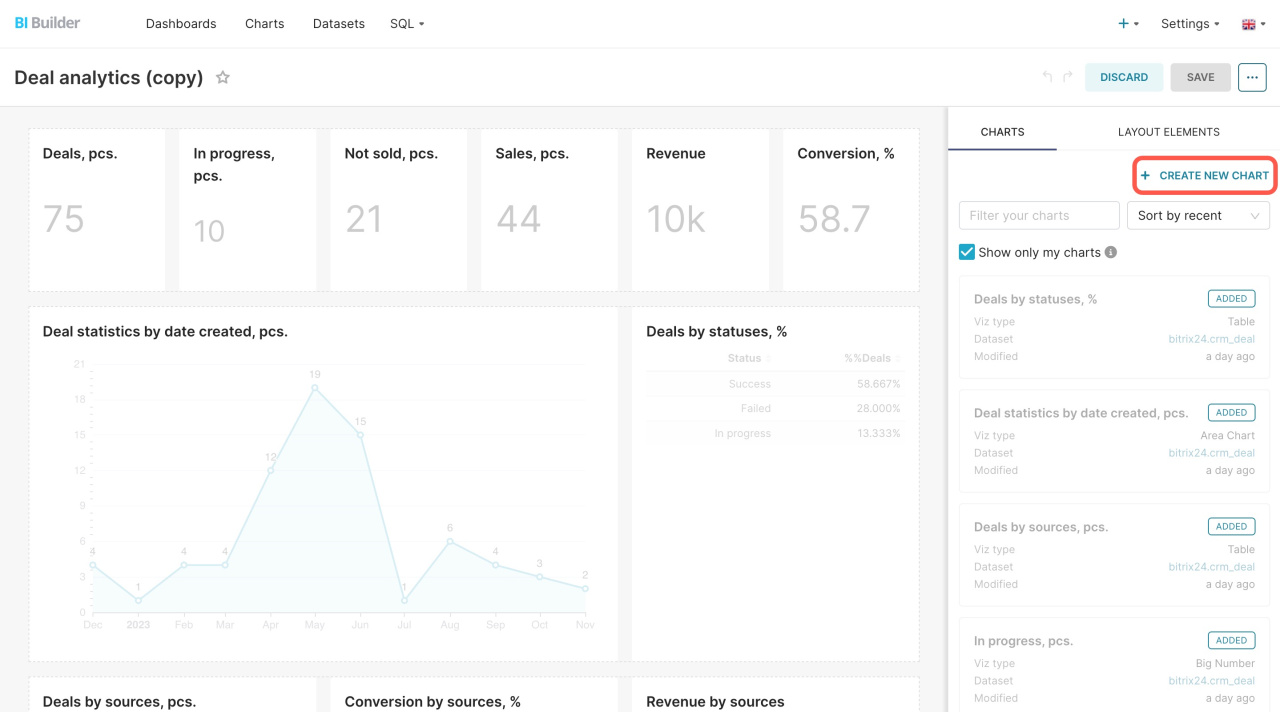
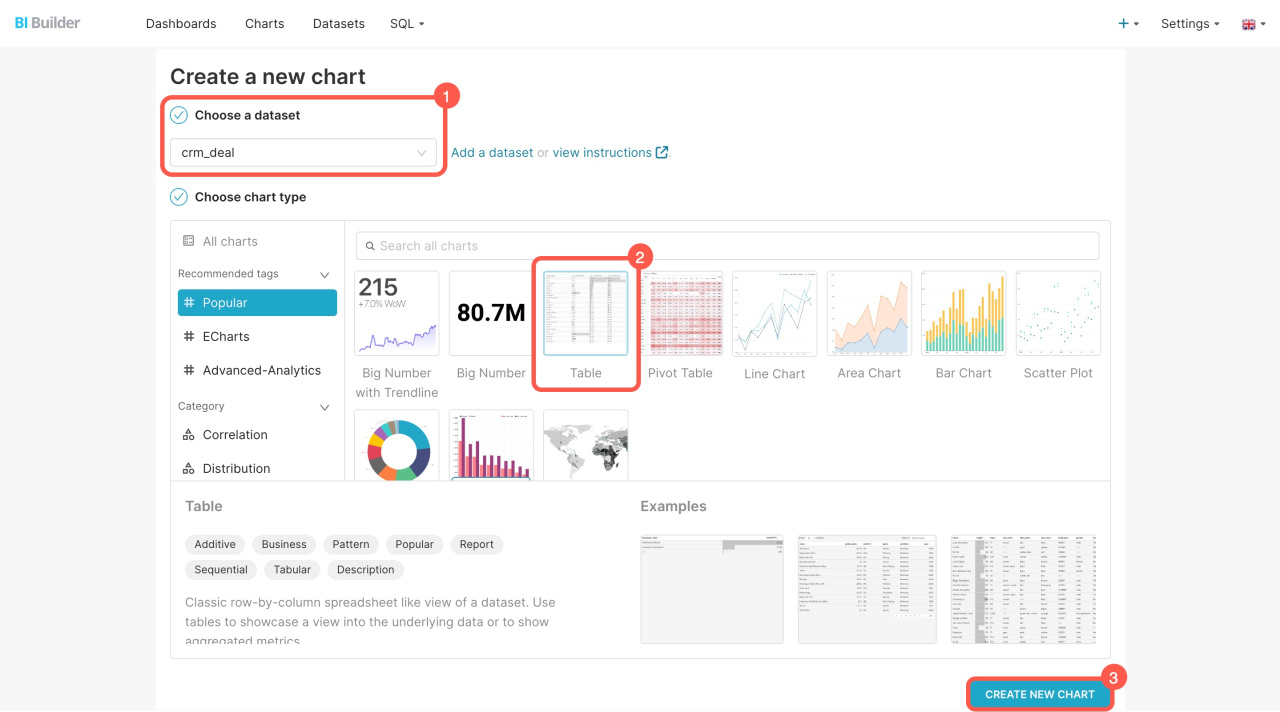
Then click + Create new chart. In our example, we add a table that shows the products sold with each deal.
Follow these steps to add a new chart:
- Select a datasetThe dataset represent the information on leads, deals, users, companies, and other entities. Learn more from Bitrix24.
- Specify the type of chart for presenting the data.
- Click Create new chart in the bottom right corner.
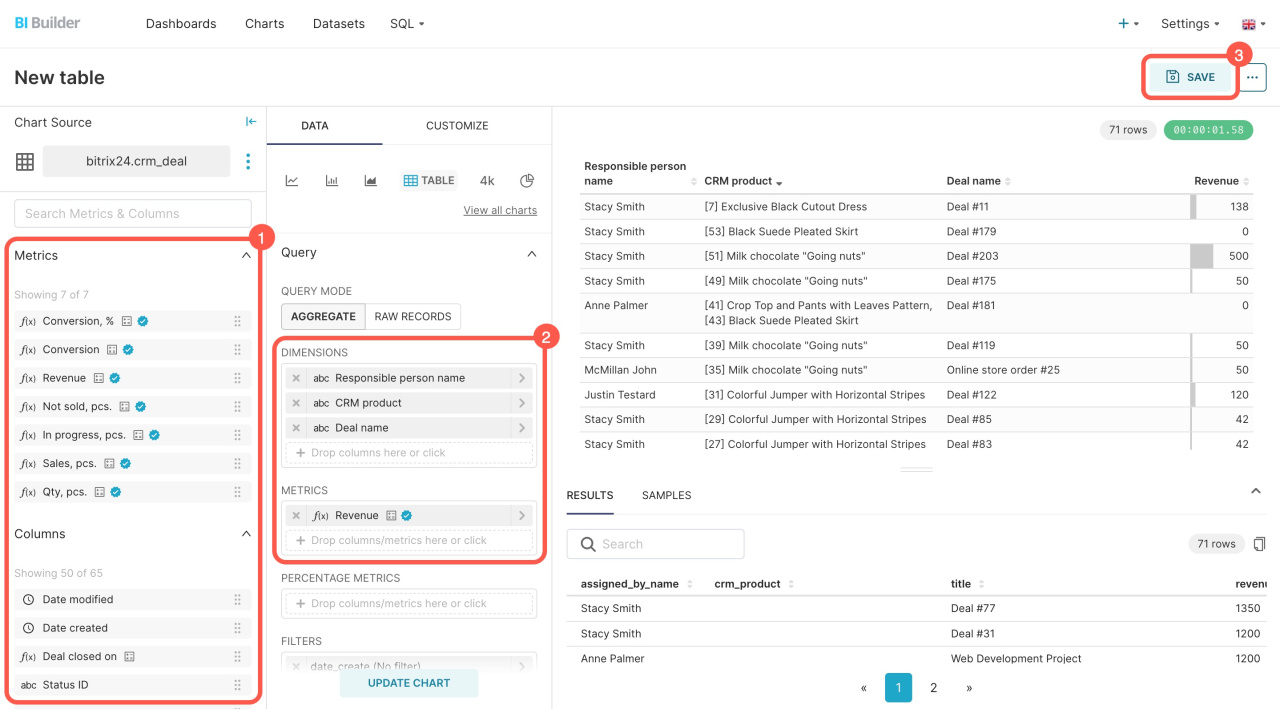
To configure the table, do the following:
- Select the needed indicators on the left.
- Move them to the Dimensions block.
- Save the table.
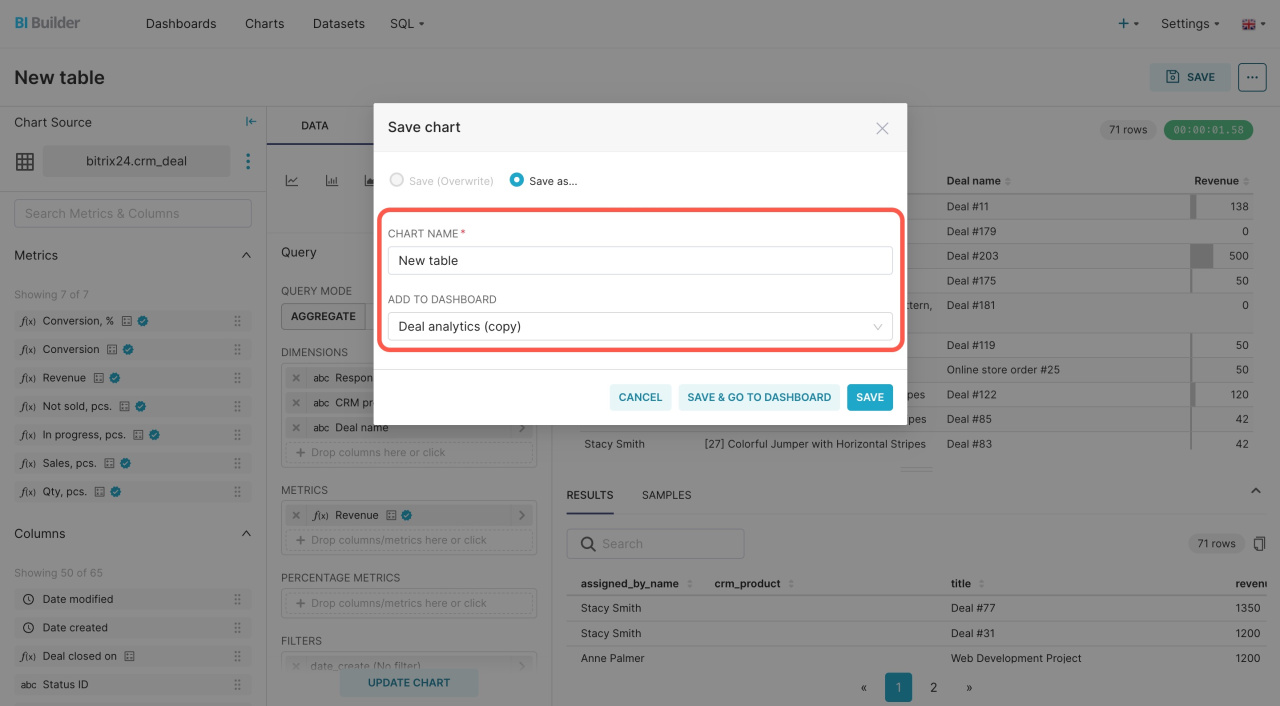
After that, specify the table name and select the dashboard where you want to add it.
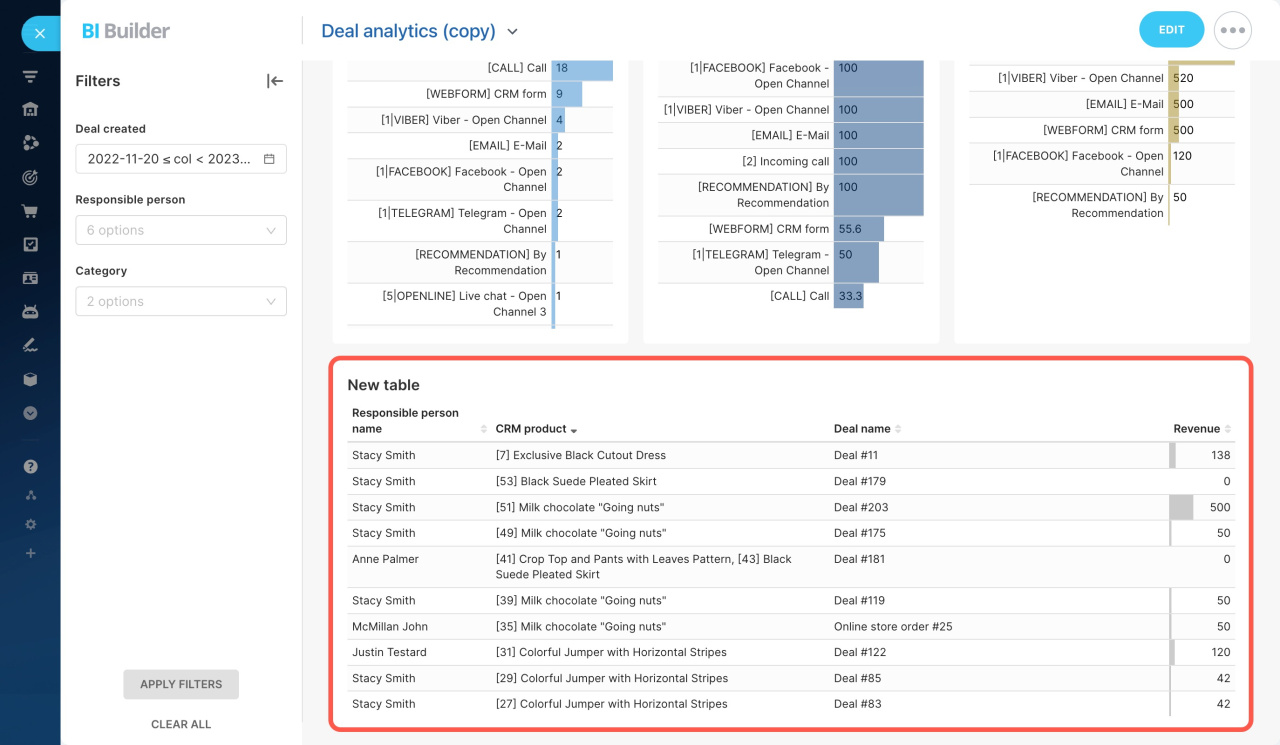
Open your customized dashboard in Bitrix24 to review the changes.
In brief
-
Edit or create reports according to your needs in the BI Builder section.
-
Explore the features of the BI Builder by integrating several new charts or tables into a built-in dashboard.

