Explore how to create a virtual dataset in which you can combine data on deals, products, and custom fields.
Open the BI Builder and go to SQL > SQL Lab.
Learn how to create dashboards in BI Builder

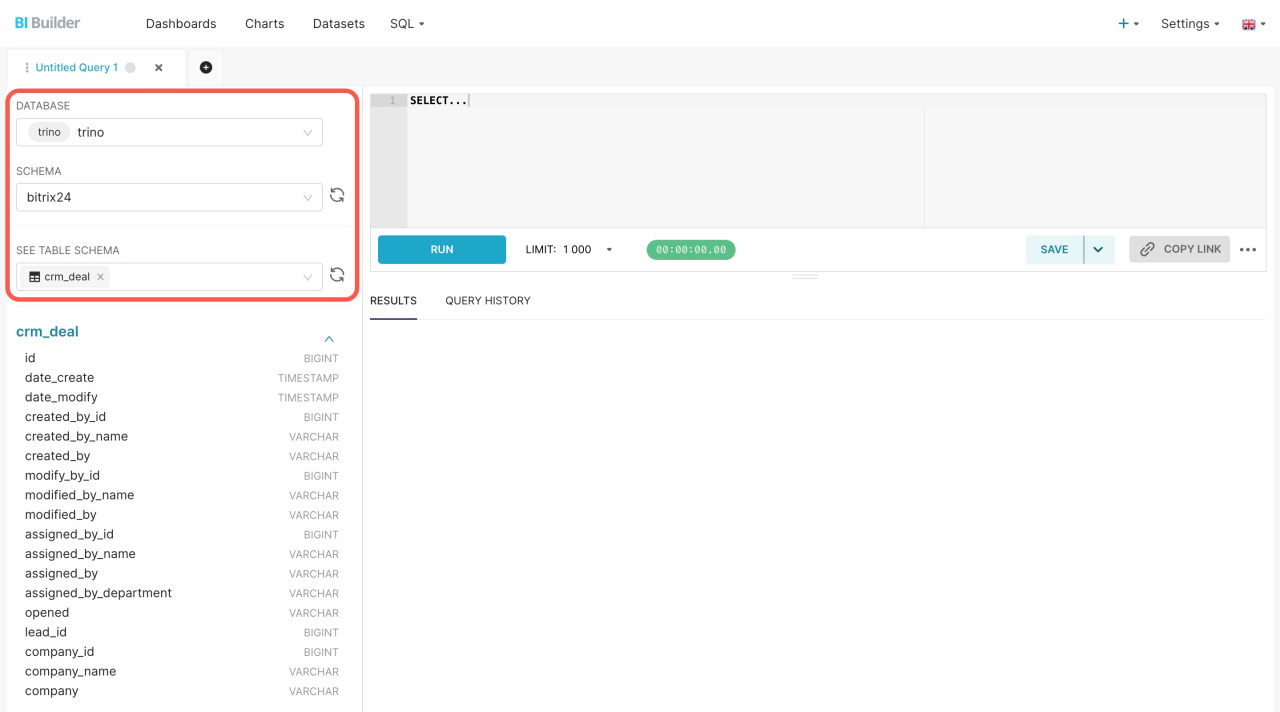
Fill in the following parameters:
-
The database is trino.
-
The scheme is bitrix24.
-
In the Table, select crm_deal.
Write an SQL query on the right. It performs four actions:
-
d.TITLE selects the deal name from
crm_deal. -
du.UF_CRM_1702288663142 selects a specific custom field from
crm_deal_uf. Specify the field ID from CRM. To view it, open a deal, right-click the field, and click Inspect. -
dp.PRODUCT_NAME selects the product name from
crm_deal_product_row. -
INNER JOIN connects tables by the common deal identifier
DEAL_ID.
SELECT d.TITLE, du.UF_CRM_1702288663142, dp.PRODUCT_NAME FROM crm_deal d INNER JOIN crm_deal_uf du ON d.ID = du.DEAL_ID INNER JOIN crm_deal_product_row dp ON d.ID = dp.DEAL_ID;
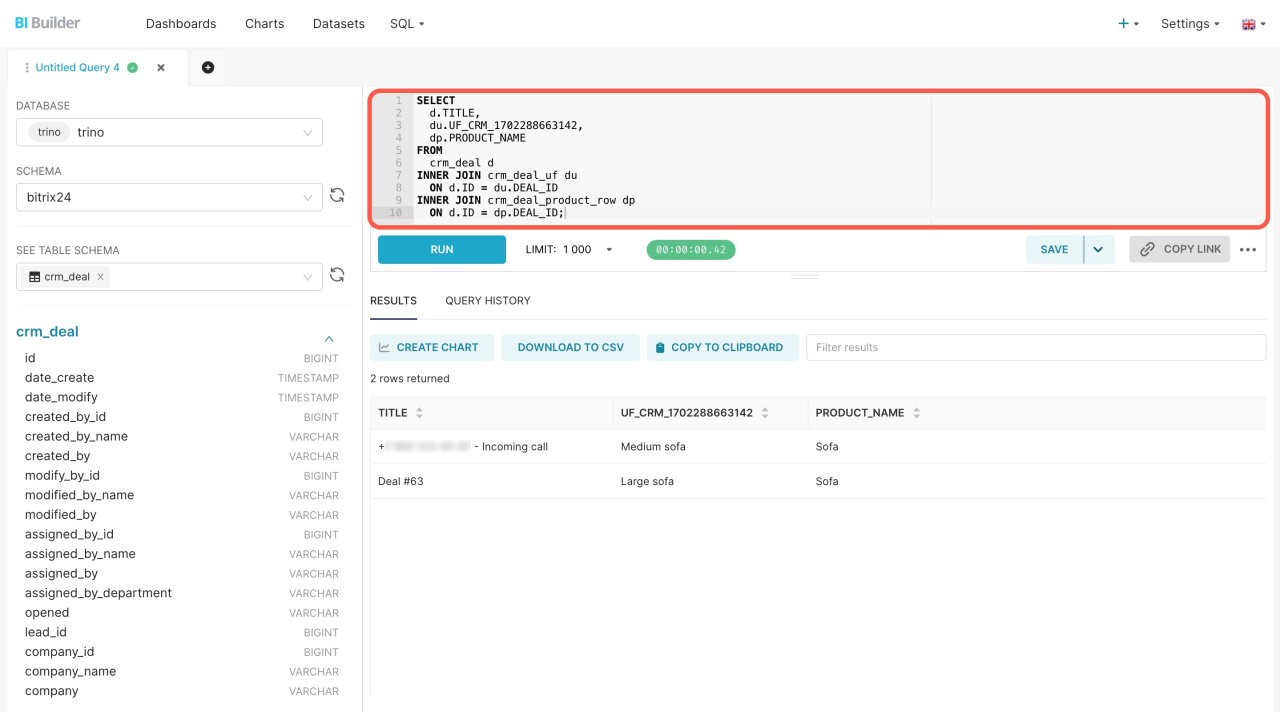
As a result, you'll get a unified dataset presenting the name of each deal, selected custom field values, and the added product names. When saving the dataset, click Save as new and give it a specific name.

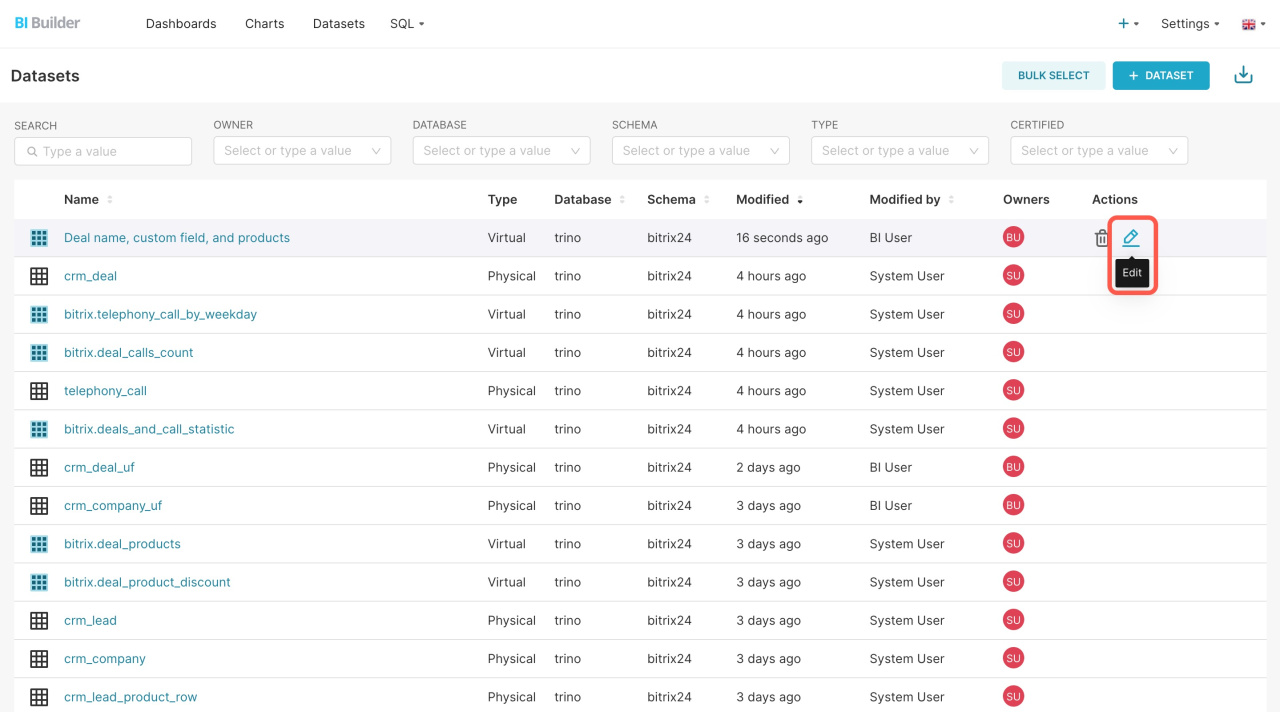
To make it clear what data is shown in the chart, edit the column names. Open the Datasets section and click Edit next to your dataset.
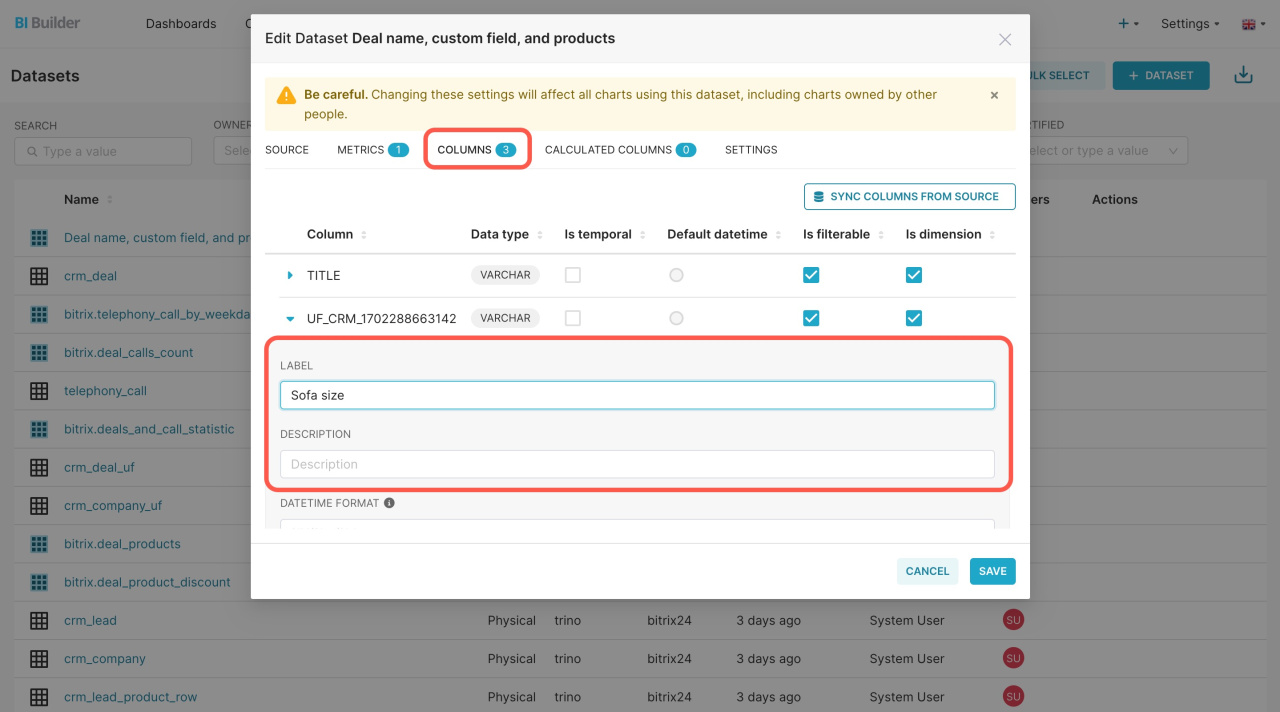
Open the Columns tab and specify new column names using the Label field.
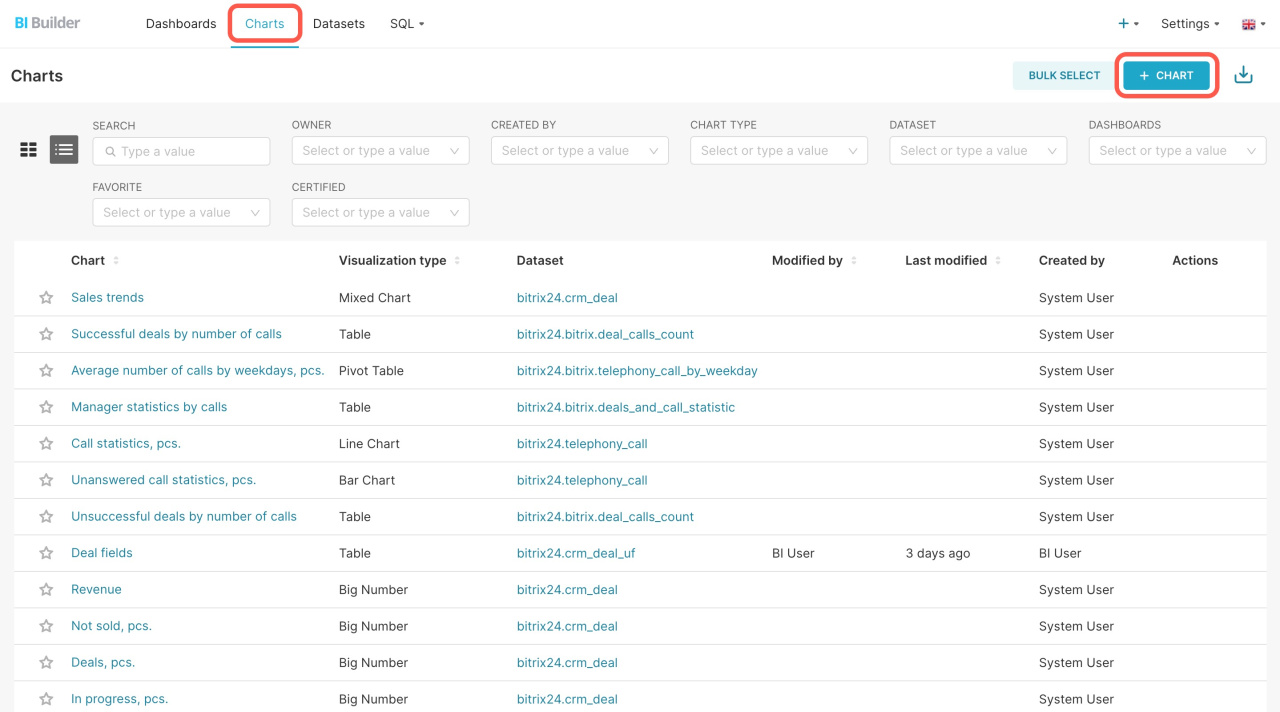
Then open the Charts section and click + Chart to add this data to your dashboard.
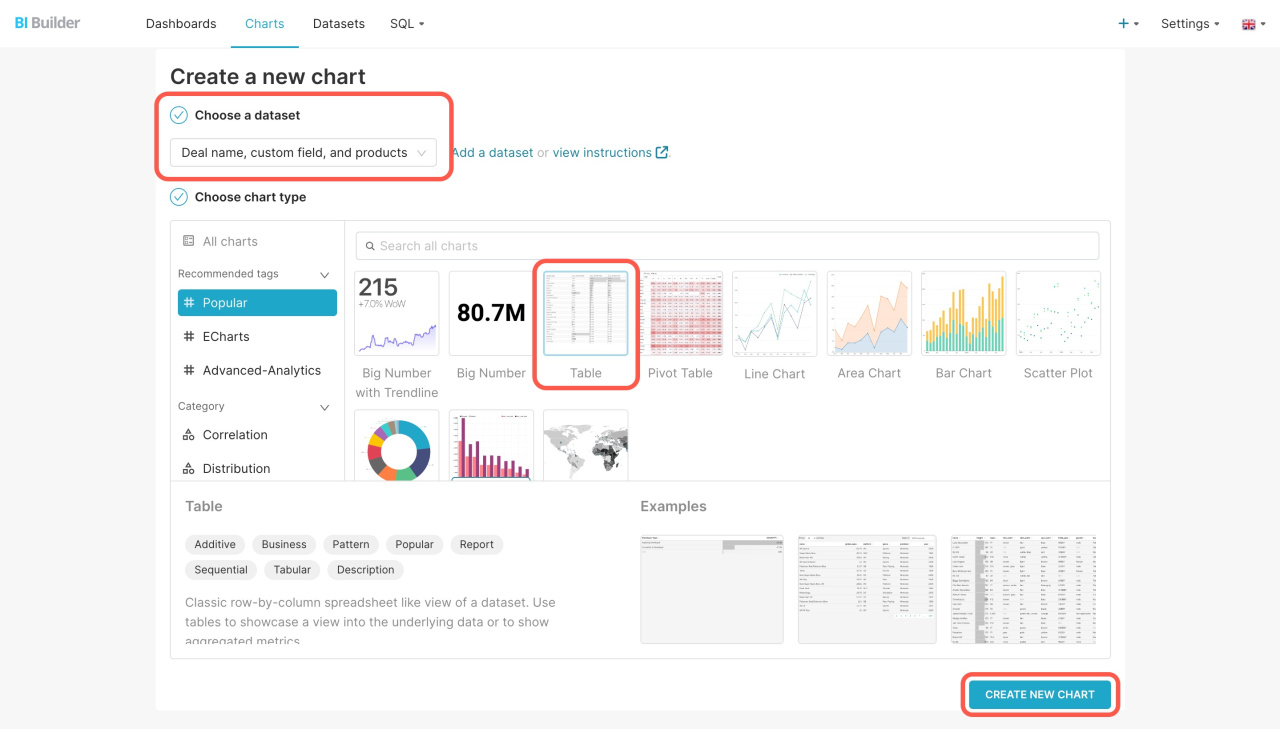
Pick your virtual dataset, specify how to present the information, and click Create new chart.
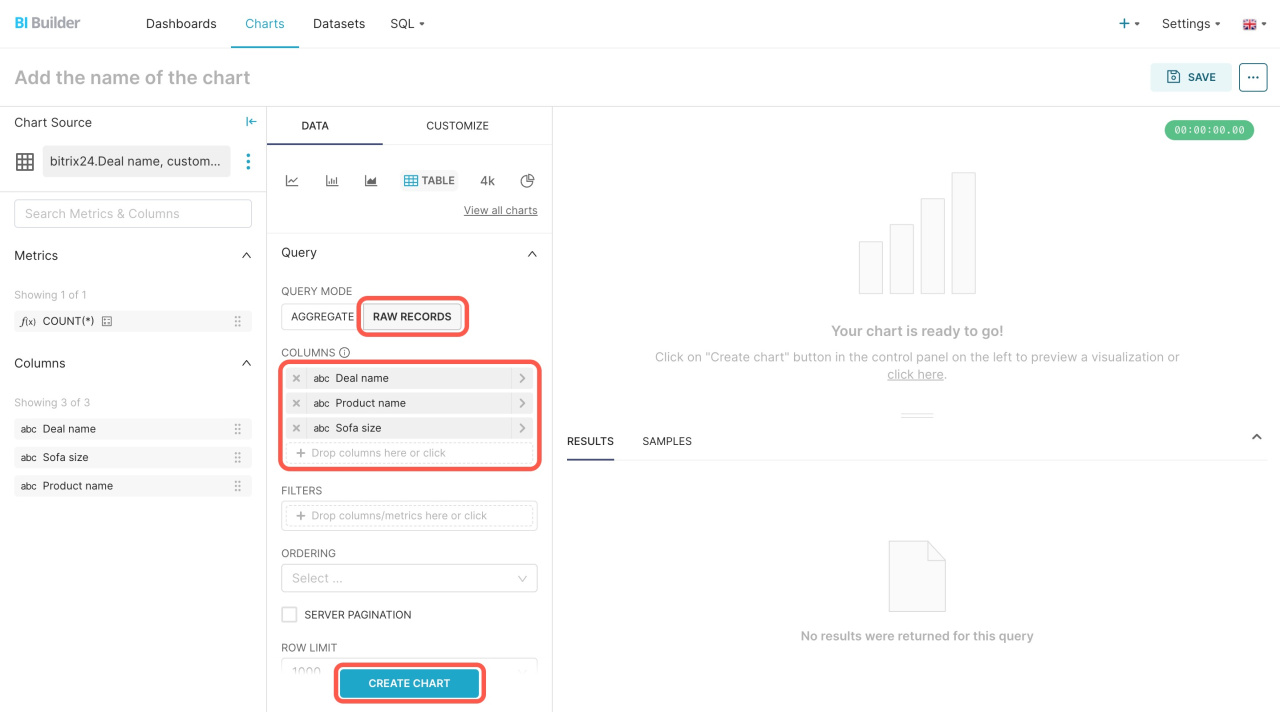
Select the Raw Records query mode, move the metrics to the Columns block on the left, and click Create chart.
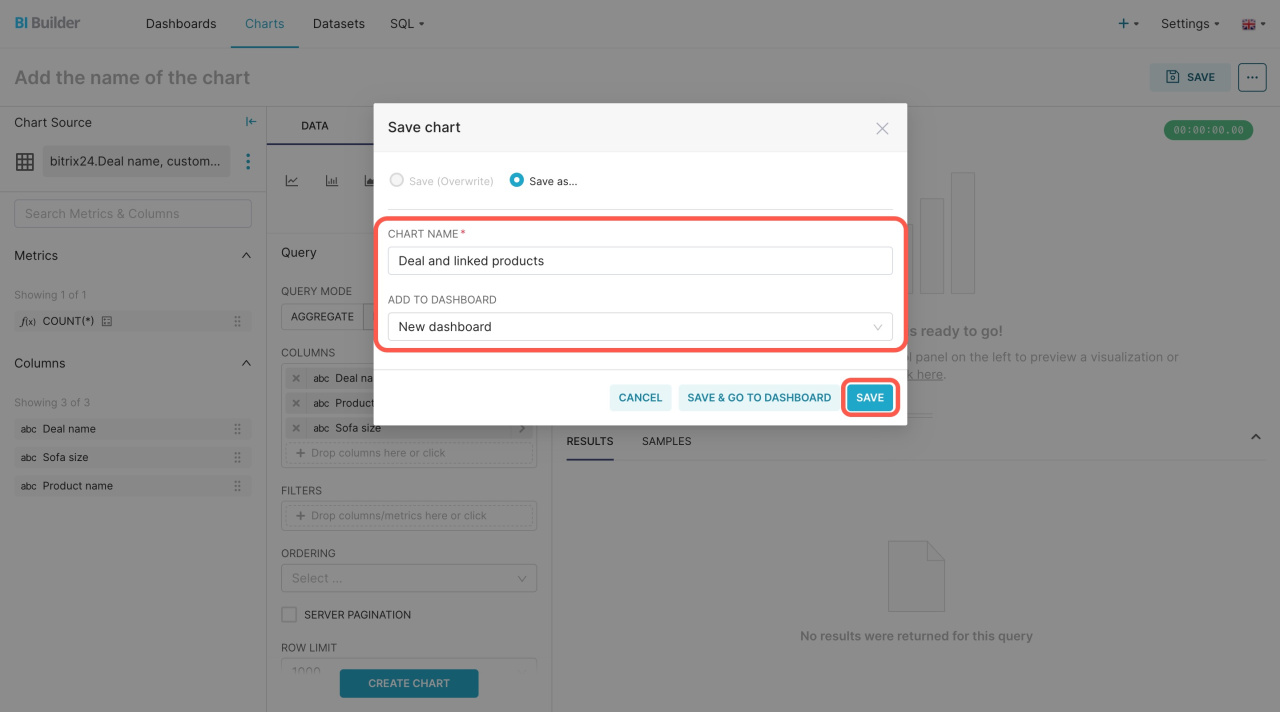
To save the chart, specify its name, select the dashboard, and click Save.
After saving the changes, go back to Bitrix24 and reopen the report.

In brief
-
Use the BI Builder to perform an SQL query and combine information from different sources into a virtual dataset.
-
Compose a query that selects specific information from various data sources, for example, deal name, linked products, and certain custom fields.
-
To make it clear what data is shown in the chart, edit the column names.