
A dataset contains information about leads, deals, companies, and other Bitrix24 elements. Each element has several datasets that pull data from system and custom fields. You can use datasets to create charts and analyze business metrics.
In this article, you'll learn about the calendar dataset. It helps you analyze calendar events, meeting attendees, event duration, employee availability, and meeting room usage..
Dataset:
Examples:
Choose a dataset
To analyze calendar data in a dashboard, select the appropriate dataset and create a chart.
Сalendar events — calendar_event. This dataset contains information from system fields of calendar events, such as start and end times, duration, organizer, location, and recurring events. Use it to track the number and duration of meetings, employee availability, and meeting room usage.
calendar_event
| Field | Description | Data type |
|---|---|---|
| ID | Event record ID | Number |
| PARENT_ID | Main event record ID | Number |
| IS_MASTER |
Main event record: Y — yes, N — no. When a meeting has attendees, the dataset contains one main meeting record and a separate record for each attendee
|
String |
| NAME | Event name | String |
| EVENT_TYPE | Event type: a regular event, a meeting booked via a public link, via a CRM link or via a collab link, a collab event, a call, a booking or a resource booking | String |
| CALENDAR_TYPE | Calendar where the event was created: personal, project, or company calendar | String |
| OWNER_ID | Calendar owner ID | Number |
| CREATED_BY_ID | ID of the user who created the event record | Number |
| CREATED_BY_NAME | First and last name of the user who created the event record | String |
| CREATED_BY | ID and name of the user who created the event record | String |
| MEETING_HOST_ID | Meeting organizer ID | Number |
| MEETING_HOST_NAME | Meeting organizer's first and last name | String |
| MEETING_HOST | Meeting organizer's ID and name | String |
| IS_MEETING |
Meeting with attendees: Y — yes, N — no
|
String |
| MEETING_STATUS | Invitation response status: host, accepted, declined, no response, or not set | String |
| DATE_FROM | Event start date and time | Date and time |
| DATE_TO | Event end date and time | Date and time |
| TIMEZONE_FROM | Event time zone | String |
| TIMEZONE_OFFSET | Event time zone offset from UTC, in seconds | Number |
| DURATION | Event duration, in seconds | Number |
| IS_FULL_DAY |
All-day event: Y — yes, N — no
|
String |
| IS_RECURRING |
Recurring event: Y — yes, N — no
|
String |
| RECURRENCE_RULE | How often the event repeats: daily, weekly, monthly, or yearly | String |
| IS_RECURRENCE_EXCEPTION |
Modified occurrence of a recurring event: Y — yes, N — no
|
String |
| ACCESSIBILITY | How the event occupies time in the calendar: busy, free, undecided, or absent | String |
| IMPORTANCE | Event priority: normal, high, low, or not set | String |
| IS_PRIVATE |
Private event: Y — yes, N — no
|
String |
| LOCATION | Event location | String |
| LOCATION_TYPE | What the location of the event is set by: a meeting room of the calendar, a meeting room of the old type, free text, or not set | String |
| LOCATION_ROOM_ID | ID of the meeting room reserved for the event | Number |
| LOCATION_ROOM_NAME | Name of the meeting room reserved for the event | String |
| DATE_CREATE | Event creation date and time | Date and time |
| TIMESTAMP_X | Date and time the event was last updated | Date and time |
Create a chart
Use the calendar dataset to create charts that show meeting counts, duration, employee availability, and meeting room usage. For example, you can compare how many meetings each employee organizes and how much time they spend in those meetings.
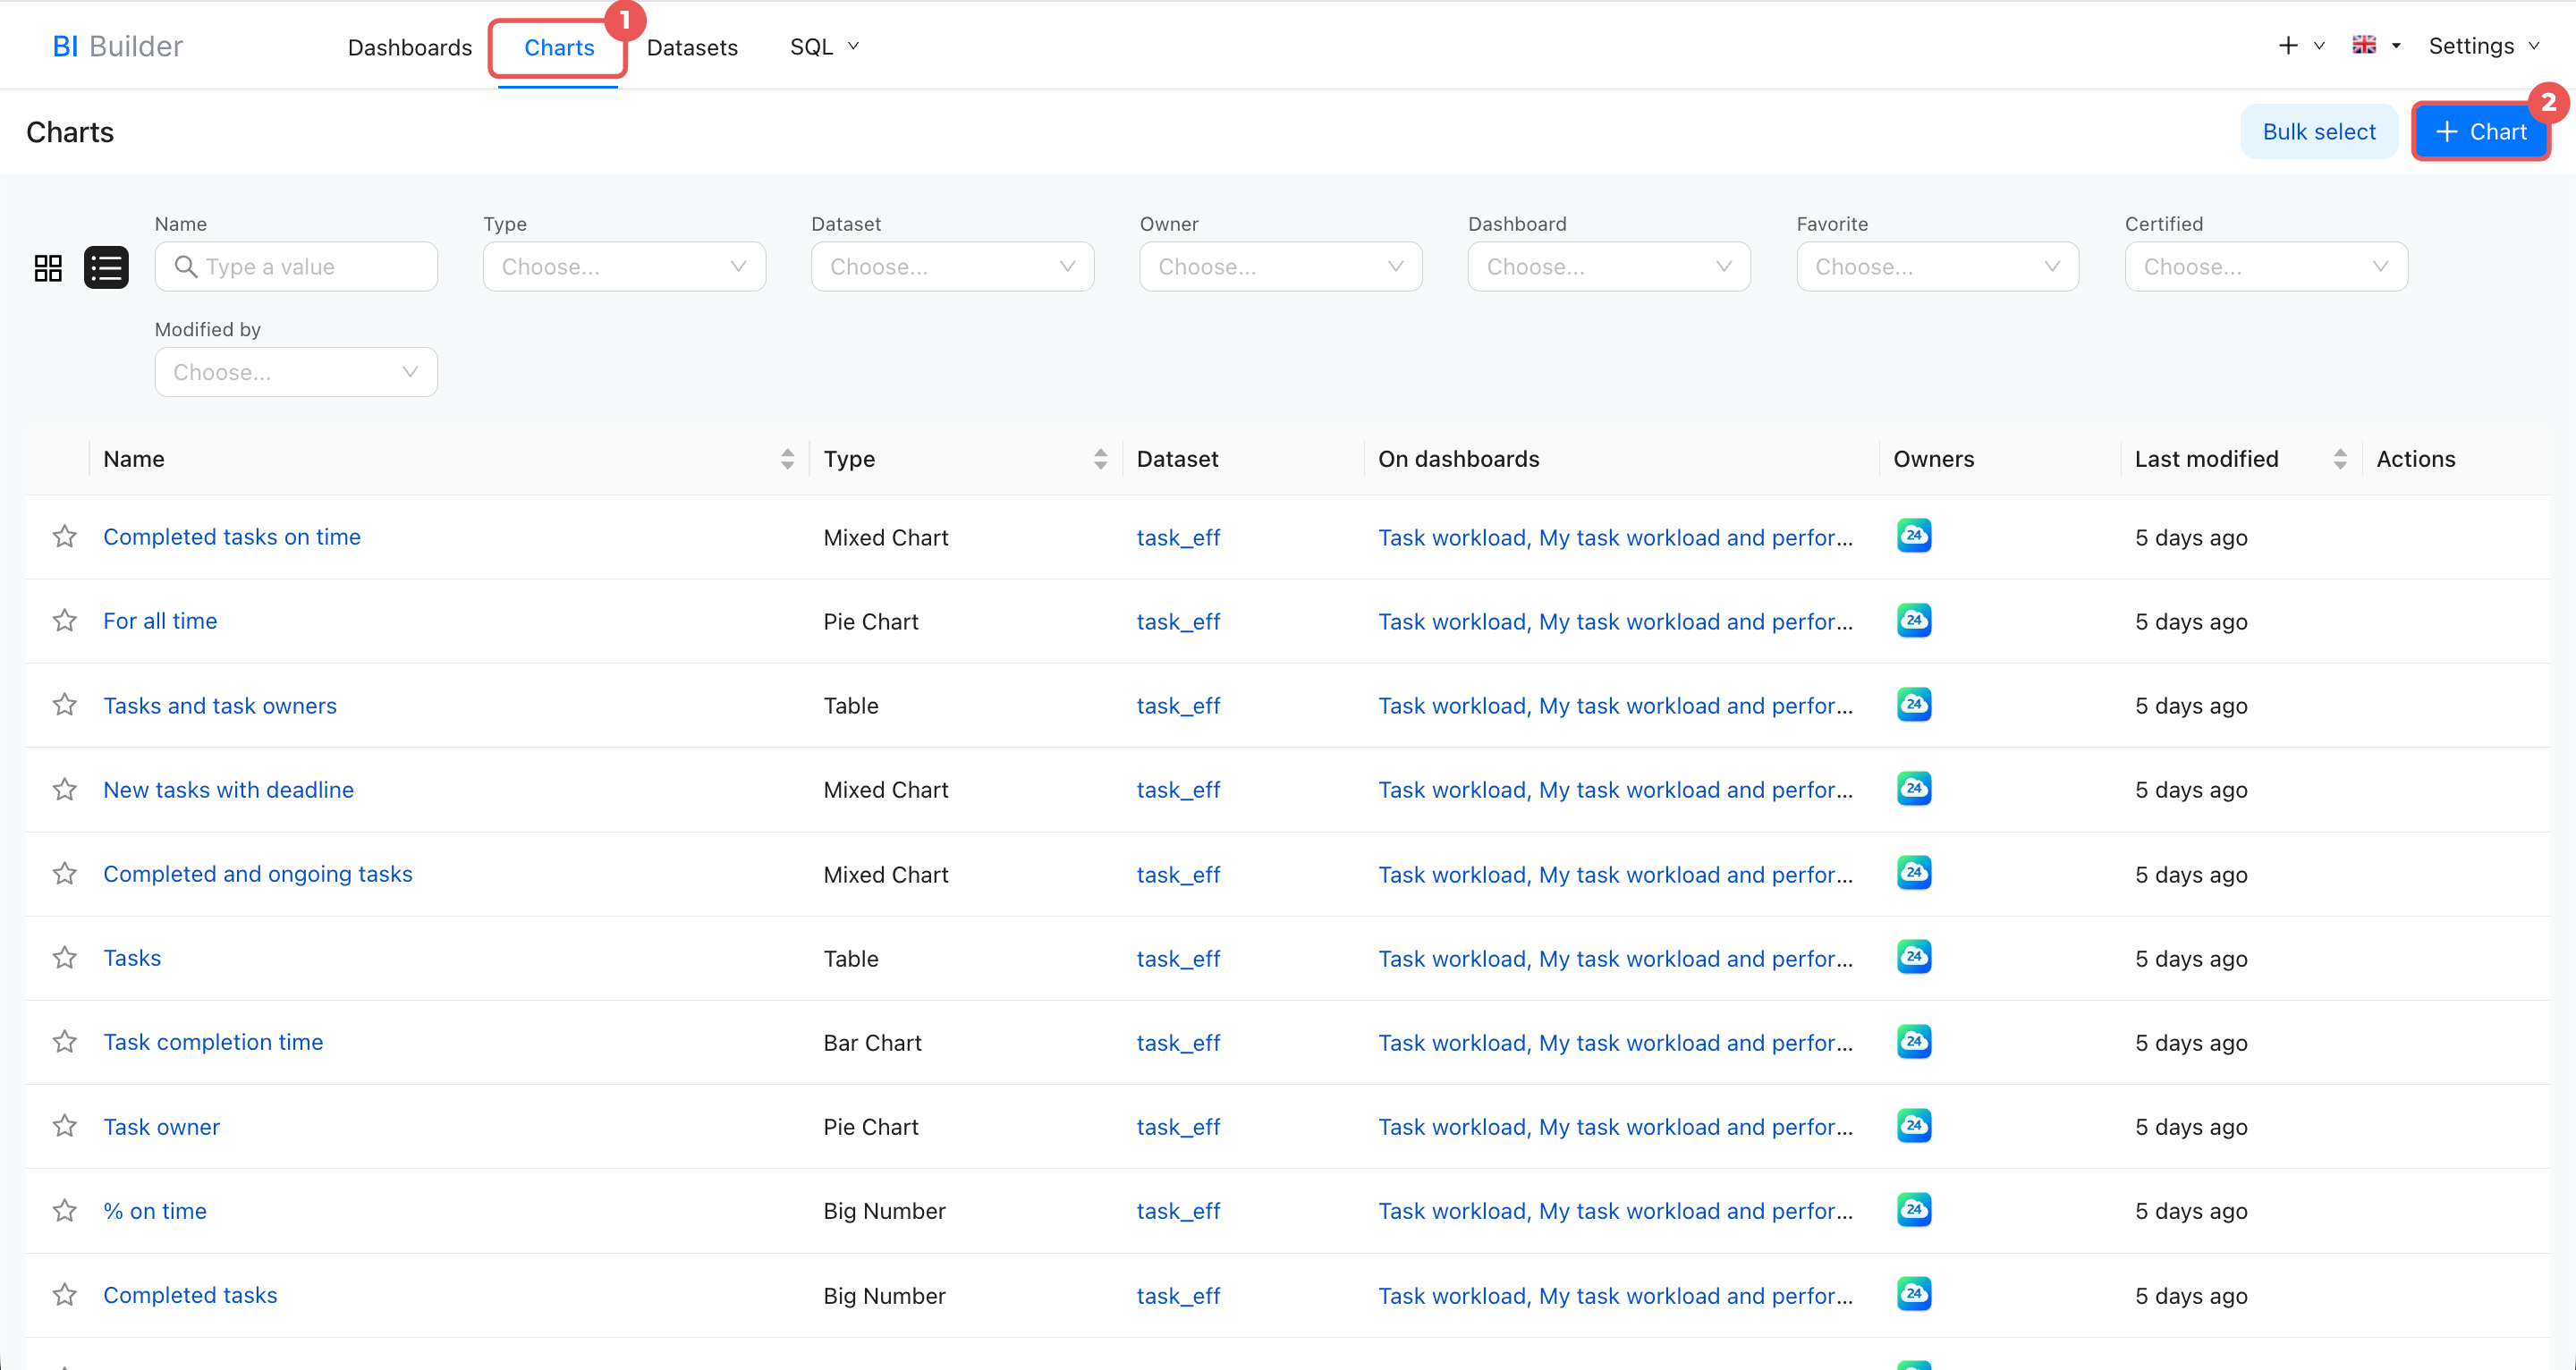
- Open BI Builder > Charts.
- Click + Chart.
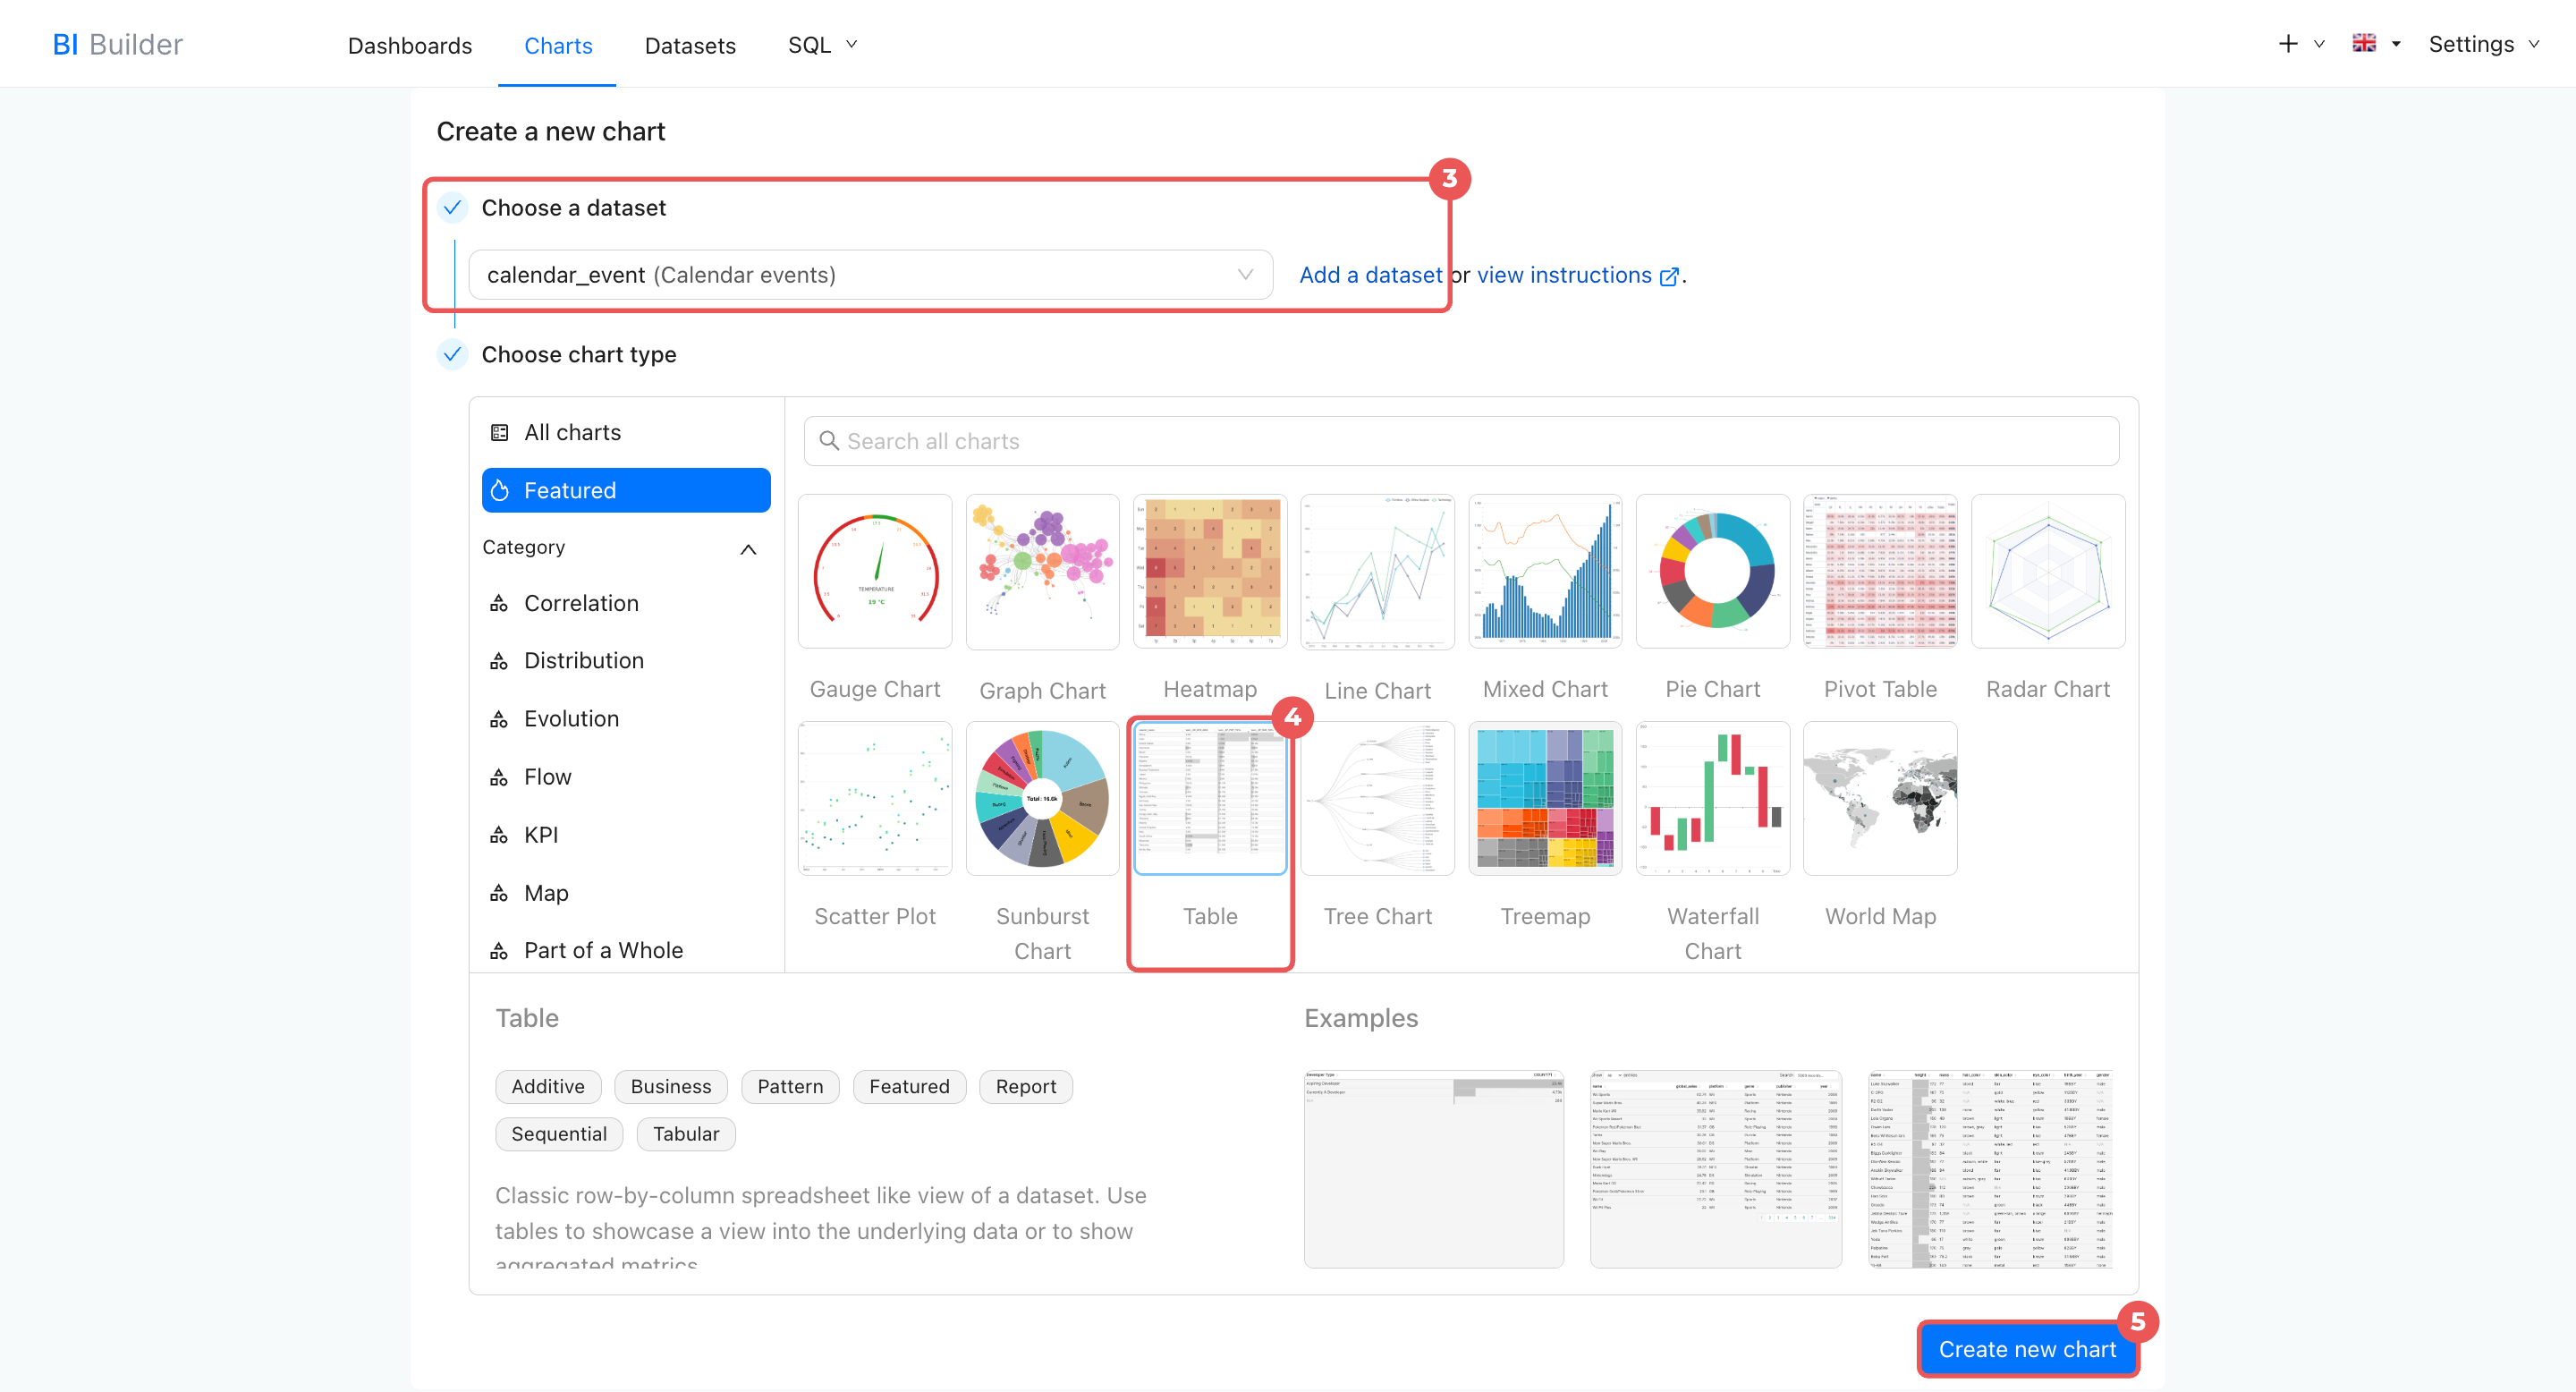
- Select the calendar_event dataset.
- Choose a visualization type, such as a chart, table, or another option.
- Click Create chart.
Count meetings and their duration
Use a SQL query to see how many meetings each employee organizes and their total duration.
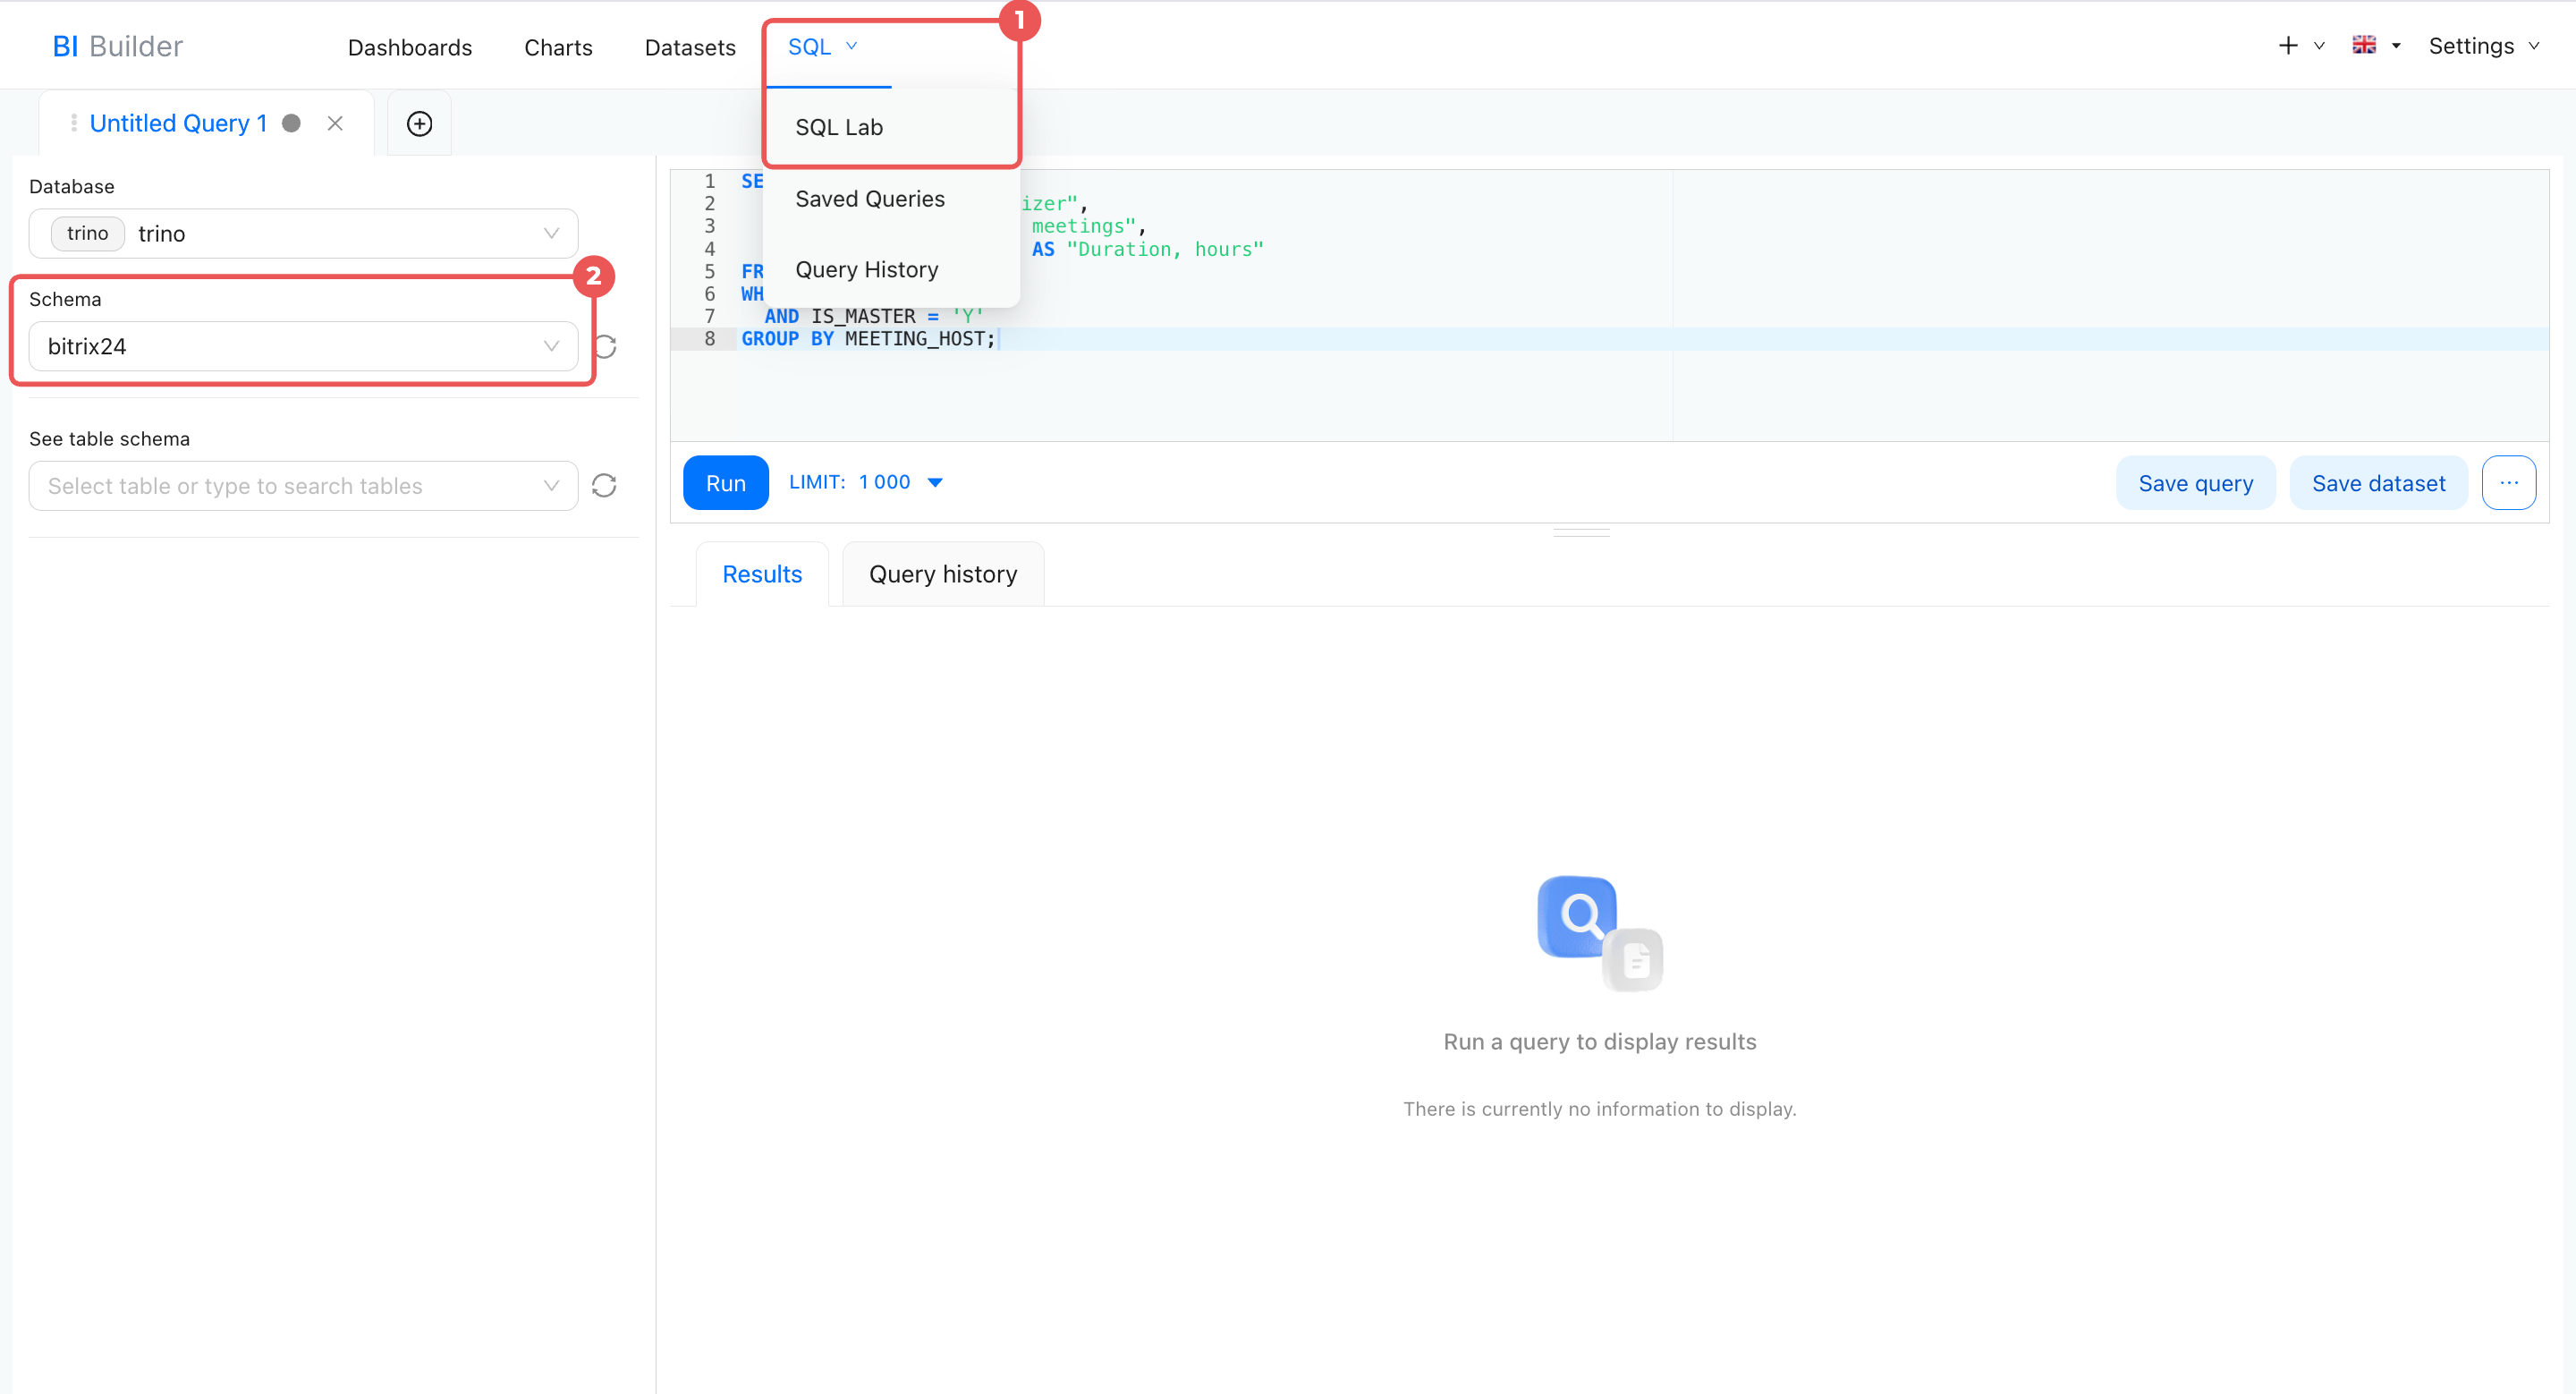
- Open BI Builder > SQL > SQL Lab.
- Make sure the Schema field is set to
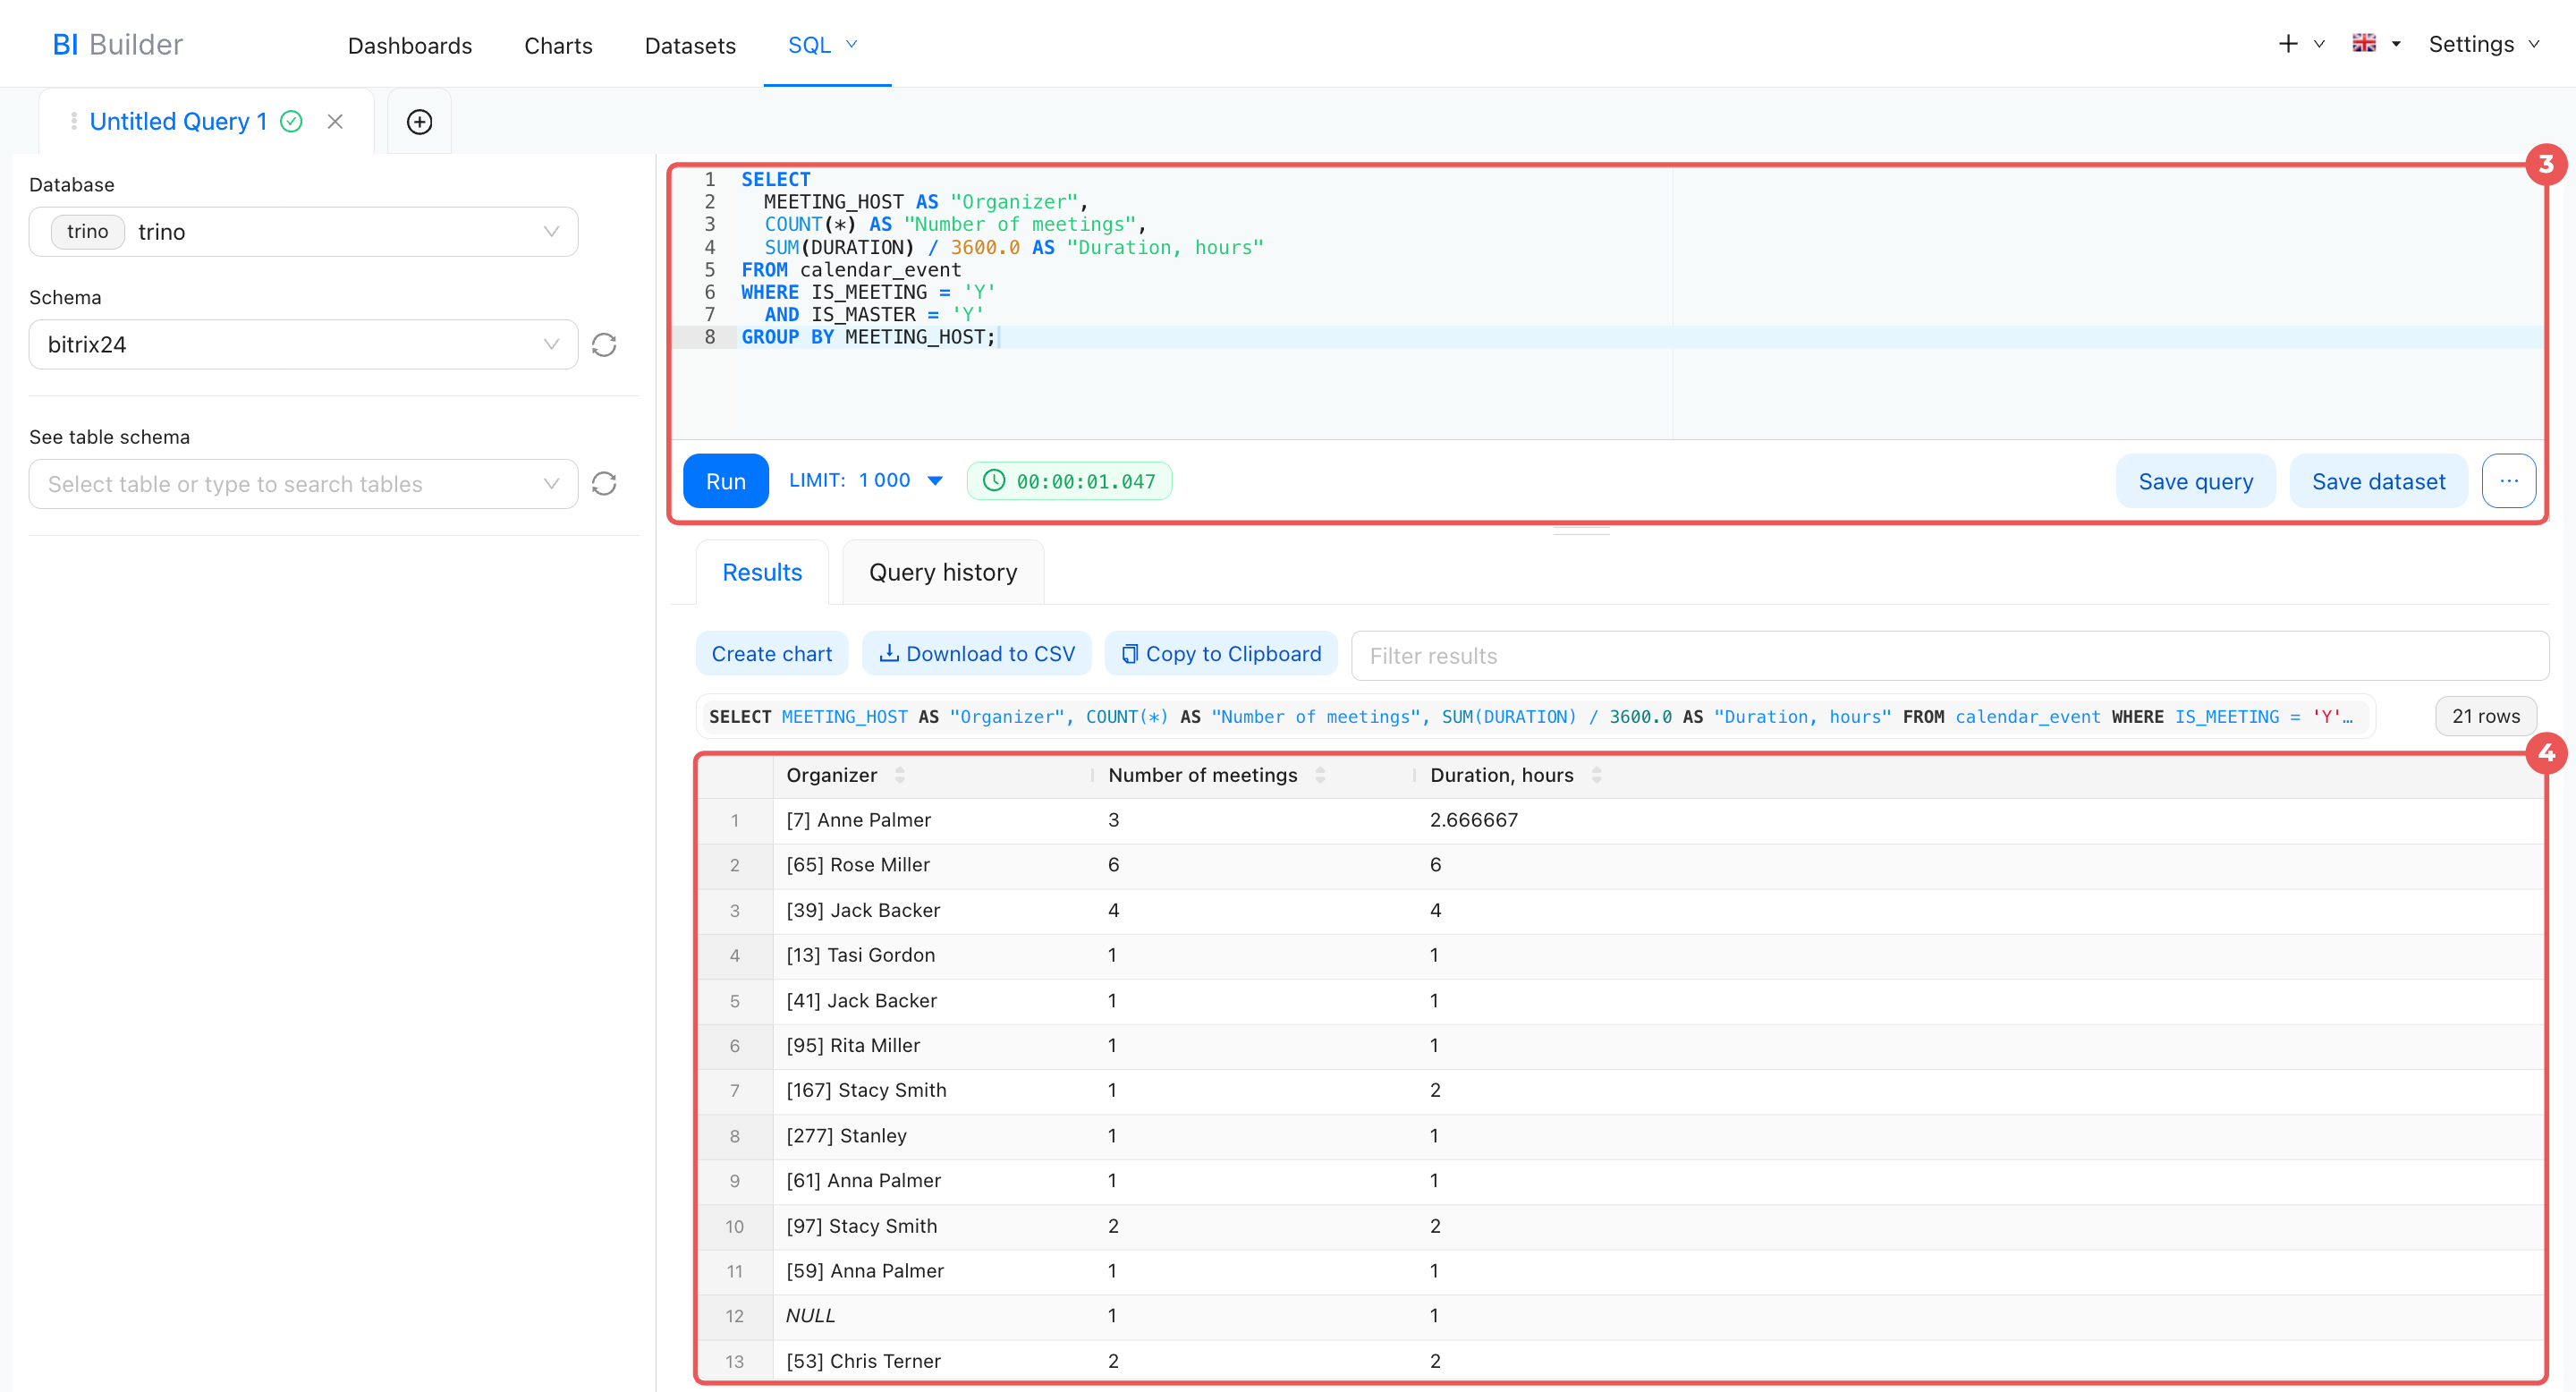
bitrix24. - Enter the SQL query and click Run.
- Review the results. To use them in a dashboard, save the query as a dataset.
If you're new to SQL, you can use the example below.
Sample SQL query
This query counts meetings by organizer and calculates their total duration in hours.
 SELECT
  MEETING_HOST AS "Organizer",
  COUNT(*) AS "Number of meetings",
  SUM(DURATION) / 3600.0 AS "Duration, hours"
FROM calendar_event
WHERE IS_MEETING = 'Y'
  AND IS_MASTER = 'Y'
GROUP BY MEETING_HOST;
In the query:
SELECTdefines the information to display: meeting organizer, number of meetings, and total duration.MEETING_HOSTreturns the organizer's ID and name.COUNT(*)counts the meetings.SUM(DURATION) / 3600.0adds up meeting durations and converts seconds to hours.FROMidentifies the calendar_event dataset.WHEREfilters the data to include only meetings with attendees and their main records.IS_MEETING = 'Y'includes only meetings with attendees.IS_MASTER = 'Y'excludes attendee records to avoid counting the same meeting more than once.GROUP BY MEETING_HOSTgroups meetings by organizer, with one row for each organizer.
For recurring meetings, the query counts the entire series as one meeting. If someone edits a single occurrence, the query counts it as a separate meeting.
In brief
- Datasets provide information you can use to create charts and analyze business metrics.
- The calendar_event dataset contains calendar event data.
- Use it to analyze meeting counts, duration, employee availability, and meeting room usage.
- To count meetings by organizer, run a SQL query, save it as a dataset, and create a chart.