In this article, we take a look at lead reports.
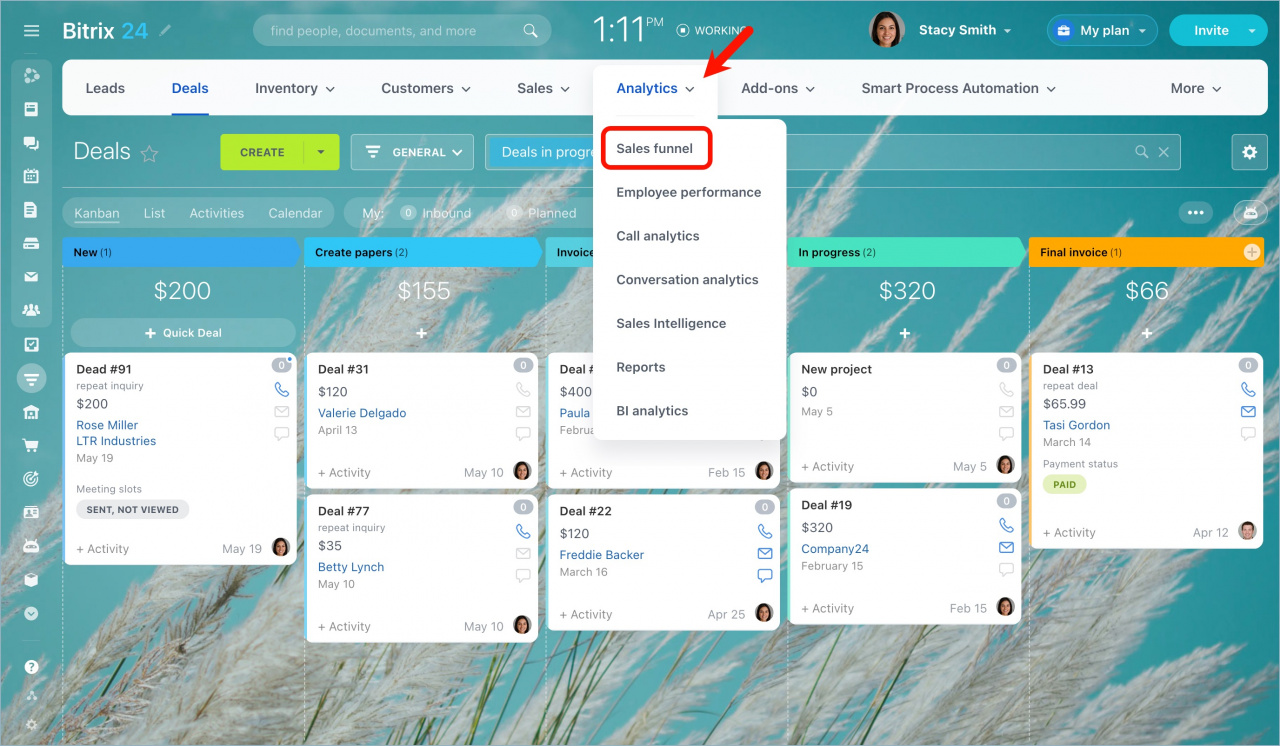
Go to CRM > Analytics > Sales funnel.
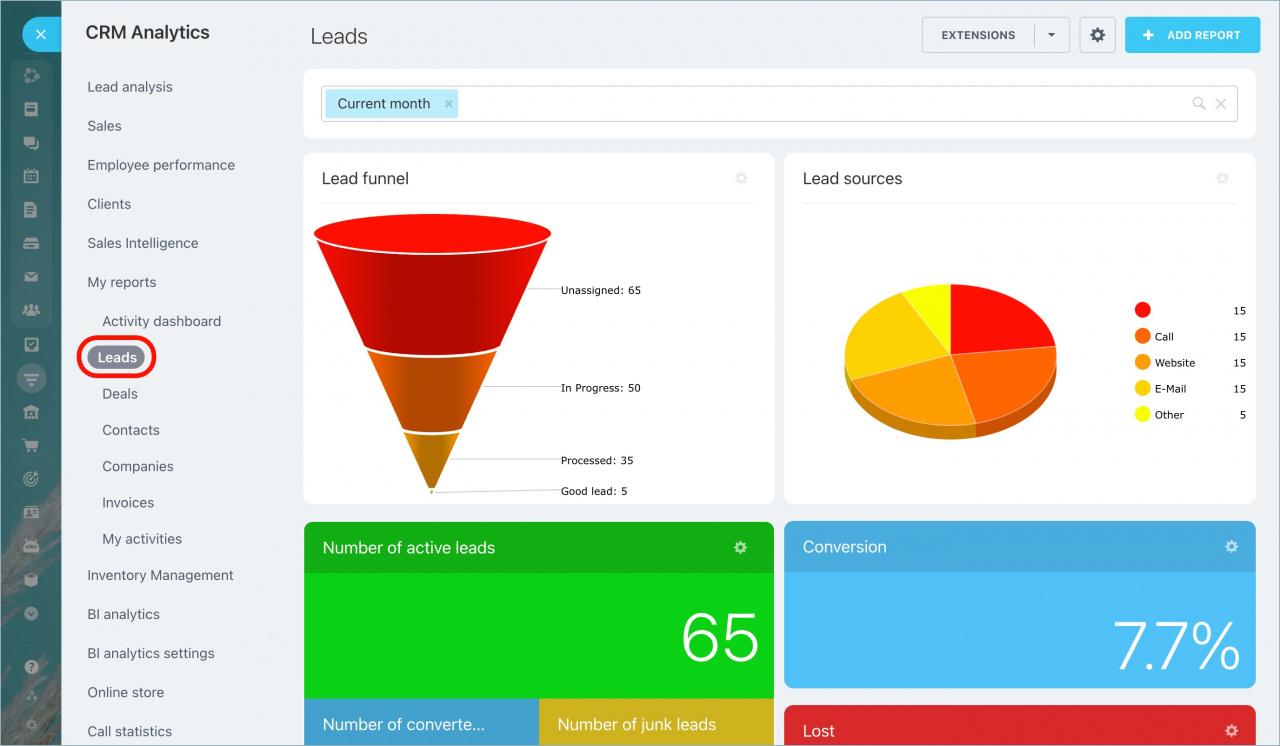
Expand My reports section and select Leads.
This report consists of widgets. Use the filter at the top to change the reporting period. You can also configure each widget, move or delete them.
Reports are created automatically. You'll see analytics for only those leads that you have access to.
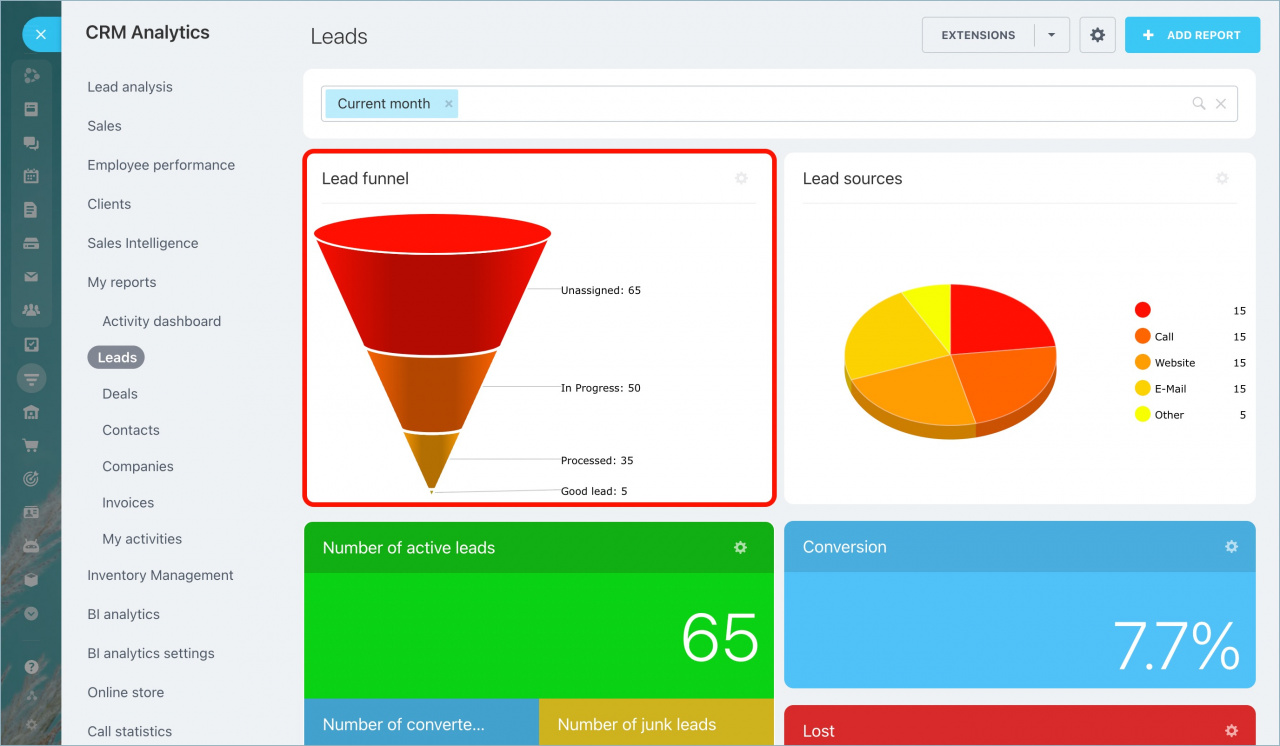
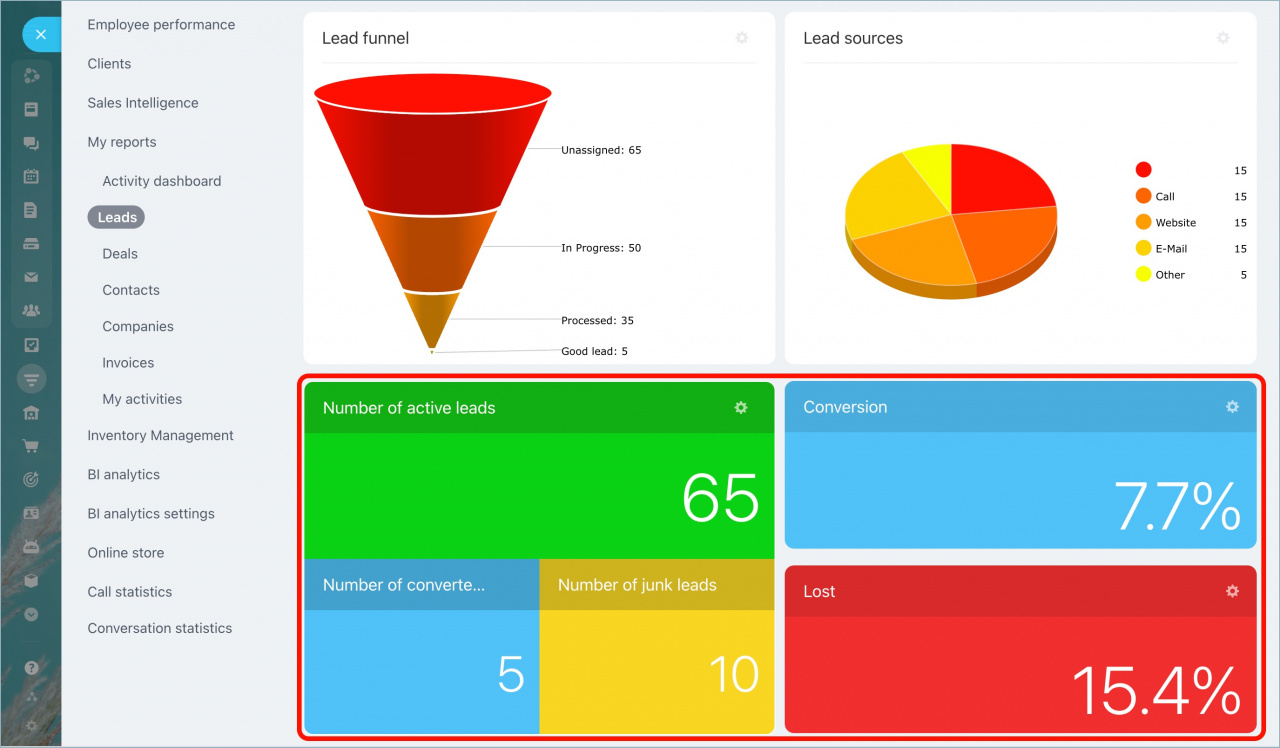
Use Lead funnel to analyze your sales process and determine at which stage you lose potential clients.
The top level of the funnel shows the total number of leads. The bottom level indicates the number of good leads.
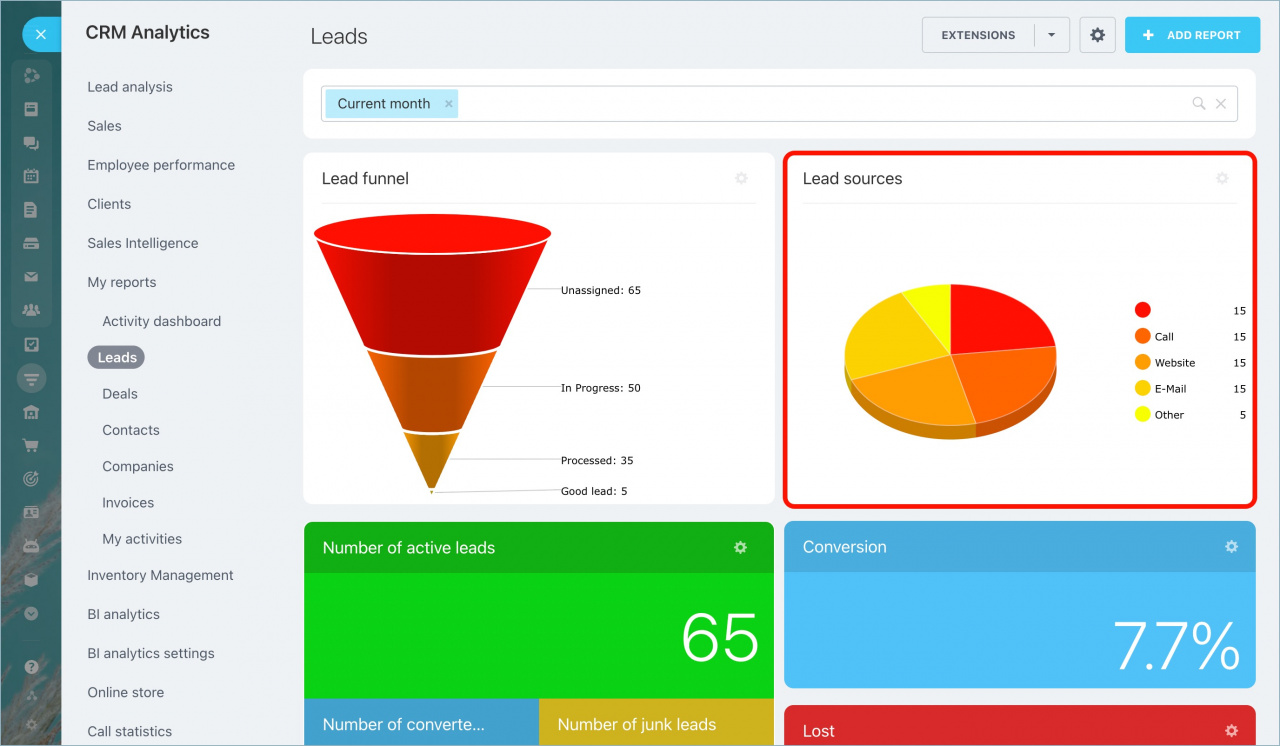
The Lead sources pie chart shows how many leads have been created from each lead source.
You can specify separate sources for each CRM form or phone number for more effective analytics.
It's important to analyze not only the total number of leads but also the efficiency of lead processing. There are five types of leads shown in analytical reports:
New - all leads created within the selected reporting period.
Active - all leads for which activities have been created.
Idle - leads that nobody worked on after creation.
Converted - leads that have been converted to contacts, companies and deals.
Junk - leads that haven't been converted and have been marked as junk.
Also, you can see the conversion rate and the percentage of losses in this section.
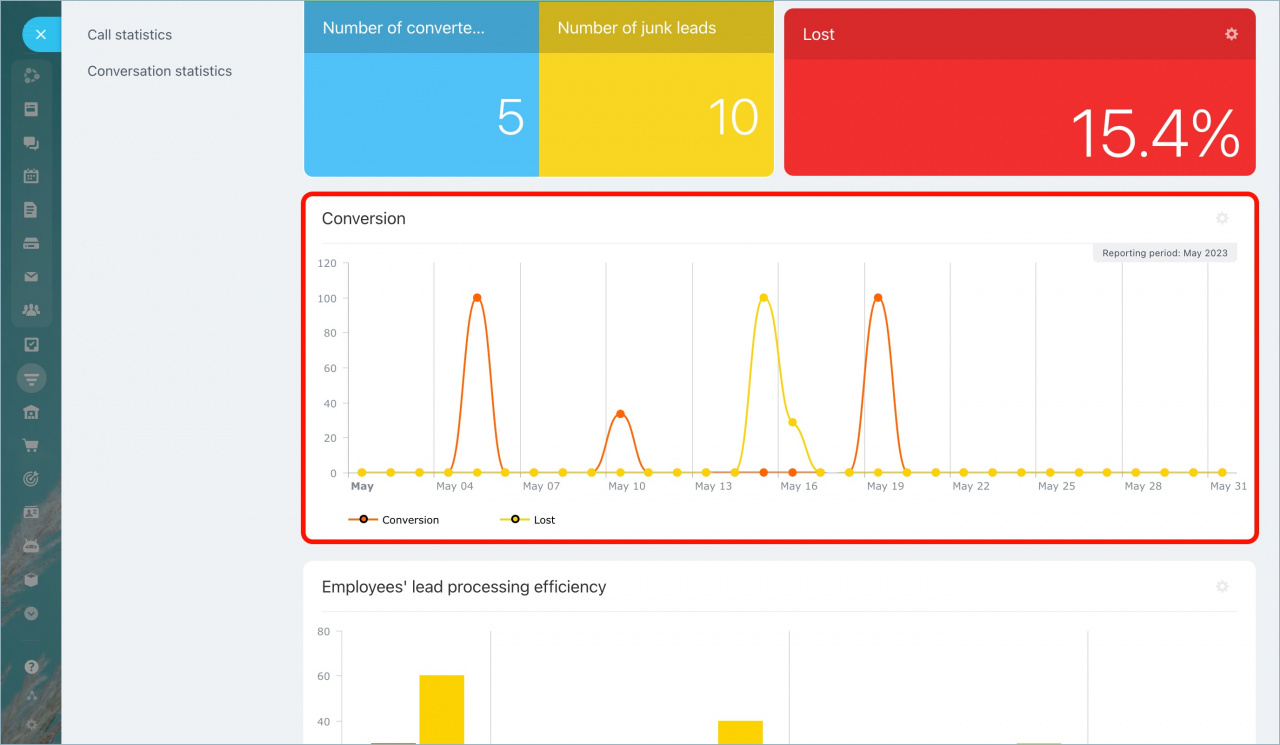
Scroll down to see the graph showing how the conversion rate has been changing within the selected reporting period.
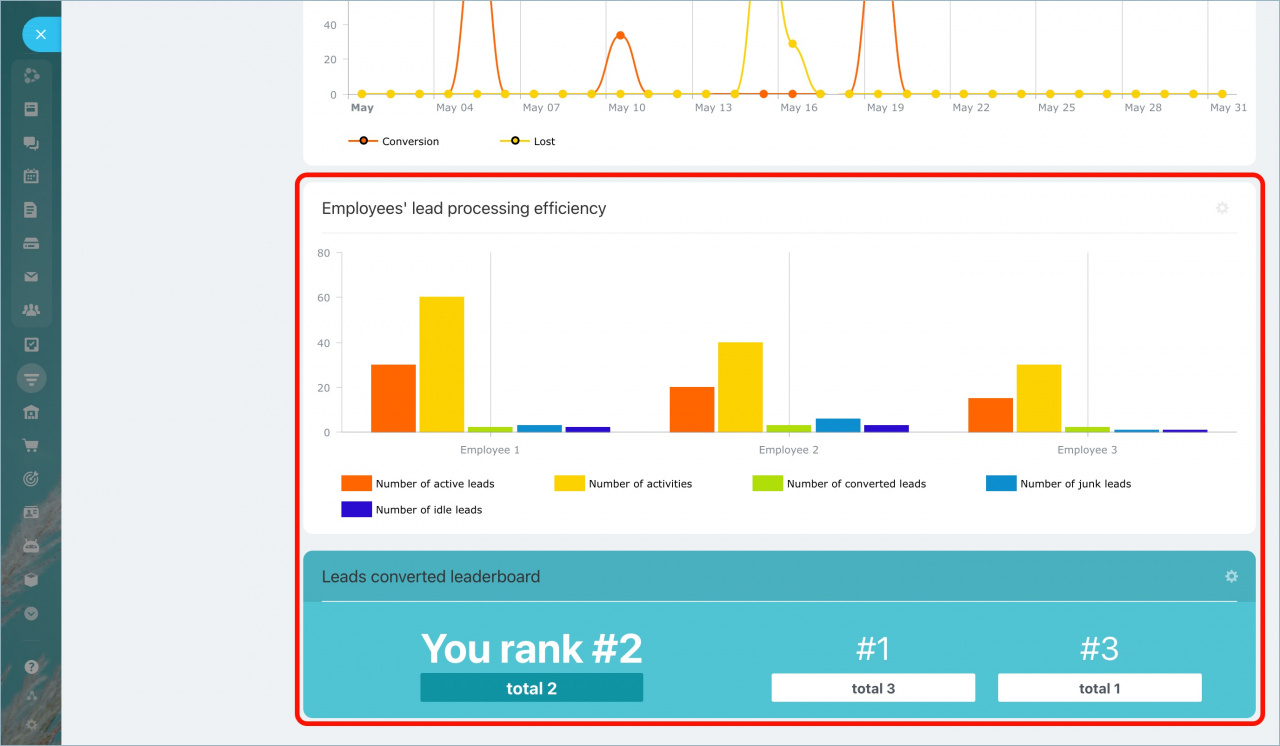
In the Employees' lead processing efficiency section, you can track the efficiency of each employee and see what rank you have in the Leads converted leaderboard.

