BI analytics and BI Builder are tools for creating business analytics reports. BI analytics lets you analyze data from Bitrix24 in Google Looker Studio or Microsoft Power BI. With BI Builder, you can create dashboards with an editor based on Apache Superset 4.0. This article answers common questions about working with data in analytics systems.
In this article:
- How to modify a built-in dashboard in BI Builder
- Why the Value filter in BI Builder doesn't show all data
- How to find the names of custom fields in BI reports
- How to add data sources from Bitrix24 to Microsoft Power BI
- How to use the time range filter
- How to update dashboard data
- How to change field names in a dashboard
- What to do if a dashboard doesn't load
How to modify a built-in dashboard in BI Builder
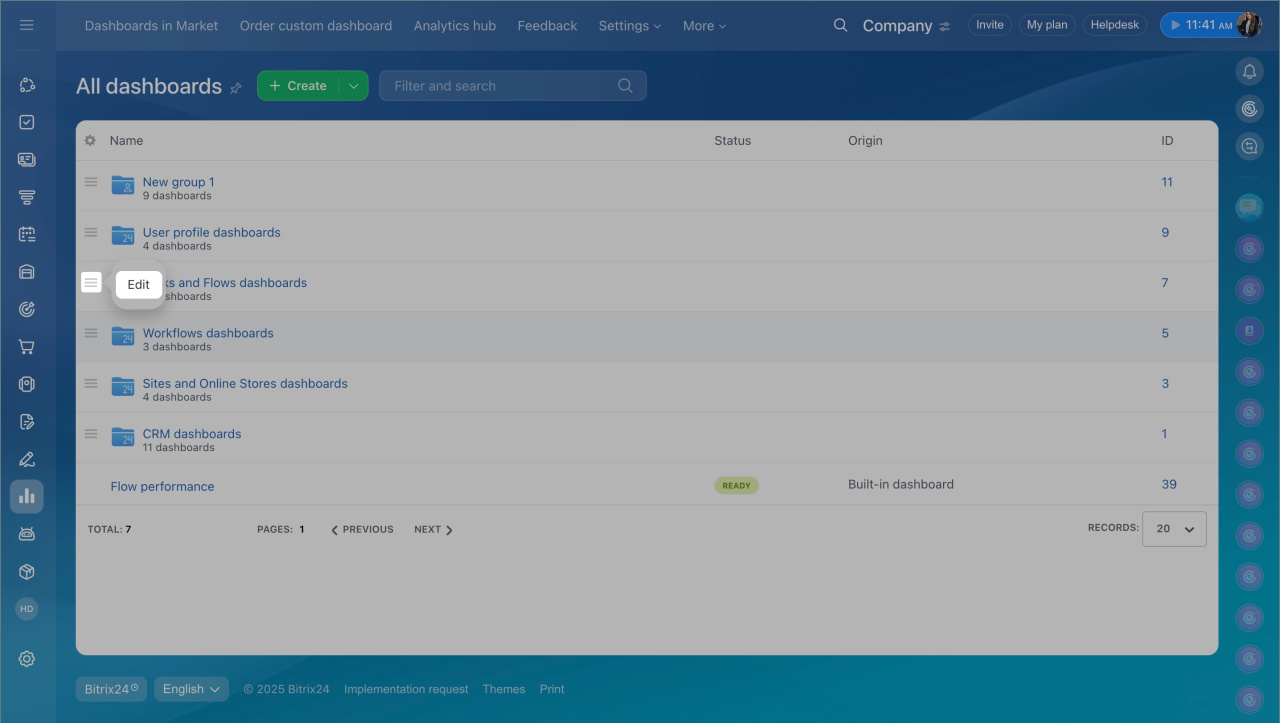
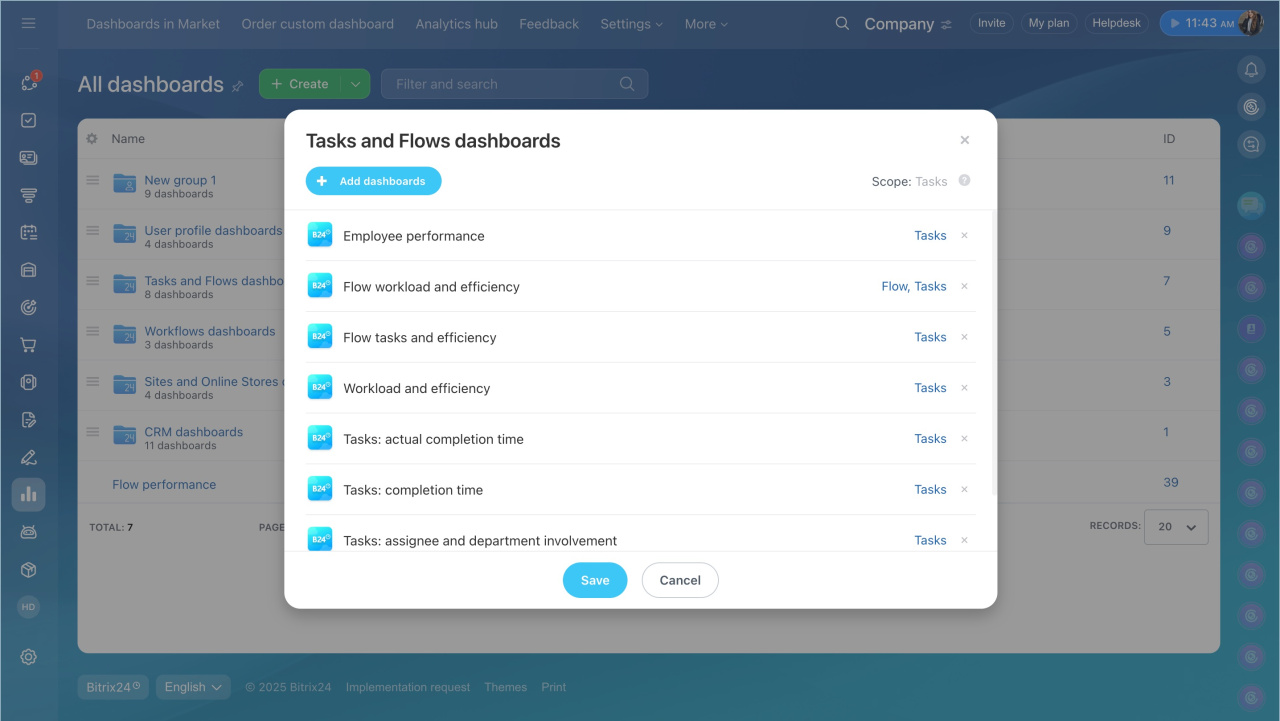
You can't modify built-in dashboards, but you can copy and edit them. Select the dashboard from the list and open Menu (≡) > Edit > Continue. Bitrix24 will create a copy that you can customize.
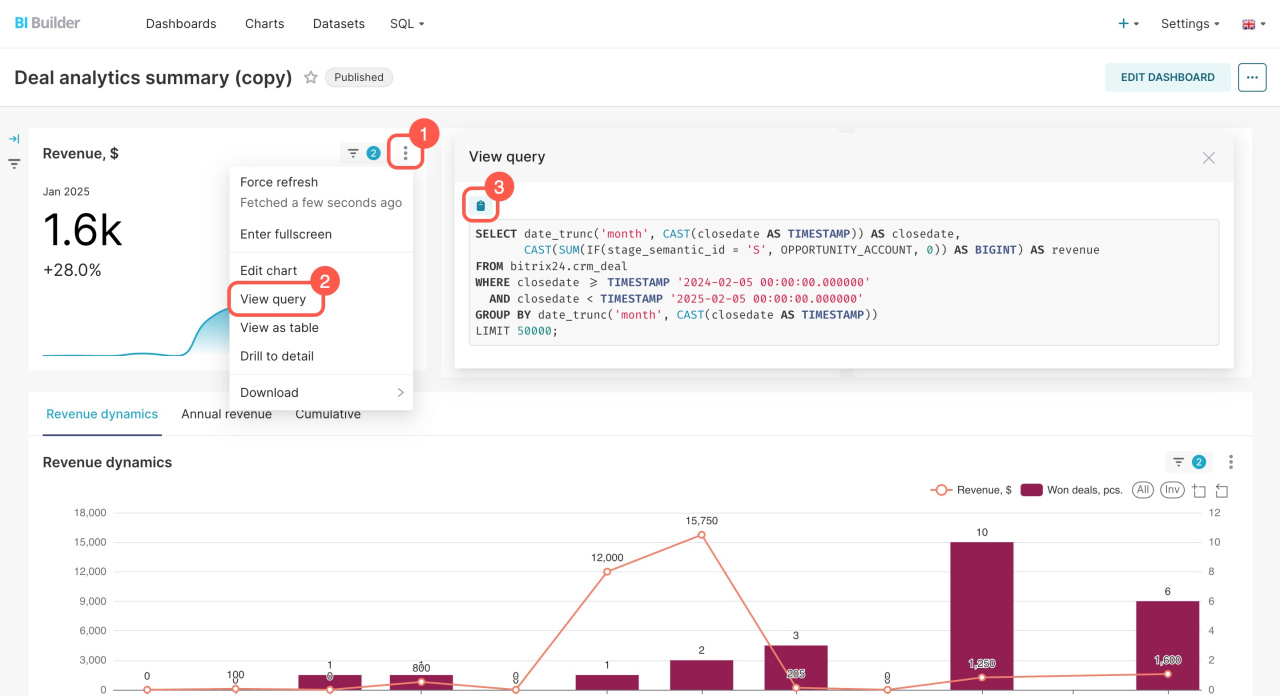
The editor will open in a new tab. Add or copy charts to use them in other dashboards. Select the desired chart and click Menu (≡) > View query > Copy.
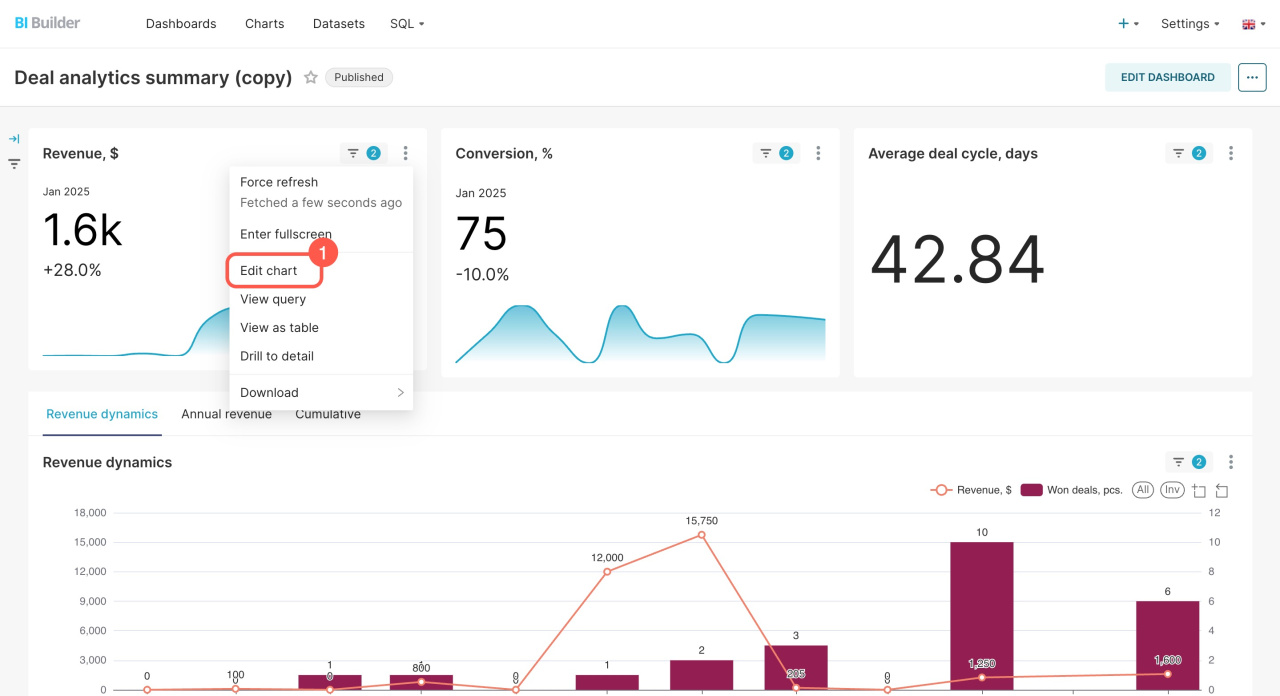
To understand the chart's structure, review the metric settings. Click Edit chart. In the window that opens, check the chart type and how the metrics are distributed.
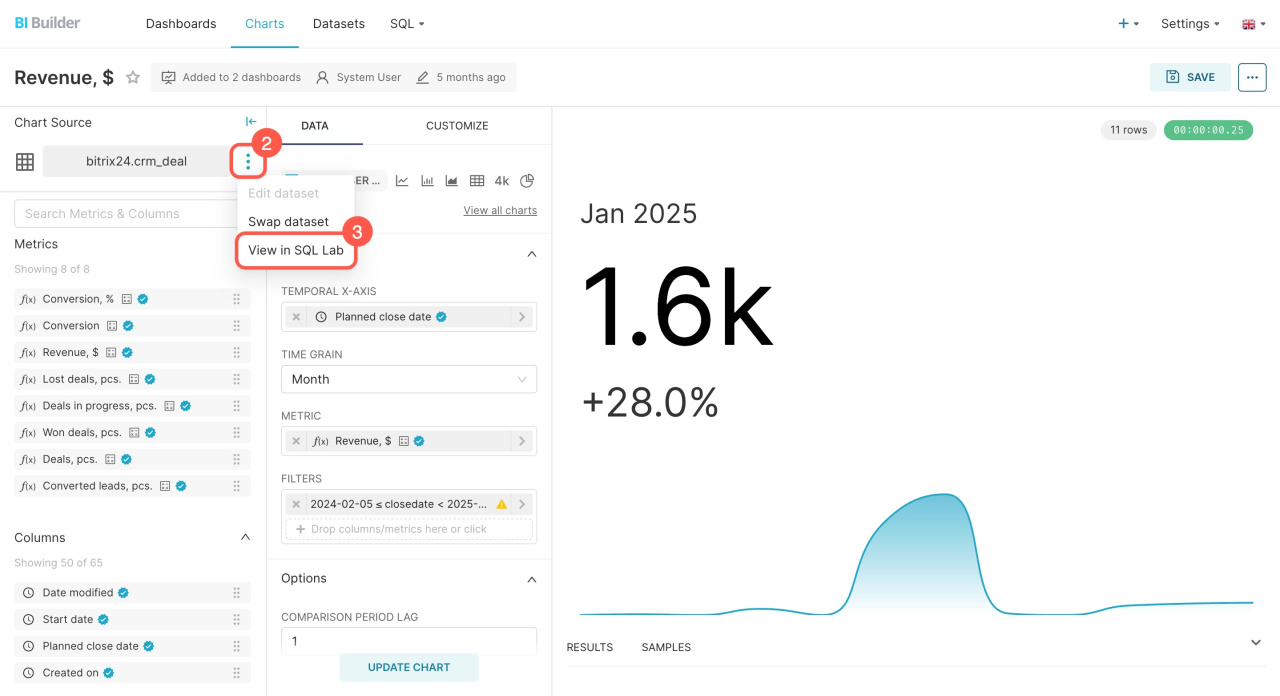
To edit the SQL query for the chart, open Menu (≡) > View in SQL Lab. Paste the copied query and modify it if needed. You can then save the query as a dataset to create a new chart for the dashboard.
Create a chart based on a virtual dataset
Why the Value filter doesn't show all data
Issue. In a BI Builder dashboard, the Value filter doesn't show all options from a specific field. For example, for the lead source, you might see options like ad, website, or call. While the Source field may have 10 values under Statuses and dropdowns, only 5 show up in the filter.
Reasons. The Value filter only displays data that's already in the report. If a value is missing, it could be because:
- The data exists under Statuses and dropdowns but isn't used. For example, the lead form includes the Exhibition source, but no leads were created with it, so the filter won't display this source.
- The data exists in Bitrix24 but doesn't appear in the report. For instance, leads with the Partners source exist but don't show up in the report due to date or status filter settings, so the source won't appear in the filter.
Solution. Check if there is data with the required source in Bitrix24 and ensure it appears in the report. Adjust the filters or time range if needed.
If the report contains at least one item with the specified source, its value will appear in the filter.
Date filters in BI Builder
Statuses and dropdowns in CRM
How to find the names of custom fields in BI reports
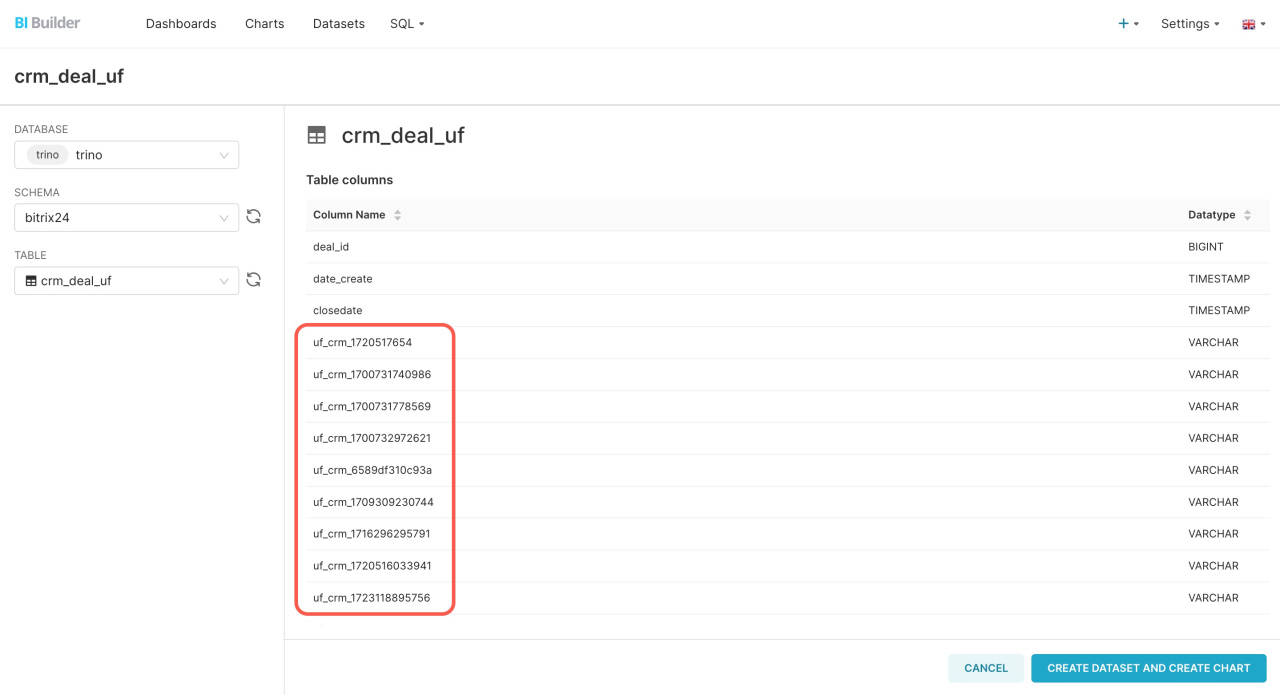
Custom fields from Bitrix24 appear in analytics systems as a code, like UF_CRM_123456789. The number is automatically assigned to the field upon creation.
Description of datasets and fields for BI Builder
To find the name of a custom field, follow these steps:
- Go to CRM > Settings > CRM settings > Form and report settings > Custom Fields.
- Open the desired field from the list.
- Check the custom field code in the browser's address bar.
How to add data sources from Bitrix24 to Power BI
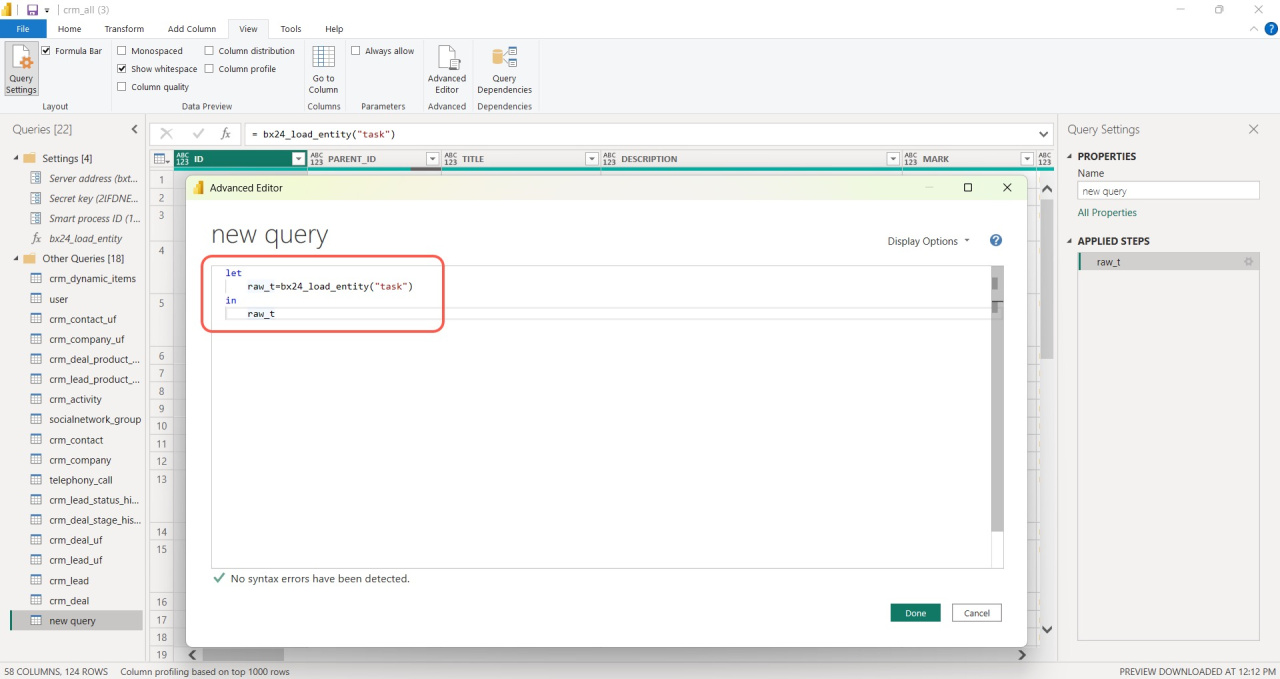
Transfer data from Bitrix24 to Microsoft Power BI using a template that includes BI connector fields for Power BI. If a template for your data source isn't available, you can manually add it using a query in the Advanced Editor.
Transfer entities from CRM to Microsoft Power BI
For example, to add a data source for tasks, enter the following code in the Advanced Editor:
let raw_t=bx24_load_entity("task") in raw_t
How to use the time range filter
The time range filter lets you limit dashboard data by date or period. For example, you can view deals from a specific day, month, or year. To make it work, your dataset must include a Date/Time column.
Set the date range for the dashboard
- Go to the BI Builder section.
- Select a dashboard from the list.
- Open the Menu (≡).
- Click Settings.
- Choose Use dashboard preferences to apply the period set in the filter.
Add or edit a time range filter
- Open the dashboard and click Edit.
- In the left panel, select Add/edit filters
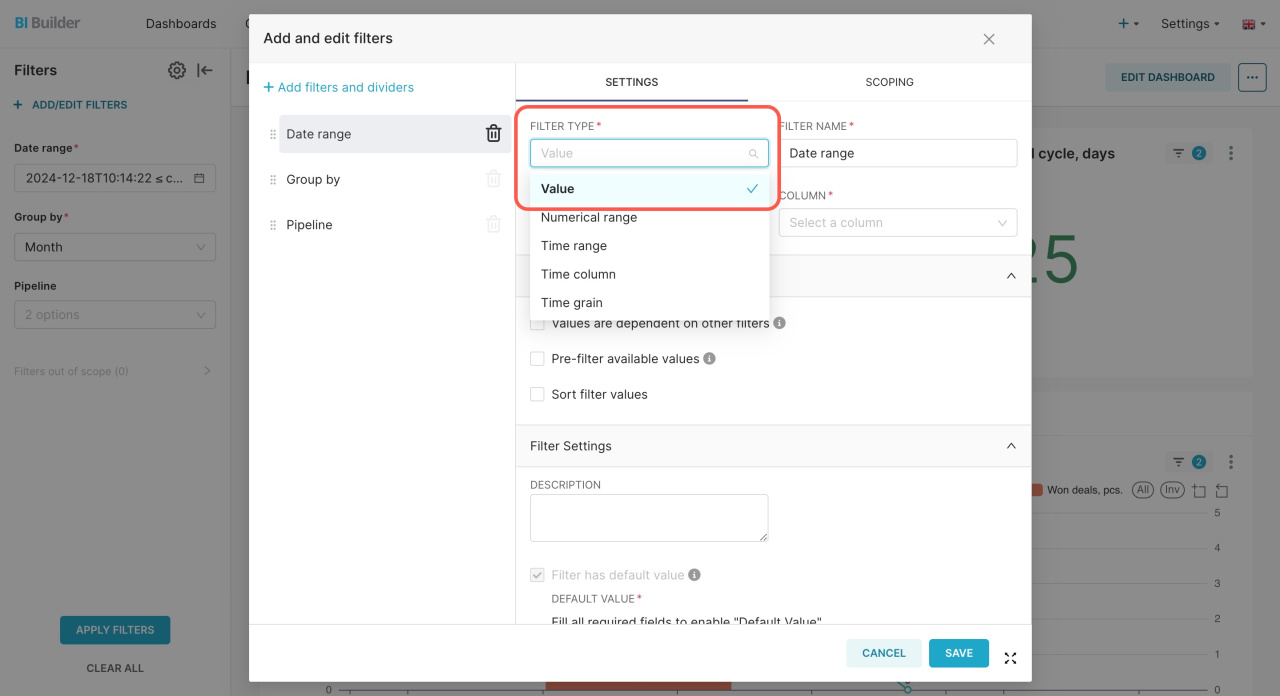
- Choose Time range as the filter type and give it a name.
- In the Filter settings block, set the Default value.
- Save your changes.
When you open the dashboard, the selected period will automatically apply to all charts.
Date filters in BI Builder
If the filter doesn’t work
Make sure the dataset includes a Date/Time column, such as DATE_CREATE or CLOSEDATE. BI Builder cannot filter data without one.
To verify this:
- Open the dashboard in edit mode.
- Open the chart settings.
- Click View query.
- If there’s no Date/Time column, edit the SQL query to add it.
How to update dashboard data
When you open a dashboard, BI Builder loads fresh data from the database and caches it for one hour. During this time, no new queries are sent, and the dashboard shows cached data. For example, if a deal is created after you open the dashboard, it will appear only after an hour. If you need the most up-to-date information, you can manually update the data in your dashboards.
- Go to BI Builder.
- Click Settings.
- Select General preferences.
- Click Update data now.
The data will update in all reports. To check when you can update again, hover over the Update data now button.
BI Builder: How to update report data
How to change field names in a dashboard
By default, BI Builder pulls field names directly from the database and displays them with system labels such as TITLE or DATE_CREATE. To make your dashboards easier to read, assign custom field names in the SQL query, dataset settings, or chart settings.
Set field names in the SQL query
When creating a dataset for a dashboard, you can rename fields manually using the AS operator in your SQL query. For example:
SELECT TITLE AS "Lead name" FROM crm_lead
As a result, the report will display Lead name instead of TITLE.
SQL query example: View leads converted to deals
Set field names in dataset or chart settings
You can also change field names at the dataset level. BI Builder will then use these names in all charts, while the original system names remain unchanged in the database.
- Go to the Datasets section.
- Select the required virtual dataset.
- Click Edit.
- Open the Columns tab and rename the columns.
- Save your changes.
After updating field names in the dataset, you can adjust them for individual charts if needed.
- Go to the chart editor.
- Select the field.
- Open the SQL tab.
- Enter a new name.
- Save your changes.
This lets you use a unique field name for a specific chart while keeping the original name in the dataset and other reports.
Create a chart based on a virtual dataset
What to do if a dashboard doesn't load
If a dashboard in BI Builder doesn’t open for more than an hour or an error appears while loading, the data source may be temporarily unavailable. This can happen when Bitrix24 fails to retrieve data. Updating the encryption key may help restore the report’s functionality.
- Go to BI Builder.
- Click Settings.
- Select General preferences.
- Click Update key.
After you update the key, refresh the page or reopen the dashboard. The data should start loading again. If the issue persists, wait until the system load decreases, or contact Bitrix24 Support for assistance.
BI Builder settings
Contact Bitrix24 Support
How to disable BI Builder
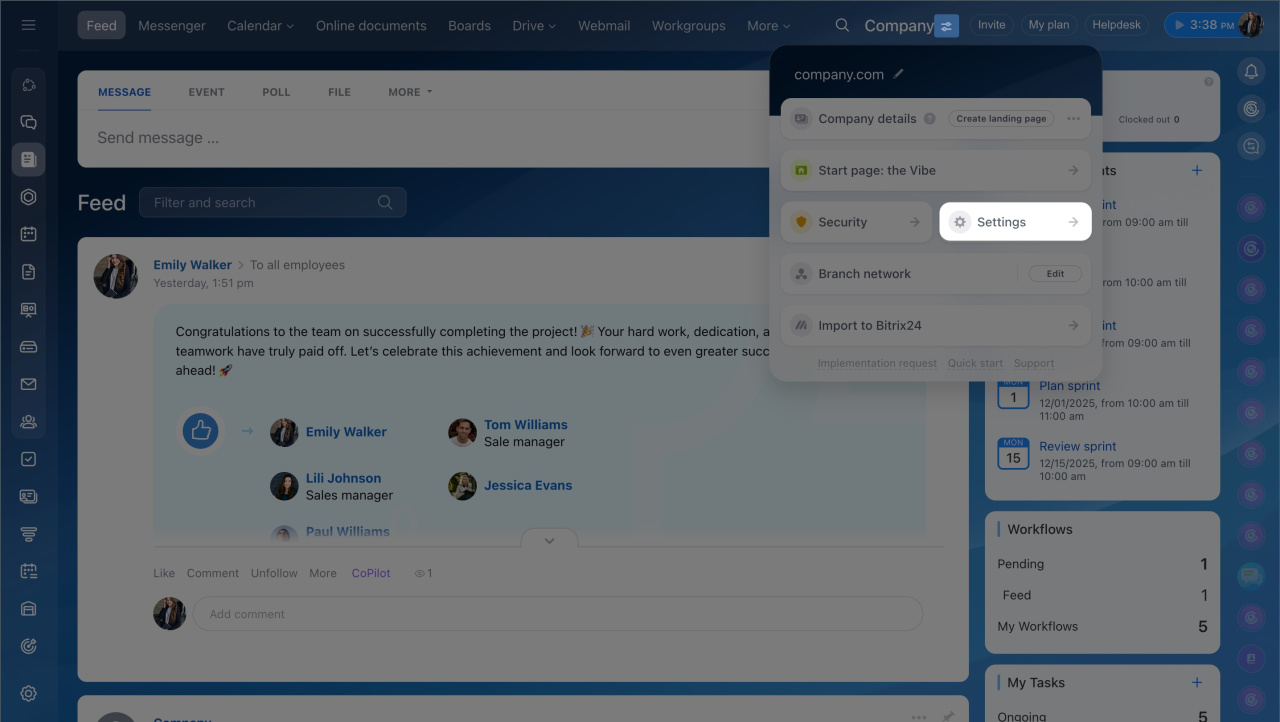
1. Click the button next to the Bitrix24 name and go to Settings (⚙️).
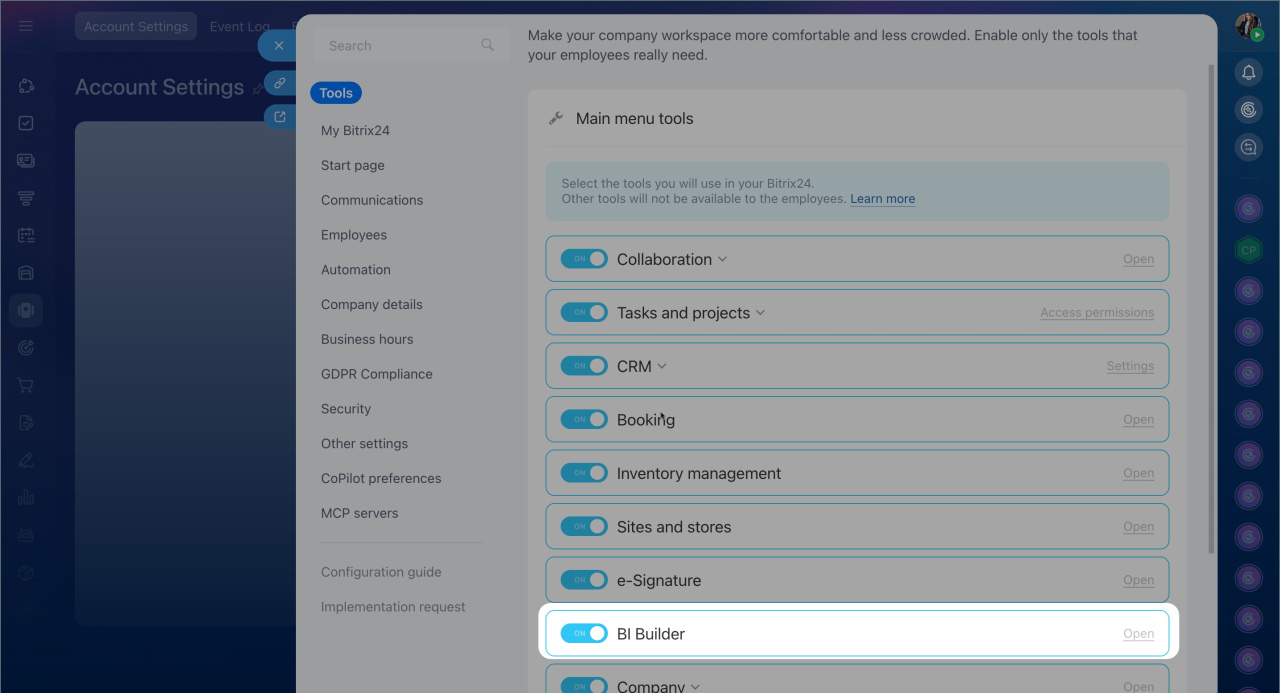
2. Disable BI Builder and save the changes.
Disabling the builder will delete all settings, charts, and custom reports. If you enable it again, you will need to set them up from scratch.
In brief
- BI analytics and BI Builder are helpful tools for creating reports and analyzing data in Bitrix24.
- You can't edit built-in dashboards in BI Builder, but you can create a copy and make changes.
- The Value filter in BI Builder only displays data that's already in the report. If data is missing, check the filter settings.
- In analytics systems, custom fields appear as a code. You can view the name of a custom field in Bitrix24 under CRM > Settings > CRM settings > Form and report settings > Custom Fields.
- To add data sources from Bitrix24 to Microsoft Power BI, use ready-made templates or enter a code manually via the Advanced Editor.
- The time range filter lets you limit dashboard data by date or period. For example, you can view deals from a specific day, month, or year. To make it work, your dataset must include a Date/Time column.
- Data in reports is updated upon opening and cached for one hour. You can update the data manually or set it to refresh automatically.
- To make your dashboards easier to read, assign custom field names in the SQL query, dataset settings, or chart settings.
- If a dashboard doesn't load, try updating the encryption key under BI Builder > Settings > General preferences.

