Explore the new SQL functions in BI Builder: bitrix24.bi_queries_t() and bi_explain_query(). These tools are designed to help you monitor query history and understand the causes of slow dashboard loading, enhancing your data management capabilities.
These functions enable you to identify the filters used in queries and the amount of data they process. If a query is running slowly, you can optimize it by adjusting filters or reducing the number of columns.
In this article:
View SQL query history
SQL function bitrix24.bi_queries_t(). This function helps you analyze the history of SQL queries you've run in BI Builder. It shows a table with details such as which queries were executed, how much data was loaded, and other relevant information.
To view query history:
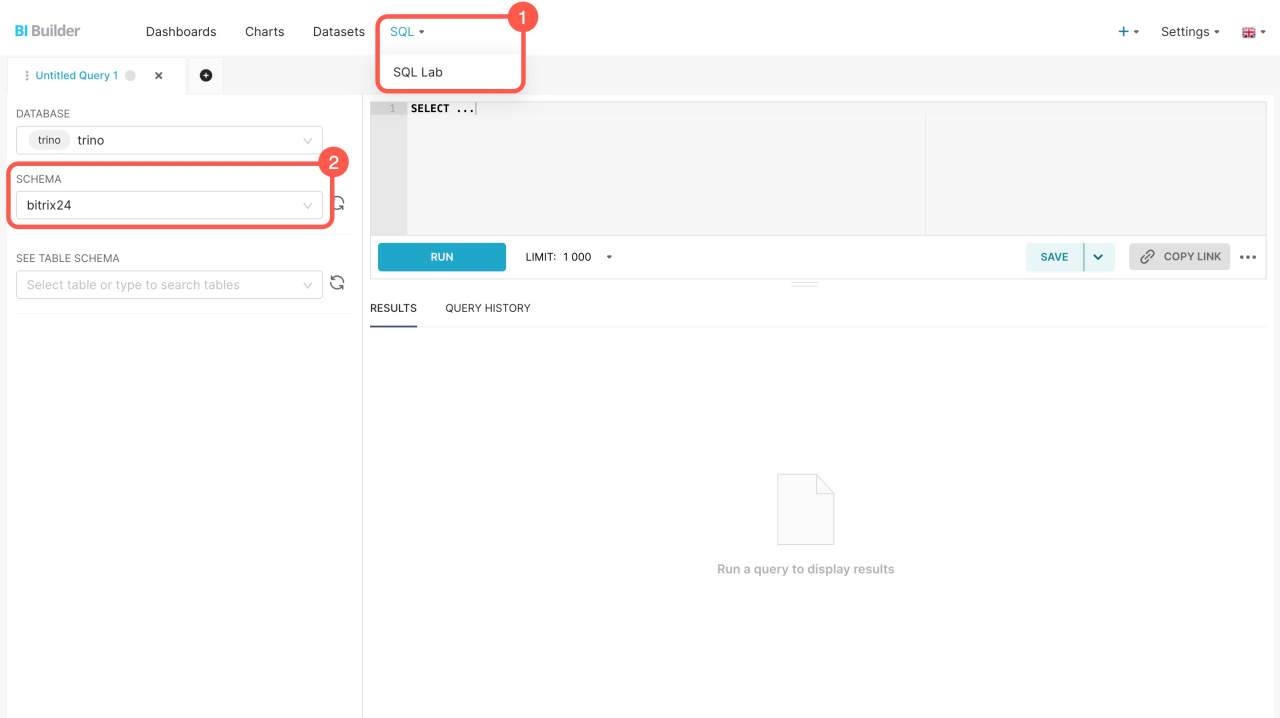
- Open BI Builder and go to the SQL > SQL Lab section.
- Select the bitrix24 schema.
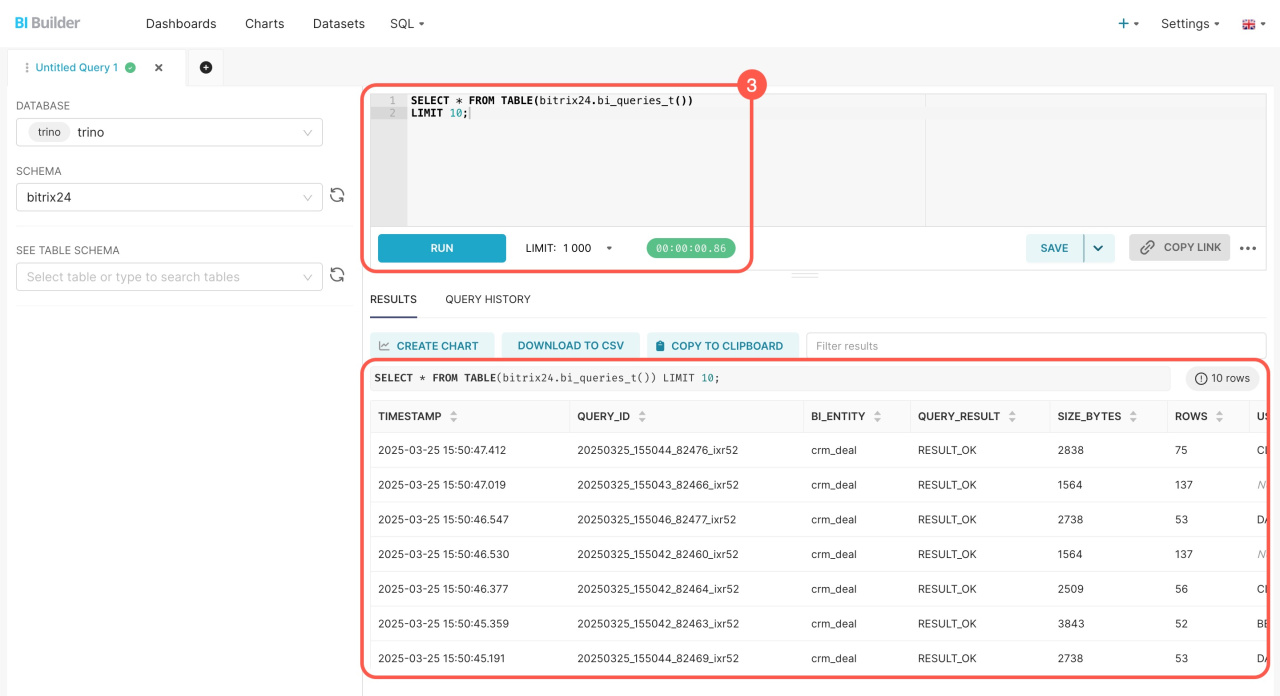
- Enter the following SQL query and click Run:
SELECT * FROM TABLE(bitrix24.bi_queries_t()).
By default, this query displays a table with the last 1,000 executed queries. To limit the number of rows, use the LIMIT operator. For example, to view the last ten queries, use:
SELECT * FROM TABLE(bitrix24.bi_queries_t()) LIMIT 10;
Analyzing the table helps identify which queries slow down dashboard performance and how to optimize them. For instance, if a dashboard loads slowly, check the recent queries and note their volume and execution time. If there is too much data, try adding a date range filter to reduce the selection and speed up loading.
The information in the table partially repeats data from the query usage statistics section in BI Builder but provides more parameters for analysis.
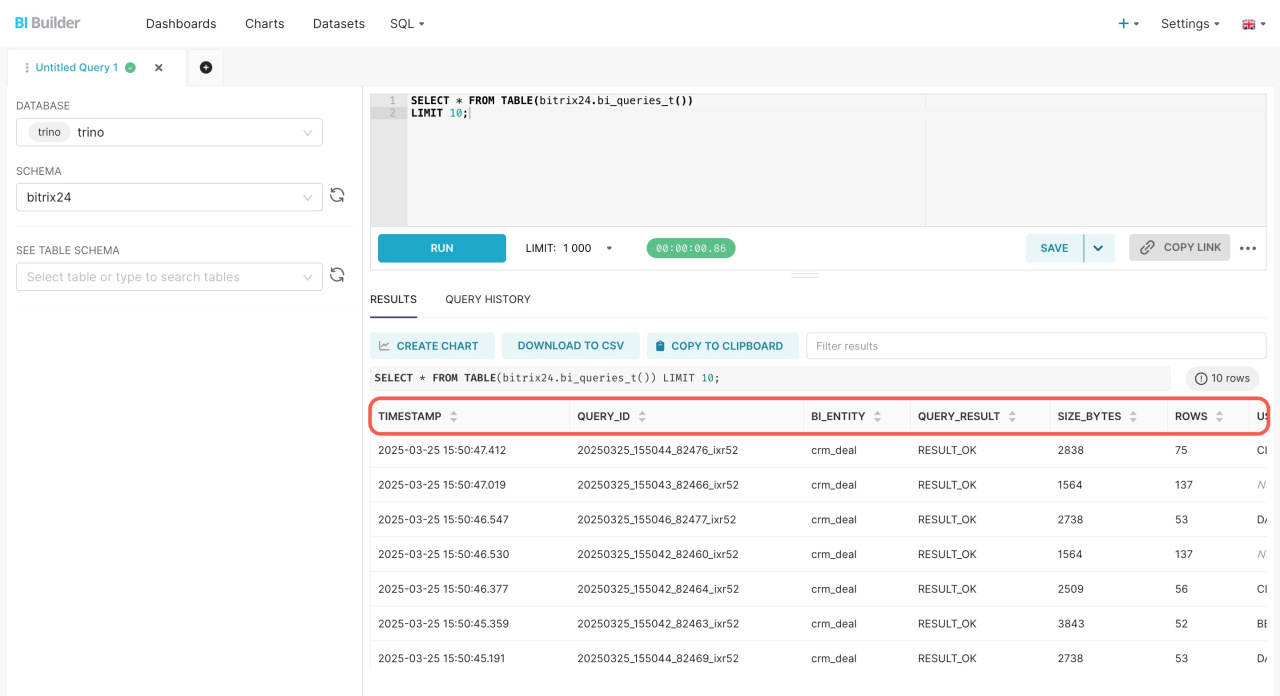
In the table columns, you'll see detailed information about each executed query:
| Column name | Description |
|---|---|
| TIMESTAMP | Exact date and time of query execution. Helps identify peak load periods. |
| QUERY_ID |
Unique query identifier. Use with bi_explain_query() to find and analyze specific query details.
|
| BI_ENTITY | Target dataset or entity. Helps trace slow queries to specific data sources. |
| QUERY_RESULT | Execution status. Indicates whether the query completed successfully or encountered an error. |
| SIZE_BYTES | Volume of data returned. Larger datasets may require optimization. |
| ROWS | Number of rows returned. If there are too many rows, add a filter to speed up performance. |
| USED_DATE_FILTER | Date range filter applied (if any). Check if the query is limited to the required period. |
| SELECTED_COLS_CNT | Number of columns selected. If there are many columns, the query may slow down. Select only the necessary ones. |
| SERVER_FILTERS_CNT | Number of filters applied on the server side. If there are no filters, queries may run slower as they will load more data. |
| SERVER_FILTERS_INFO | Details the specific filters used. Verifies correct data selection. |
| CACHE_SIZE_BYTES | Size of data retrieved from cache. When data is cached, queries run faster because accessing the cache is quicker than reading directly from Bitrix24. The default cache lifetime is 1 hour. |
| DOWNLOAD_MILLS | Data download time. Shows how long data loading takes. |
| PARSE_MILLS | Time to process raw data before sending it to the server. Smaller datasets parse faster. |
| COMPRESS_MILLS | Time to compress raw data before saving it to the cache. The larger the data volume, the longer the compression takes. |
| DECOMPRESS_MILLS | Time to decompress cached data. The larger the data, the longer it takes to decompress, which can slow down performance. |
| FROM_CACHE | Indicates whether the query results were served from cache. When data is cached, queries run faster. |
| QUERY_JSON | Complete query configuration in JSON format, including parameters and filters. |
Analyze an SQL query
SQL function bi_explain_query(). This function shows how a query is executed in the Bitrix24 MySQL database. It helps identify which tables and indexes are used, how data is joined, and why a query might be running slowly.
To get a detailed analysis of a query, follow these steps:
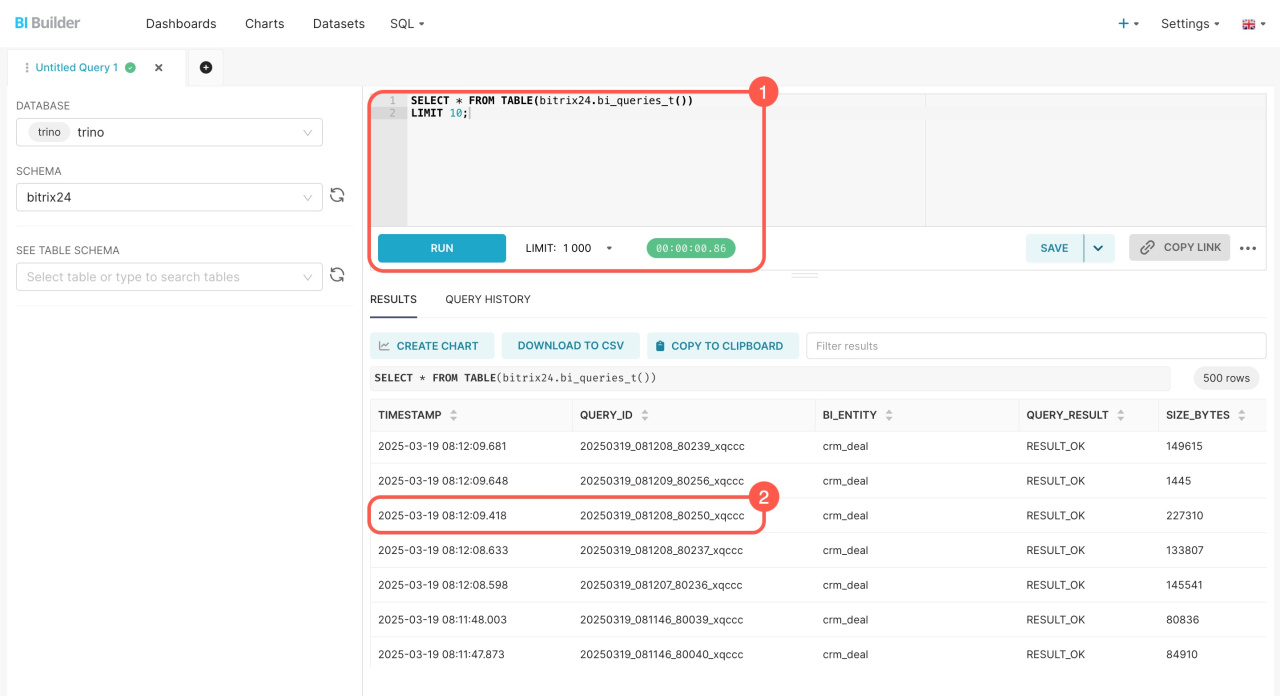
1. Copy the QUERY_ID and TIMESTAMP values. You can find these in the query history table (bitrix24.bi_queries_t()). Run the following SQL query: SELECT * FROM TABLE(bitrix24.bi_queries_t()). Find the row you need and copy the QUERY_ID and TIMESTAMP values.
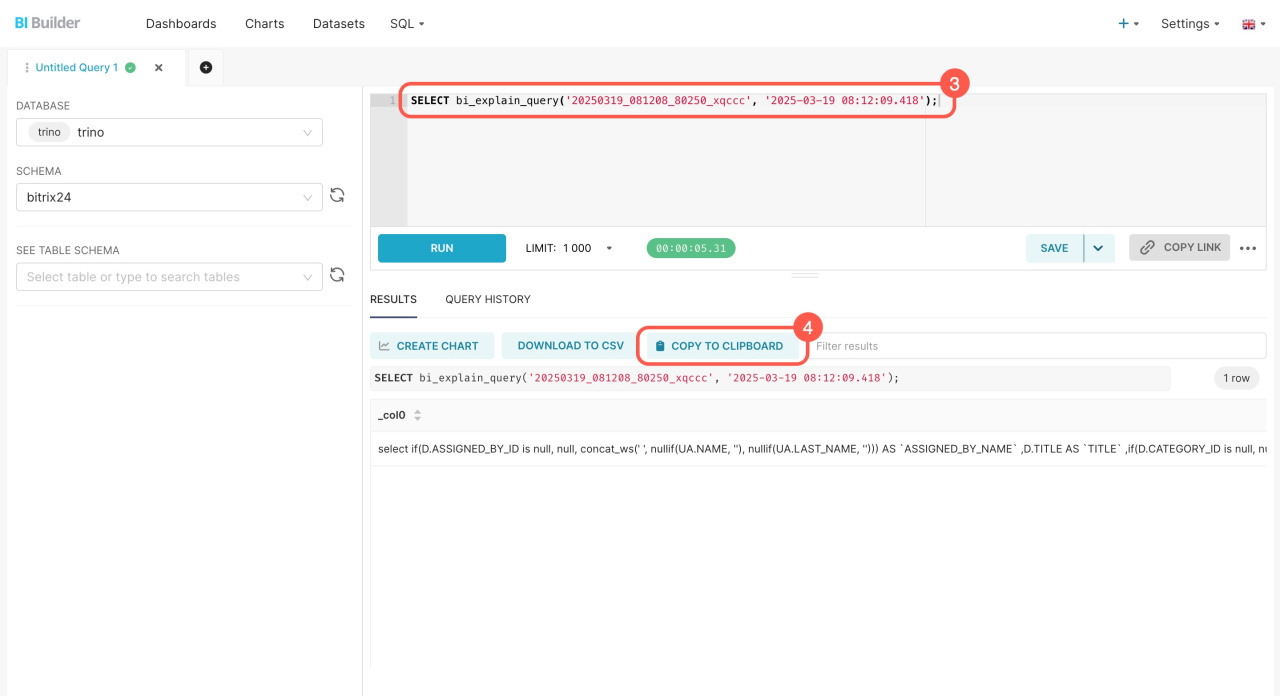
2. Add parameters and run the query. Add the copied parameters to the query: SELECT bi_explain_query('20250319_081208_80250_xqccc', '2025-03-19 08:12:09.418'); and execute it. For convenient analysis, copy the result to the clipboard and open it in any text editor.
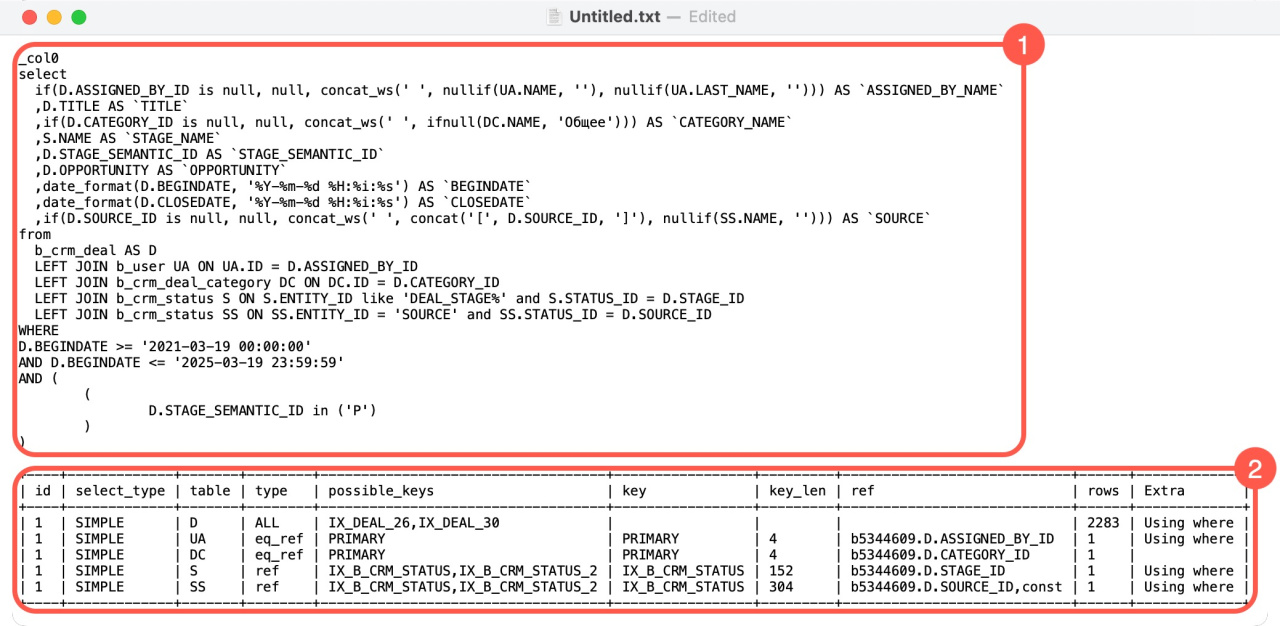
You'll receive a detailed execution plan for the SQL query. It shows how the server processes it, including which tables and indexes are used and which operations might slow it down. The plan has two parts:
Original SQL query. In the example, the query selects data from the deals table and joins it with other tables. It retrieves the deal name, category, responsible person, start and close dates, source, and stage.
Query analysis table. This part outlines the steps the server takes to execute the query. Each row in the table represents a step the server takes to retrieve data. The table consists of several columns, each explaining a specific detail of the query execution:
| Column name | Description |
|---|---|
| id | Step number in the execution sequence. Shows the processing order of tables in the query. |
| select_type | Query type. SIMPLE indicates a basic query without subqueries or unions. |
| table | Name of the table being accessed at this step. |
| type |
Method of searching for data in the table:
|
| possible_keys | Potential indexes available for this operation. |
| key | Index the server uses when executing the query. If the field is empty, the server does not use indexes, and the query may run slower. |
| key_len | Length of the index key. Shorter keys generally improve search speed. |
| ref | Shows the fields used to join tables (e.g., by deal ID, category, or stage). This helps understand how the server links data together. |
| rows | Number of rows the server will check at this step. The more rows, the slower the query. |
| extra |
Additional execution details:
Official MySQL documentation |
If you have the Bitrix24 On-premise version, you can add the necessary indexes to the database on your own. However, in the cloud version, you can't manually change indexes. If you believe adding an index could improve SQL query speed, contact our support team.
How to contact Bitrix24 Support
In brief
-
New SQL functions in BI Builder enhance your ability to analyze query performance and identify reasons for slow dashboard loading.
-
The bitrix24.bi_queries_t() function provides insights into SQL query history, including execution time and data volume, helping you pinpoint and improve slow queries.
-
The bi_explain_query() function offers a detailed breakdown of query execution, showing which tables and indexes are used and identifying potential slowdowns, aiding in query optimization and reducing database load.

