
Every company needs a clear view of team performance. A department manager needs to know if work is on track. HR needs to see how new hires are doing during probation.
When task data is spread across dozens of forms, it is hard to see the full picture. For example:
- A manager can see that the team is behind schedule, but cannot tell who is overloaded and who still has capacity.
- A director asks for the department's quarterly results, but the data is spread across many tasks, so collecting it by hand takes too long.
- Before starting a new project, the team needs to know whether they have enough capacity, but checking each employee one by one takes too much time.
Task reports bring this information together in one place. You can see how many tasks each person completed, where overdue tasks are building up, and how the team performed over any time period without collecting data manually.
If you need more flexibility, you can export the data and keep working with it there. You can also share it with people who do not have access to Bitrix24.
In this article:
When to use task reports
Reports do more than support routine monitoring. They also help you spot problems that are easy to miss when you look at tasks one by one.
Uneven workload distribution. A project manager notices that one developer keeps missing deadlines. He opens the resource report by assignee and sees that this developer has three times more active tasks than the rest of the team. The issue is not the employee. The workload is distributed unevenly.
One task type is delayed again and again. If overdue tasks keep appearing month after month in the same task type, you should look into the cause. When you compare reports across different periods, you may find that tasks are underestimated or that approvals take longer than planned.
The team starts a new project without checking current capacity. Before accepting a large new order, a manager checks project involvement and sees that the team is already fully loaded. This helps set realistic timelines instead of making promises the team cannot keep.
Workload changes over time. When you compare reports from different periods, you can spot trends. You can see whether the number of tasks is growing and whether the team is still performing at the same level. This helps you catch rising workload early and decide whether to expand the team before problems begin.
Analyze team performance with reports
Reports in Bitrix24 help when you need to quickly review current data or share it with coworkers.
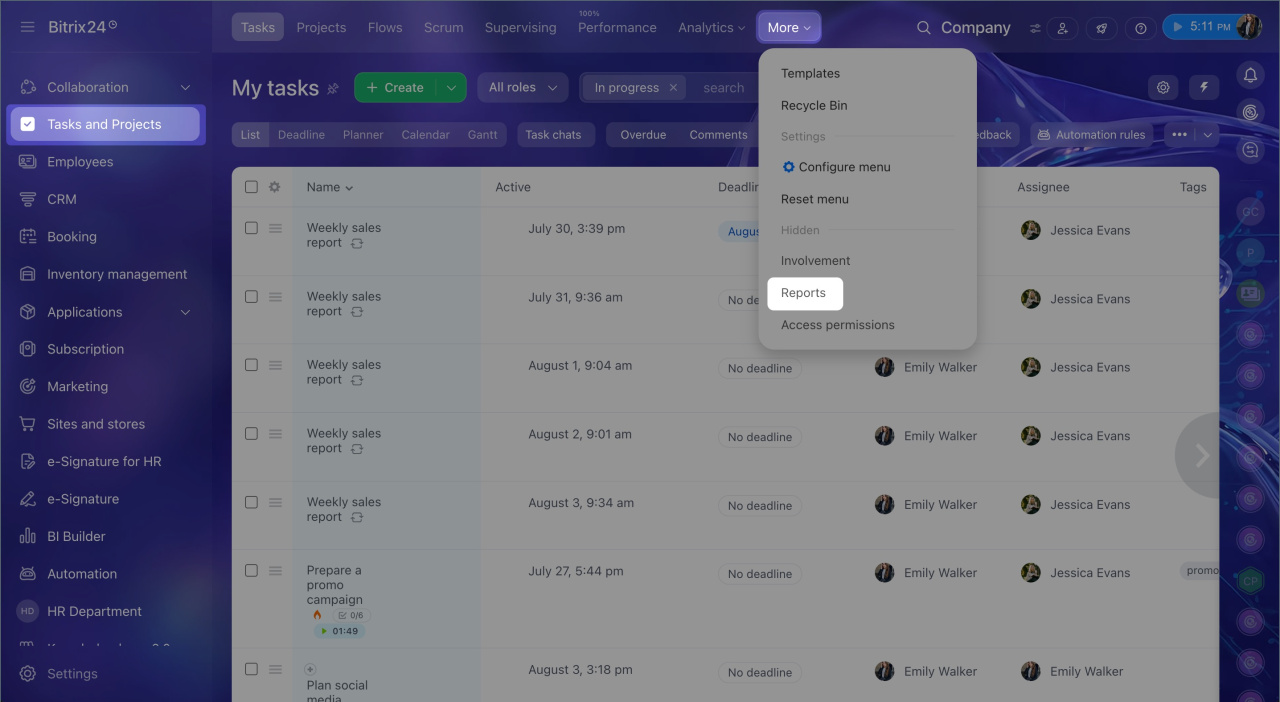
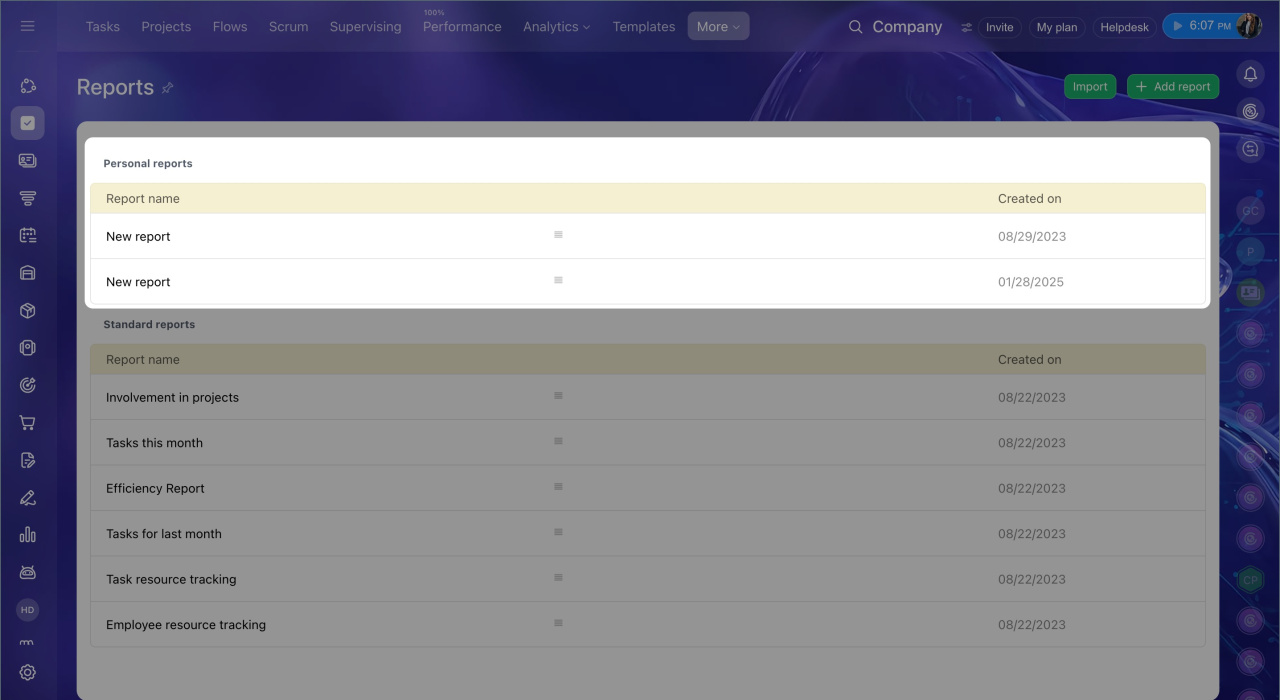
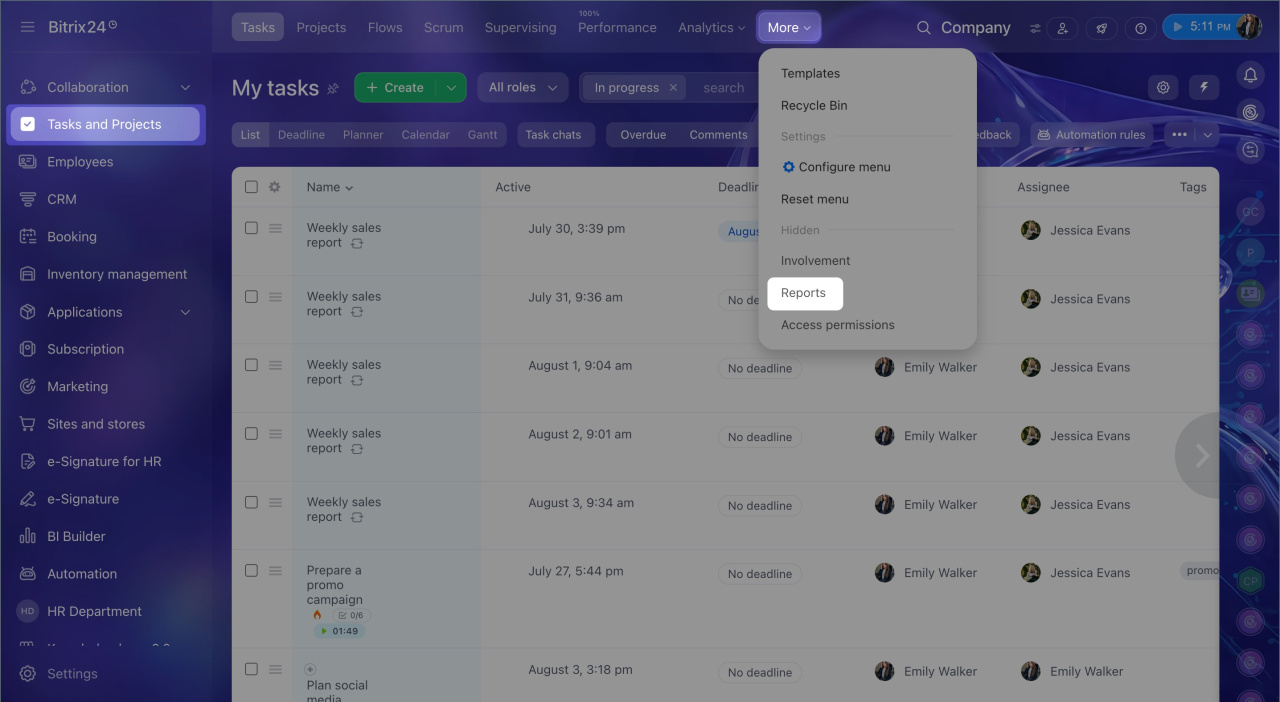
Go to Tasks and Projects > More > Reports. You will see two report sections: Personal and Standard.
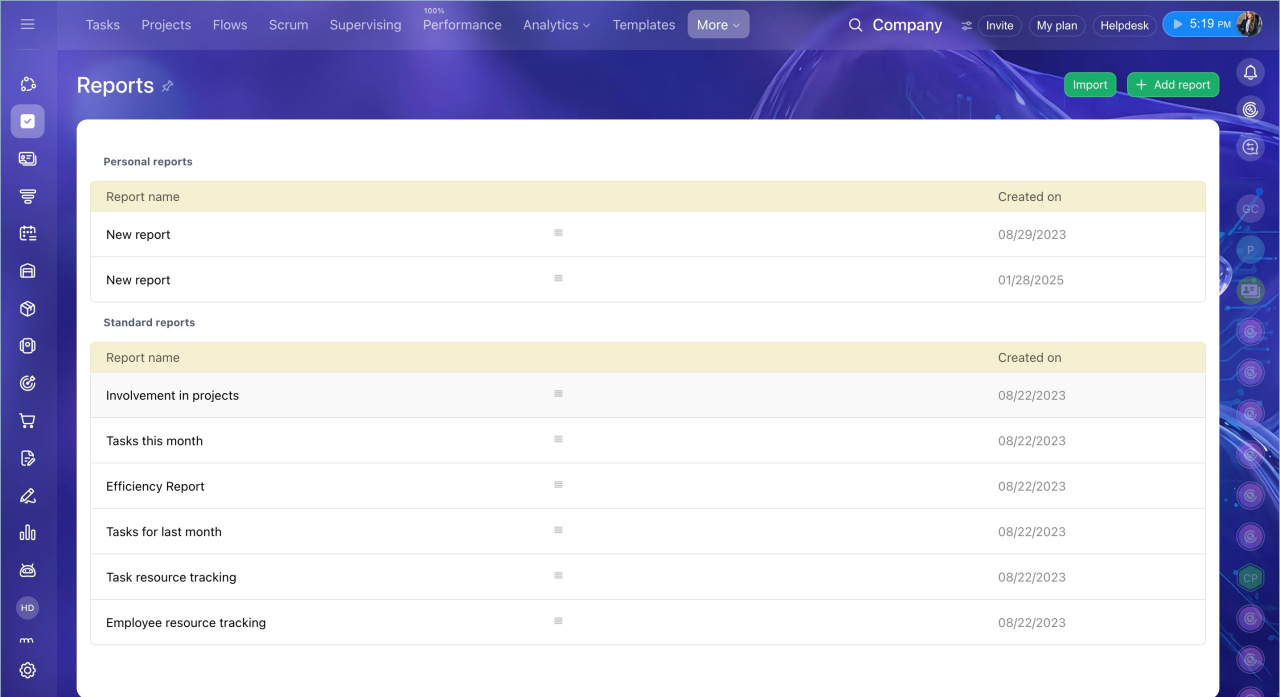
Standard reports are ready-made templates for common analysis tasks. They do not require setup, and the data is always current when you open them. In any standard report, you can use filters to choose a specific employee, task status, or other parameters.
You cannot edit standard reports, but you can copy any report and customize the copy for your needs.
Standard reports in tasks
Bitrix24 includes six standard reports.
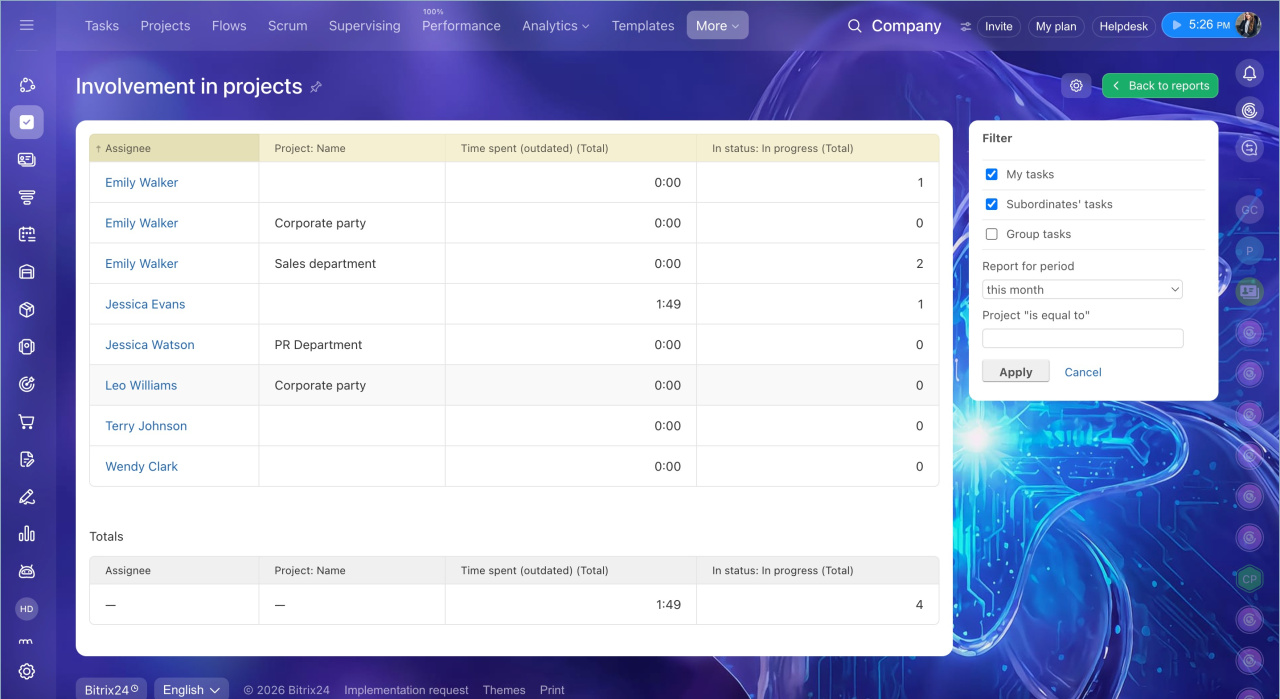
Involvement in projects. It shows how much time employees spend on tasks in each project and how many tasks they currently have in progress. For example, a manager may see that two out of three developers are fully loaded while the third has almost no active tasks. This makes it easy to rebalance work before deadlines are missed.
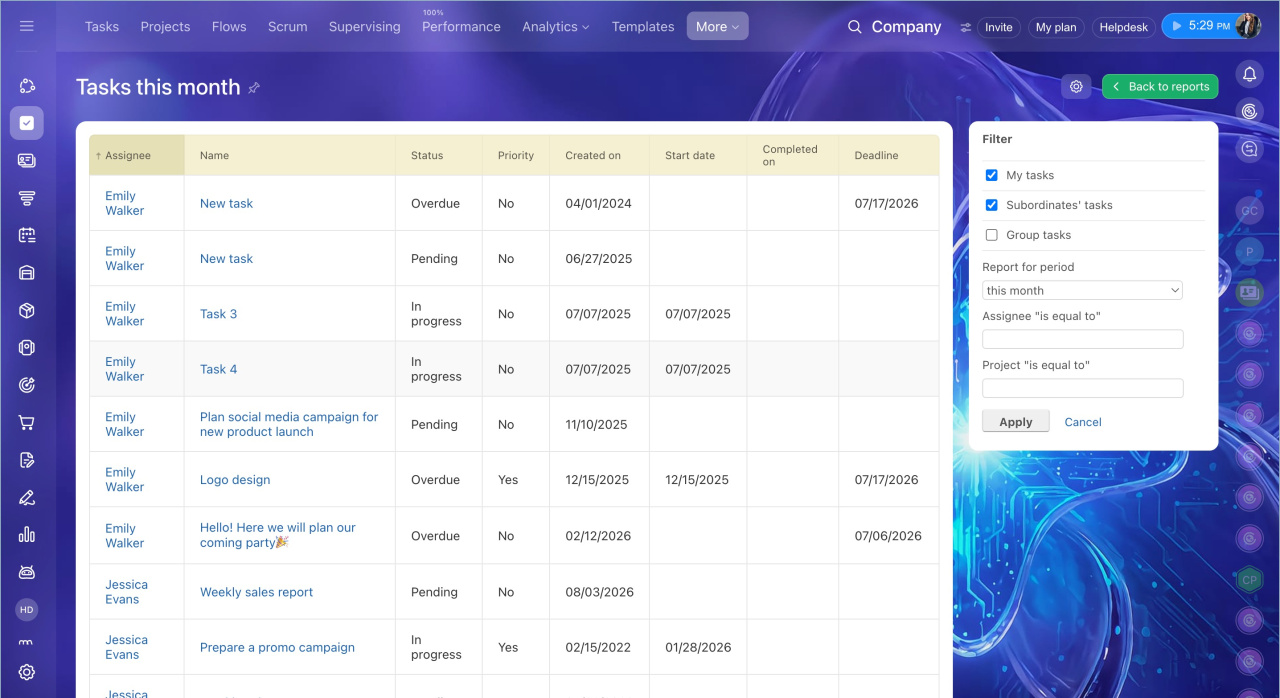
Tasks this month. It shows the current situation: how many tasks were created, completed, and are still in progress. For example, a manager checks the report in the middle of the month and sees that only 8 out of 40 tasks are done and 12 are already overdue. This is a signal to address the issue at the next standup instead of waiting until the end of the month.
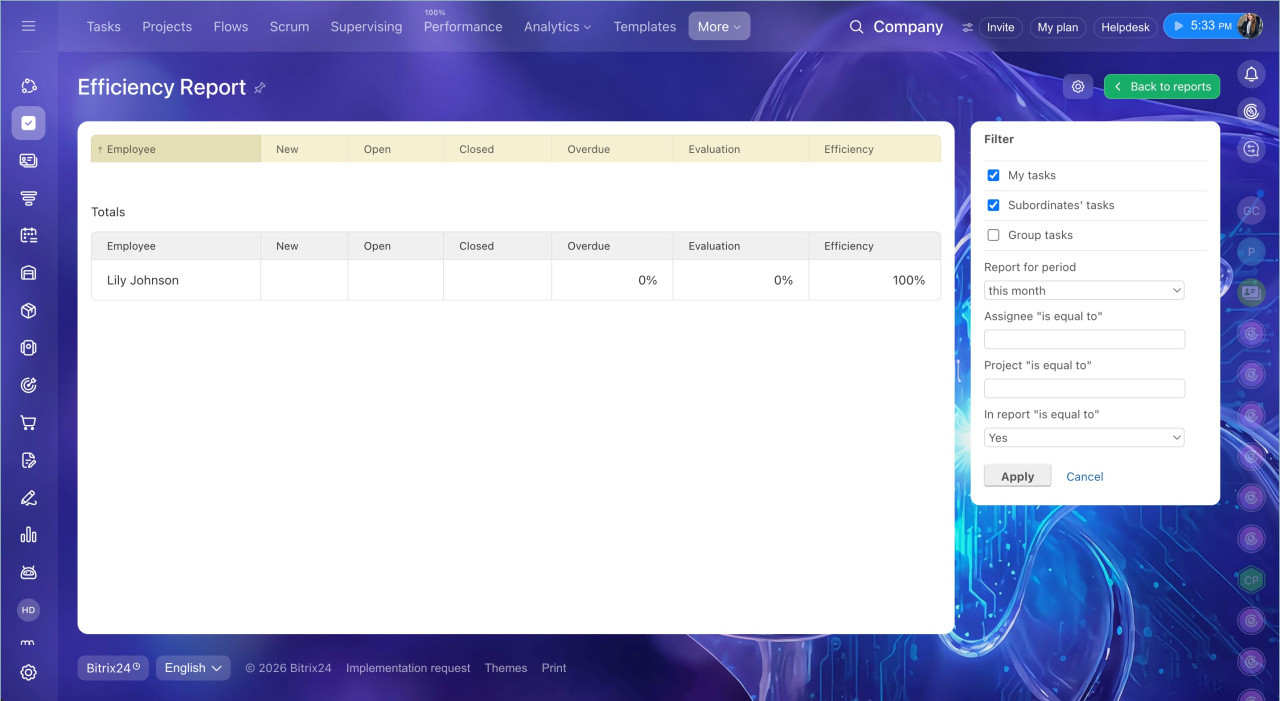
Efficiency report. It shows how each employee handles tasks: how many were completed on time, how many became overdue, and how tasks were rated. For example, one manager's overdue rate rises from 10% to 35% over two months. The supervisor reviews that manager's task list and finds 30 active assignments, while everyone else has only 10 to 12. The issue is not the employee. The workload is uneven.
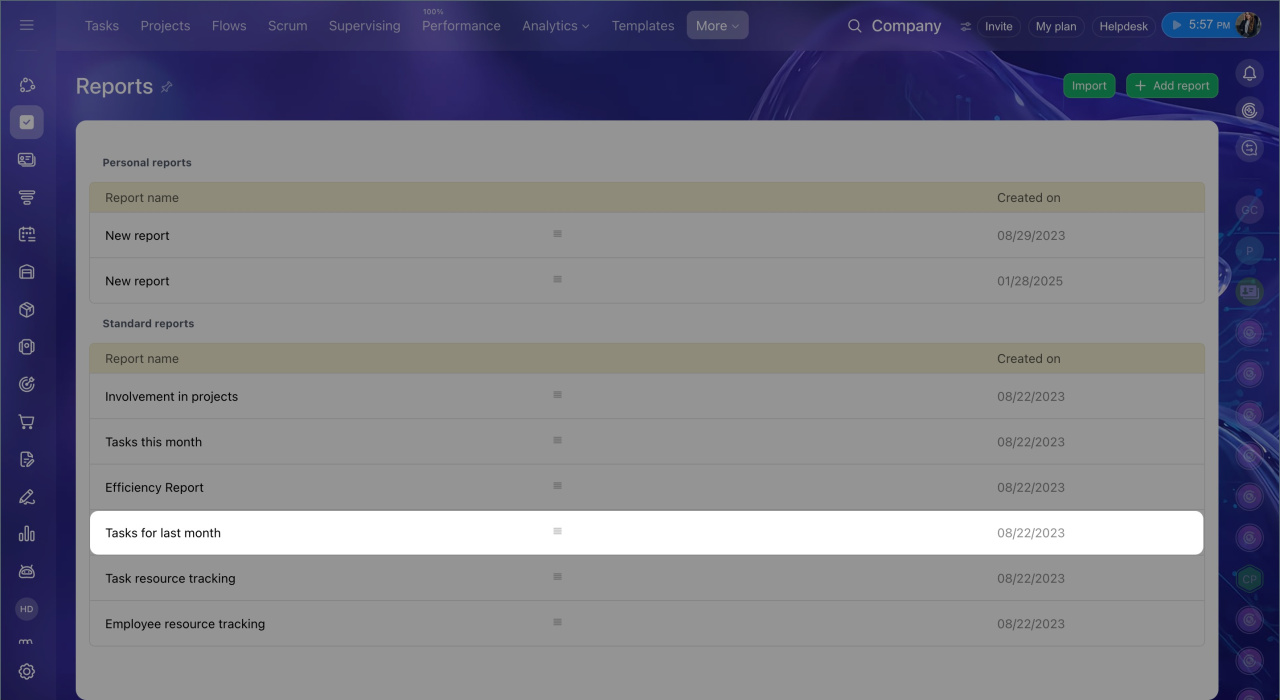
Tasks for last month. It shows the previous month's results by status and assignee. For example, a manager notices that the team is missing deadlines more often. He opens the report for the previous month and compares it with an earlier period. The report shows that the number of overdue tasks has almost doubled. This is a reason to investigate before the issue becomes recurring.
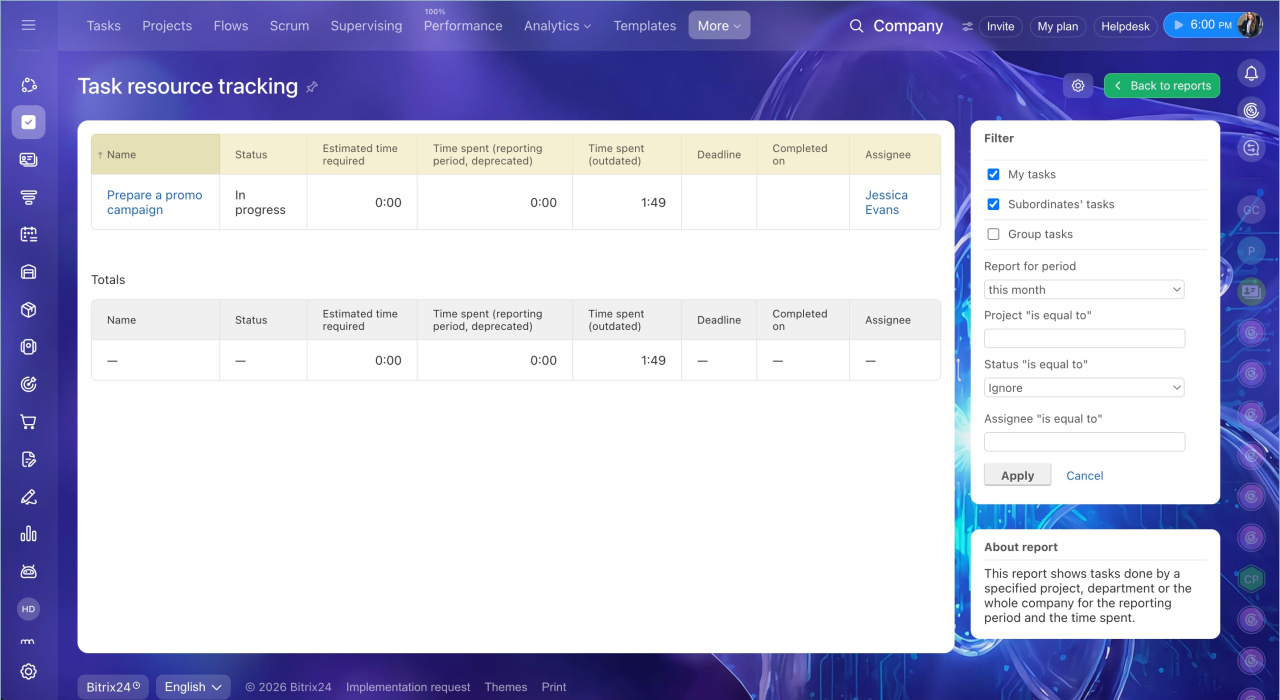
Task resource tracking. It shows planned and actual time spent on each task. For example, a task called Prepare a commercial proposal has 2 hours budgeted, but actually takes 6 to 8 hours. The next time this task is planned, a realistic time estimate should be used.
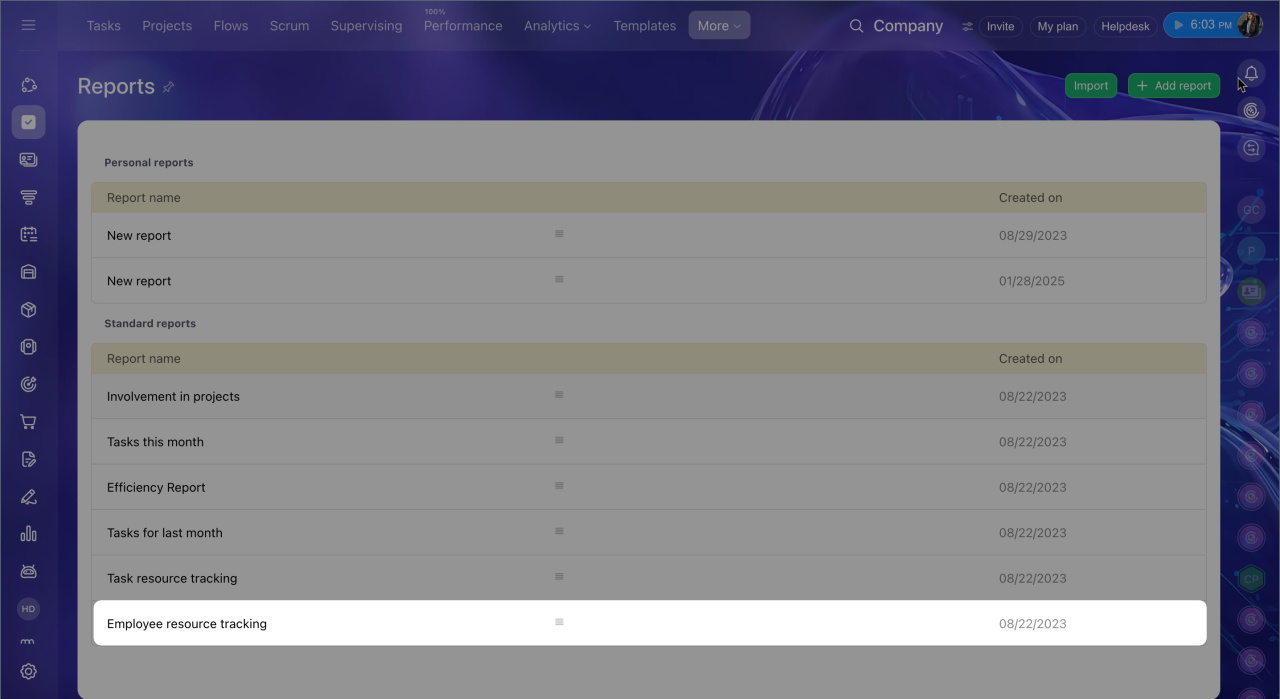
Employee resource tracking. It shows who spends time on tasks and how much. For example, a designer always seems busy, but the report shows that 70% of his time goes to revisions and approvals, and only 30% to creating new materials. This is a reason to rethink the approval process rather than hire a second designer.
Resource tracking reports only show data for tasks that have the Time tracking option enabled.
Personal reports are created using the report builder. You can choose the data, time period, employees, or projects for a specific request.
For example, a marketing manager wants to see only tasks from their department with a negative rating over the last six months. A personal report is the right tool for this — it is built for specific parameters using the report builder.
To create a new report, go to the reports page and click Add report in the top right corner.
Create reports on tasks
Monitor team work in real time
The Supervising section helps you track team work throughout the day. It shows key metrics for each direct report: efficiency, number of tasks, and their roles — assignee, task owner, assistant, and observer.
Unlike reports, which help you analyze work over a selected period, the Supervising section shows the current situation. A manager can immediately see who is overloaded and who is available for new tasks.
Bitrix24 plans and pricing
The section only shows direct reports — employees who have you listed as their manager in the company structure.
Company structure: New interface and features
For example, a manager starts the workday by opening the Supervising section and immediately sees that two employees have overdue tasks building up, while a new team member has only one active task. This makes it easy to redistribute work and avoid new delays without building separate reports.
To open the section, go to Tasks and Projects and click Supervising in the top menu. If you have many employees, use filters to quickly find a specific person or sort employees by efficiency and department.
Supervising option: How to track subordinates' tasks
When to use export
Export is useful when you need to combine Bitrix24 data with information from other systems, share it with people who do not have access to Bitrix24, or save a separate copy.
Combine data from different systems. Company leadership is preparing a quarterly report that includes task data, sales figures, and expenses from different systems. A department head exports the task report and combines it with the other data in xlsx format.
Share data with people who do not have access to Bitrix24. A client asks for project statistics for the past month. The manager exports the report and sends the spreadsheet. The client gets the data they need even without access to your Bitrix24.
Save data when a project is complete. A company wraps up a large project. The manager exports the report and stores it alongside the project documentation. If questions come up later about timelines, team workload, or the scope of work completed, the data will be easy to find.
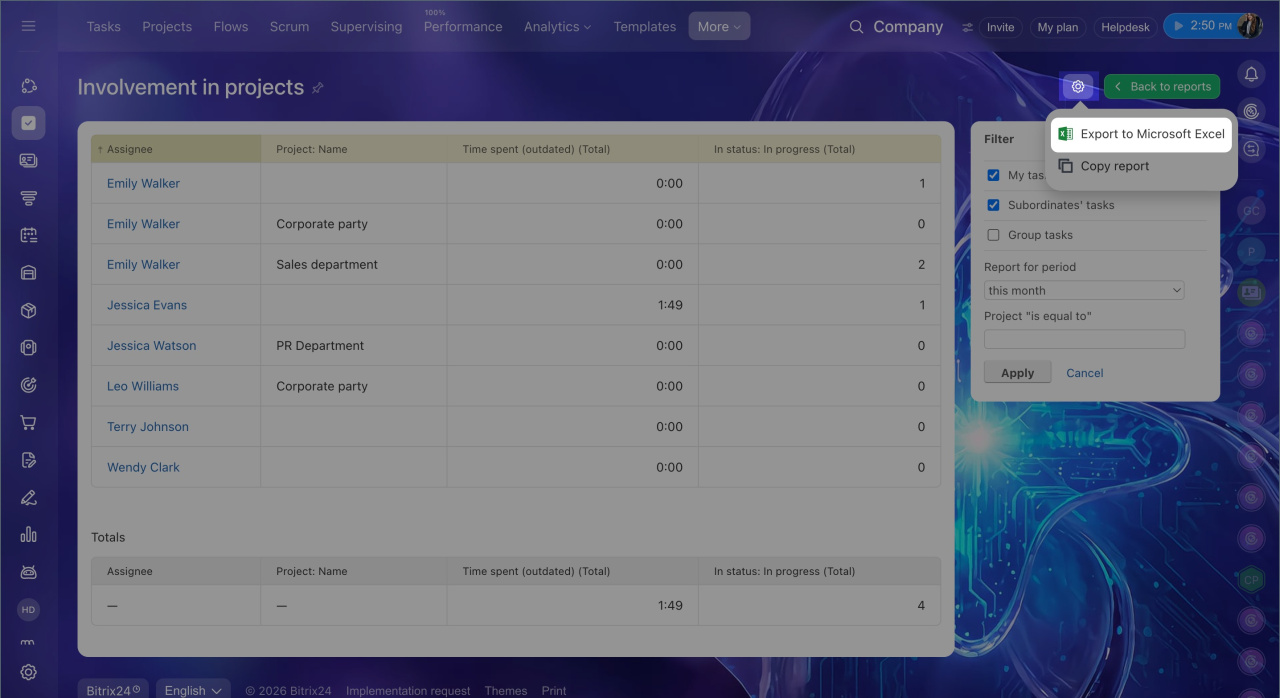
To export a report, open it and click Settings (⚙️) > Export to Microsoft Excel in the top right corner.
In brief
- Task reports give you a complete view of team performance.
- Bitrix24 offers two types of reports: standard reports with six ready-made templates, and personal reports built with the report builder for specific needs.
- Standard reports cannot be edited, but you can copy any of them and customize the copy.
- The Supervising section shows the current status of your direct reports in real time.
- Export data when you need to work with it outside Bitrix24: share it with colleagues who do not have access, combine it with other sources, or save an archived snapshot.