The gross profit report shows the difference between sales revenue and cost of products sold. This difference is called gross profit and reflects the company's income. The second important indicator in the report is gross margin. It shows the percentage of profit as a percentage of total sales.
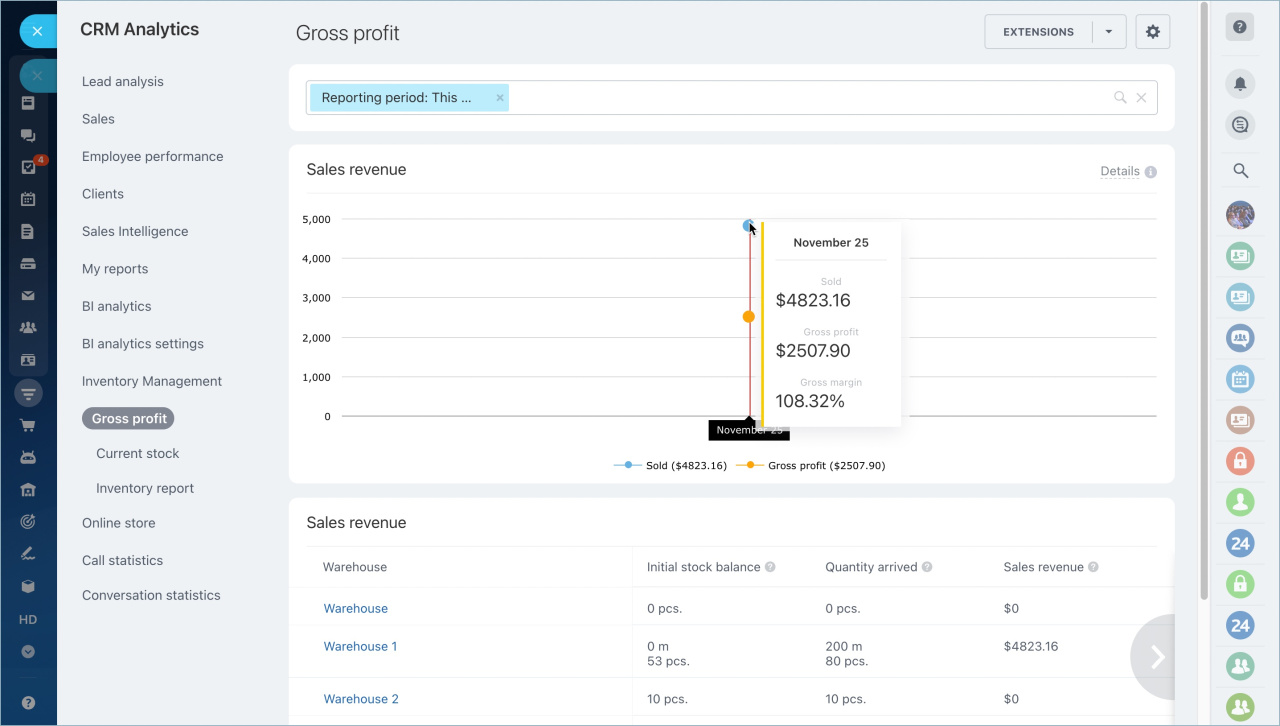
The graphs in the report show how much products were sold by date, as well as gross profit and gross margin. You will be able to evaluate profit of the products in a certain warehouse and each product individually.
How the report is organized and what indicators it contains
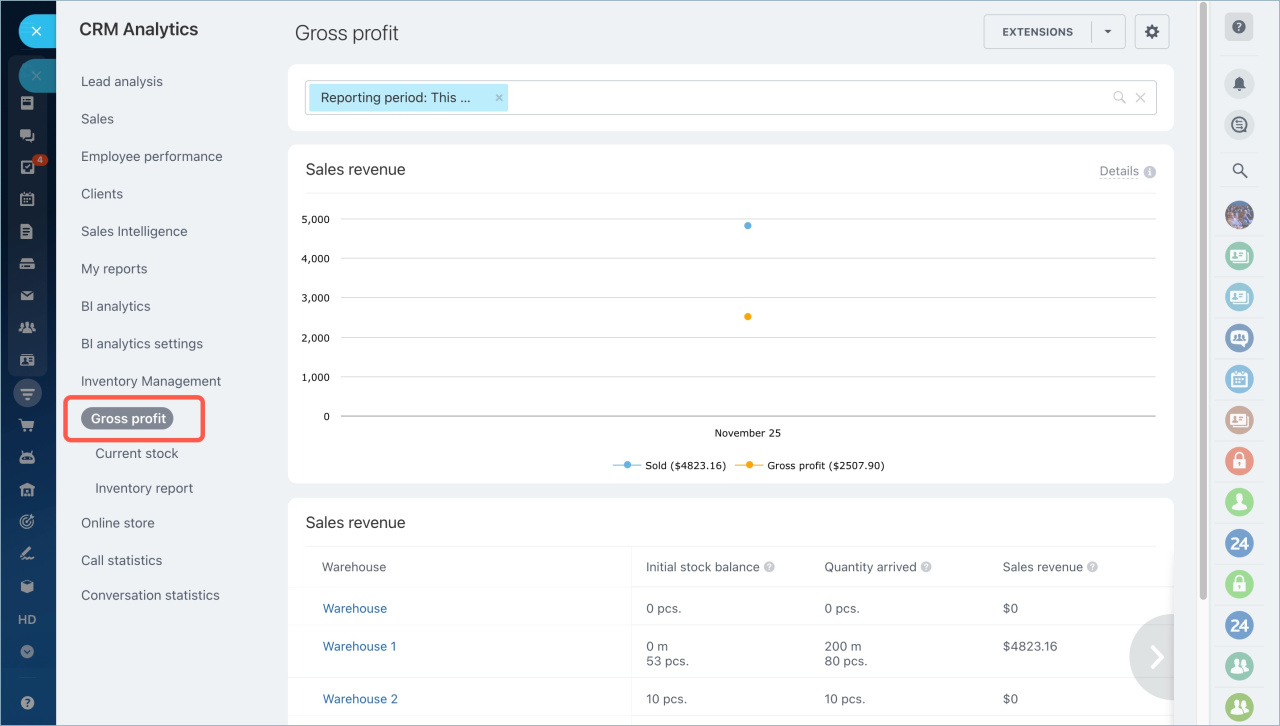
To view the report, go to the Inventory management - Analytics - Gross profit.
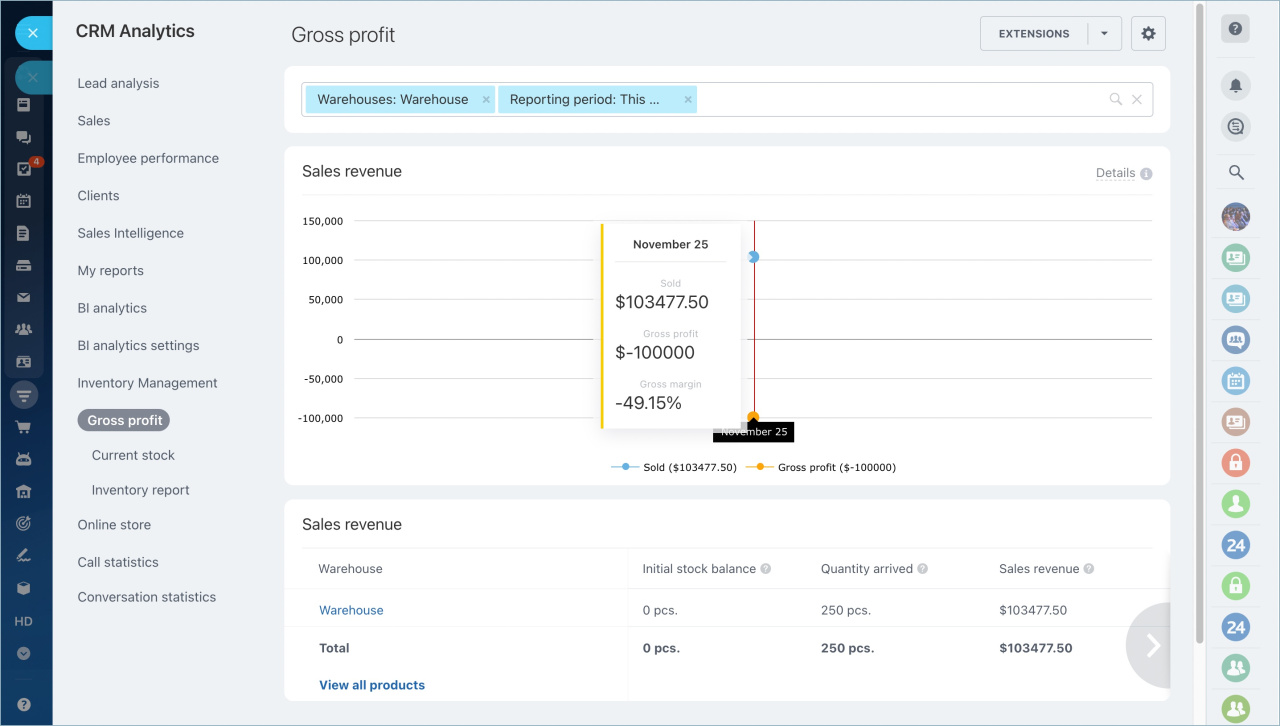
The graph at the top of the report shows total sales, gross profit and gross margin.
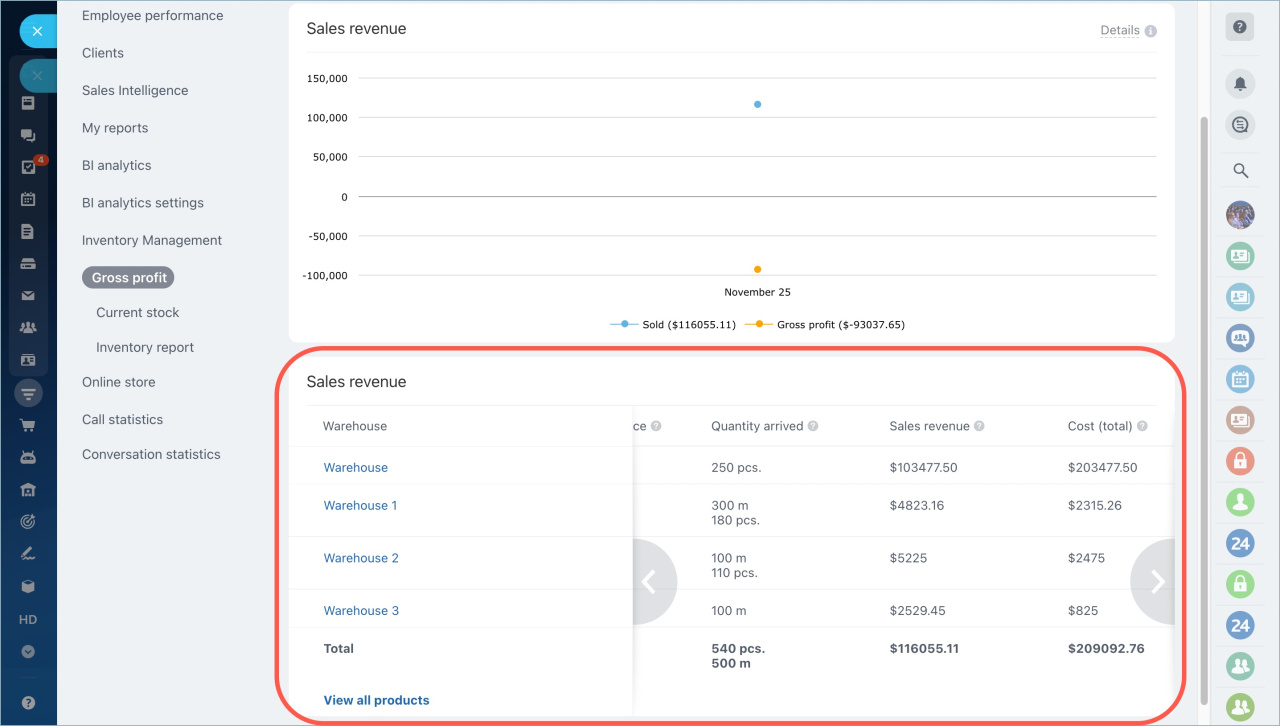
There is a table with detailed information on each warehouse at the bottom of the report. It will help you evaluate which warehouses sell better.
- Initial stock balance — the balance of products at the beginning of the selected period.
- Quantity arrived — the amount of products that entered the warehouse in total.
- Sales revenue — total number of sales for the period according to the conducted sales documents. If the indicator is growing, the demand is increasing. A low indicator may indicate problems in sales.
- Cost (total) — total cost of goods sold for the period. It shows how much money were spent to purchase products.
- Gross profit — the difference between the sum of sales and the sum of cost. If the profit is high, the goods are in demand and the selling price is correctly formed.
- Gross margin — calculated gross profit divided by total cost of sales and multiplied by 100. A high profit margin means that the cost of goods from stock was low compared to the price at which they were sold.
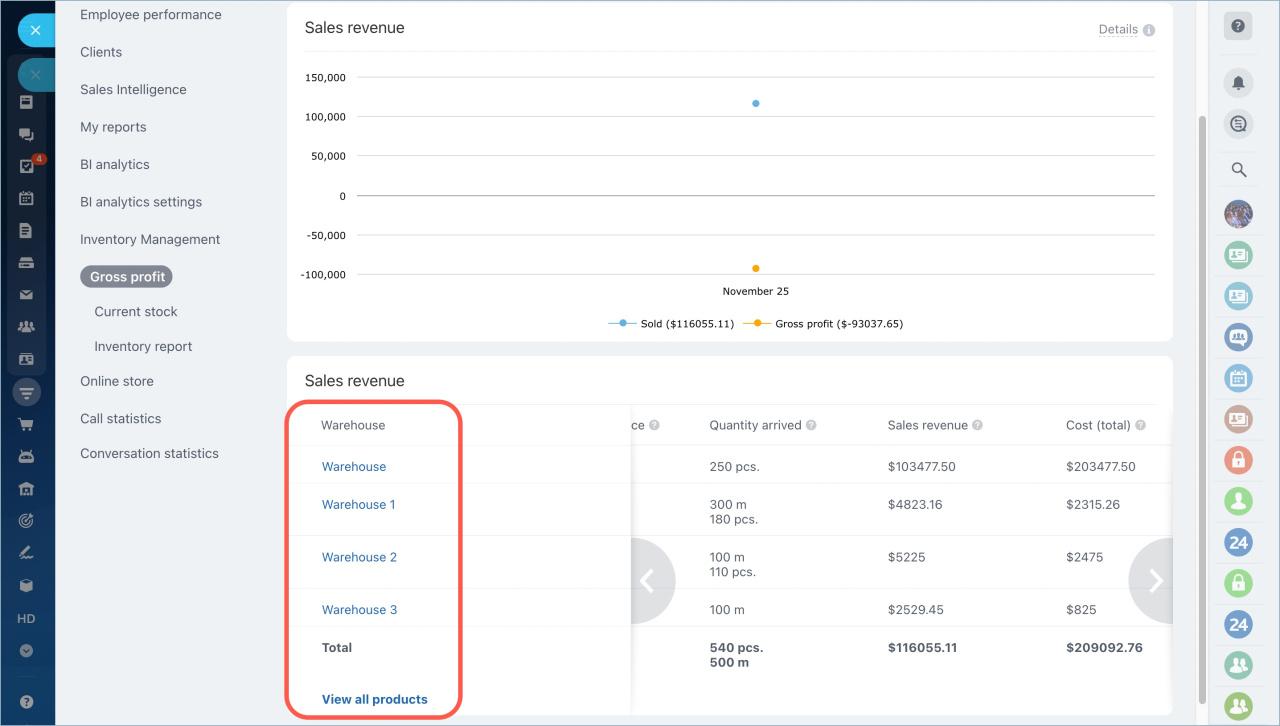
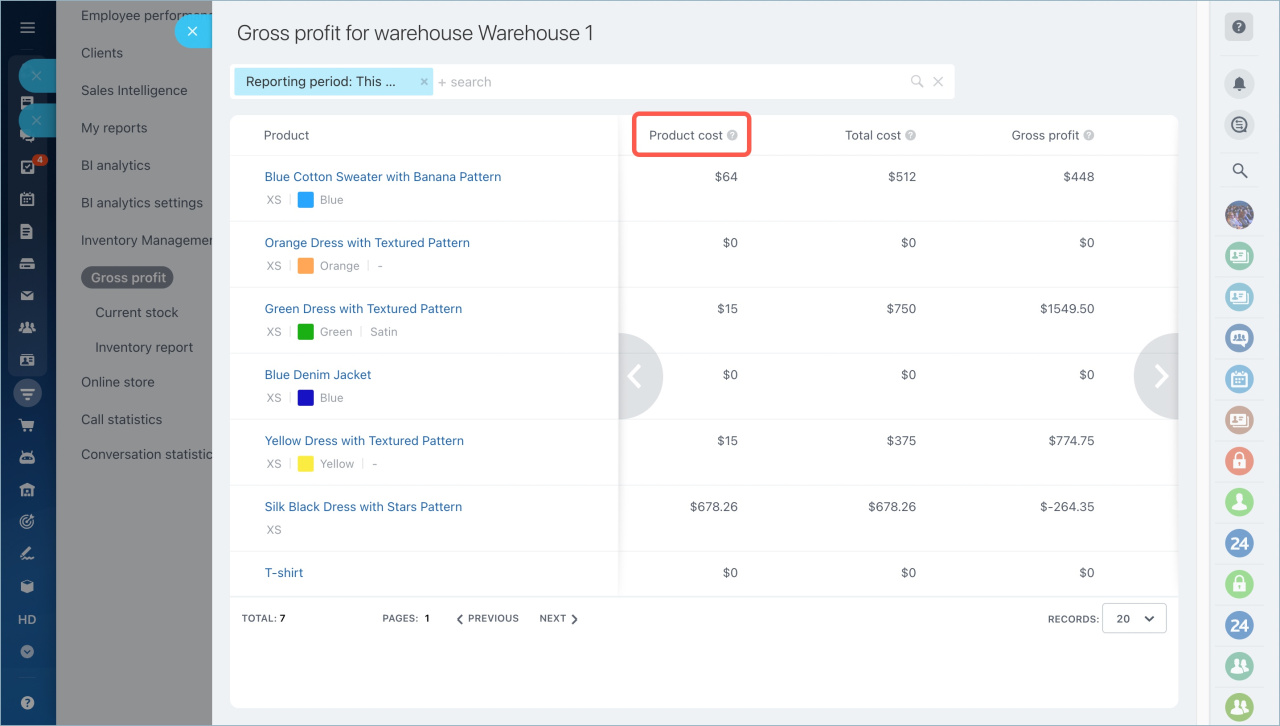
Gross profit calculation can be viewed for each product in a specific warehouse or for all products for the selected period. Click on the warehouse name or View all products.
You will see the calculation of indicators for each product. The report shows the product cost for the selected period. It is calculated on the basis of sale orders.
What conclusions can be drawn from the report
The report shows the dynamics of sales by date. It allows you to evaluate the profit of all the products.
Gross profit and gross margin indicators can be negative if the cost of goods exceeds their selling price. This happens when a company sells off goods at discounts or purchase prices have risen sharply, but the selling price has not changed.
In brief:
- The gross profit report shows the difference between sales revenue and cost of products sold. This difference is called gross profit and reflects the company's income. The second important indicator in the report is profit margin. It shows the percentage of profit as a percentage of total sales.
- The report shows the calculation of gross profit for each product in a particular warehouse or for all products for a selected period.
- Gross profit and gross margin indicators can be negative if the cost of goods exceeds their selling price.
Read also:

