All filter settings and links to charts are enabled in the ready dashboards by default. To properly analyze business indicators, customize your dashboard. Disable unnecessary filters and move or delete unnecessary charts. Learn about the basic settings in this article to get started.
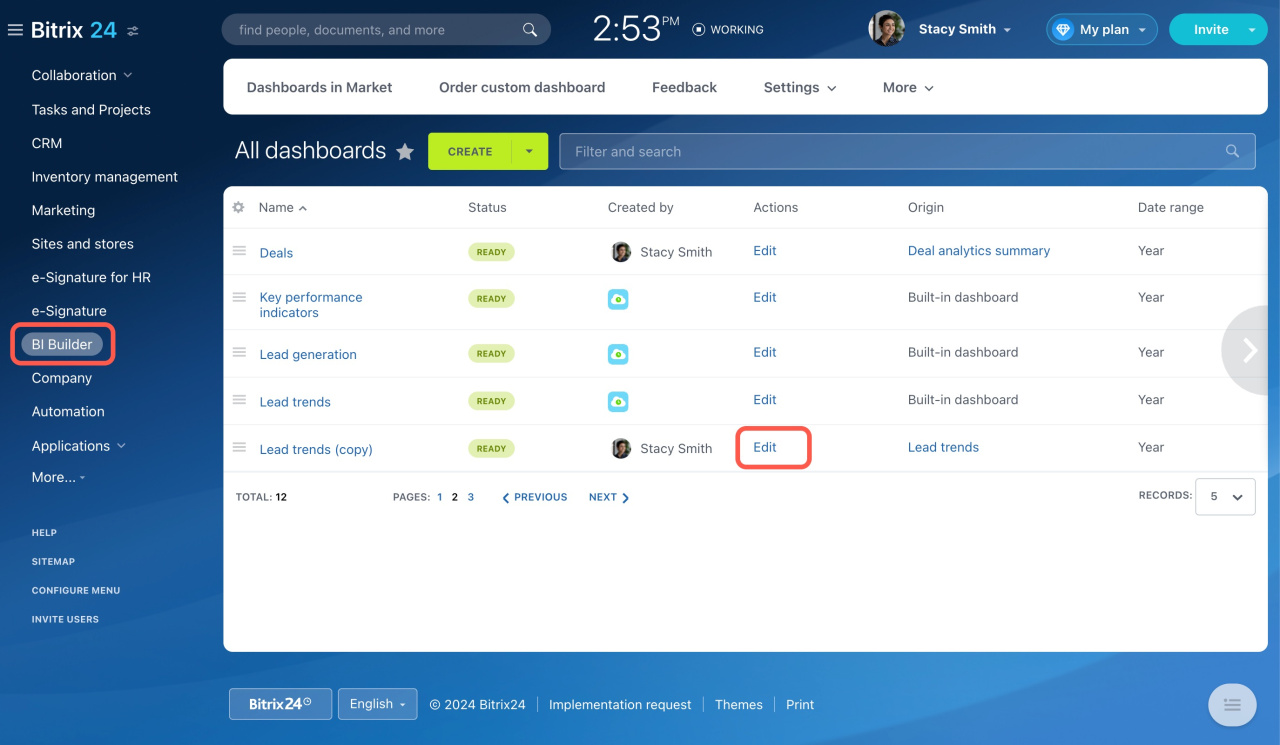
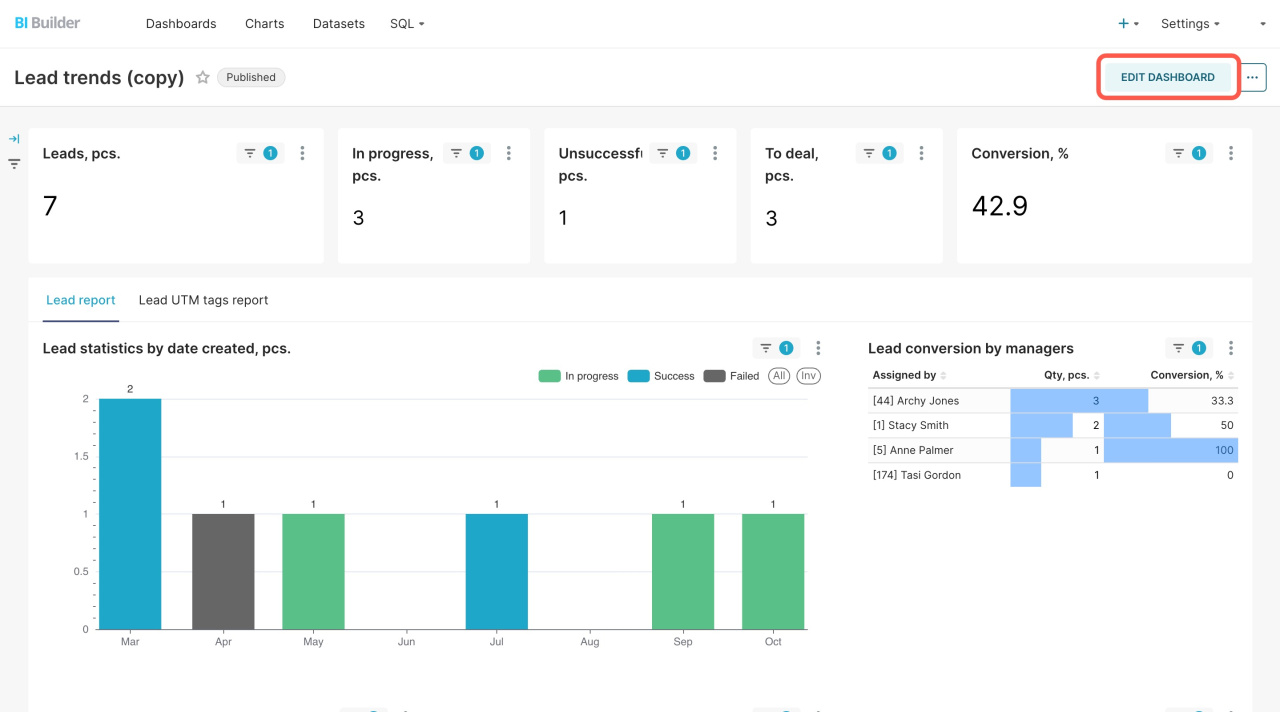
To customize a dashboard, go to the BI Builder section, select a dashboard, and click Edit.
Edit dashboards in BI Builder
Then you can perform the actions described below.
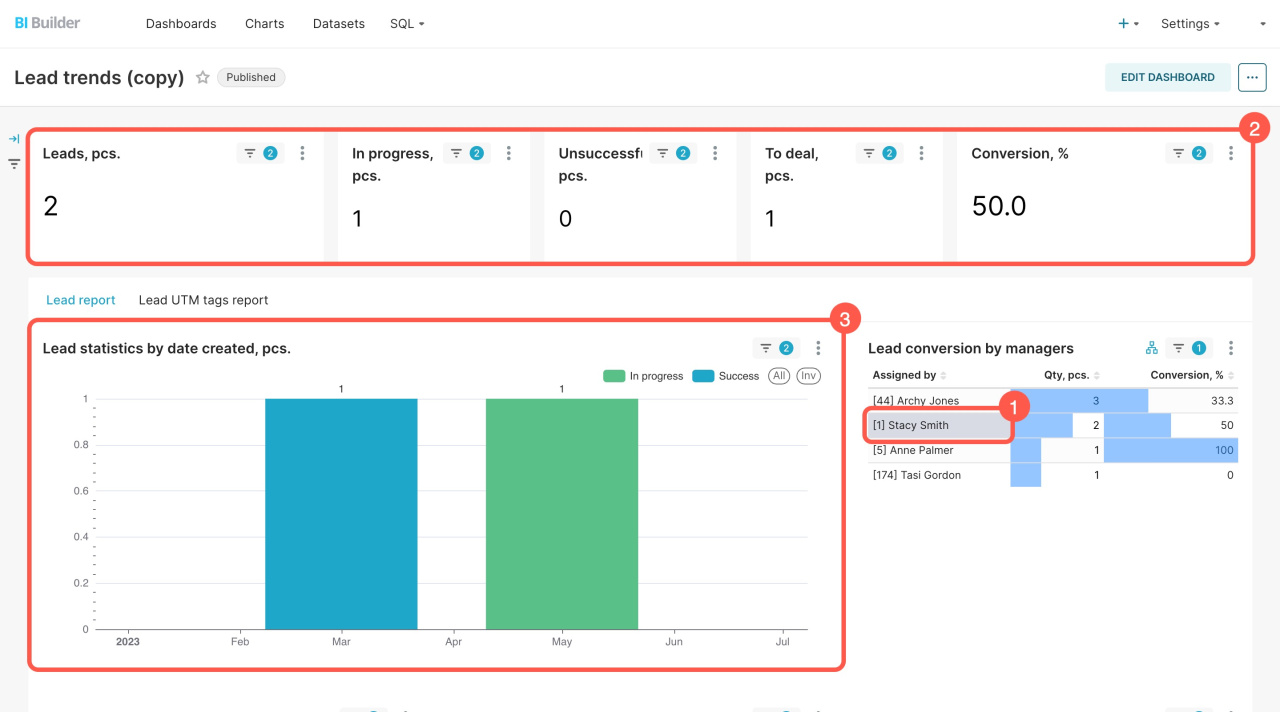
Configure cross-filters. A cross-filter automatically filters data in one chart when you click on an element of another chart. For example, if you select an employee in the Lead conversion by managers table, all related charts will update.
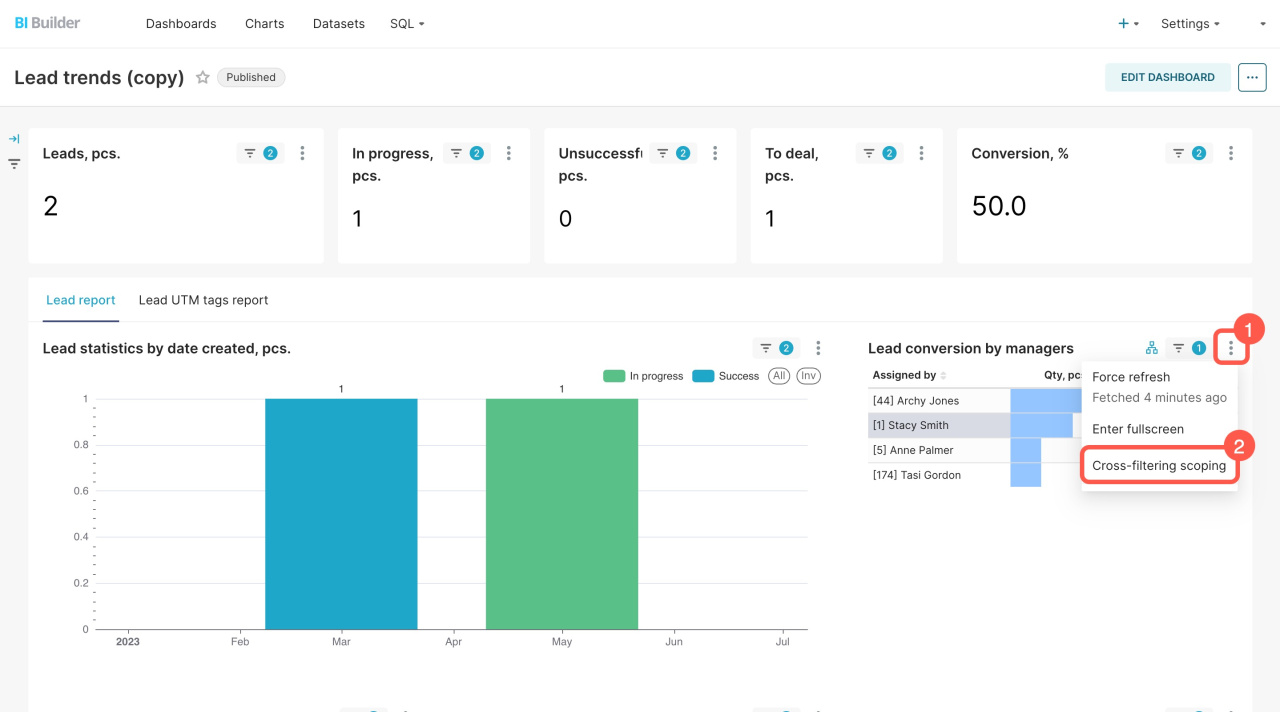
To disable the linking of the chart to other dashboard elements,
-
Open the Menu (≡).
-
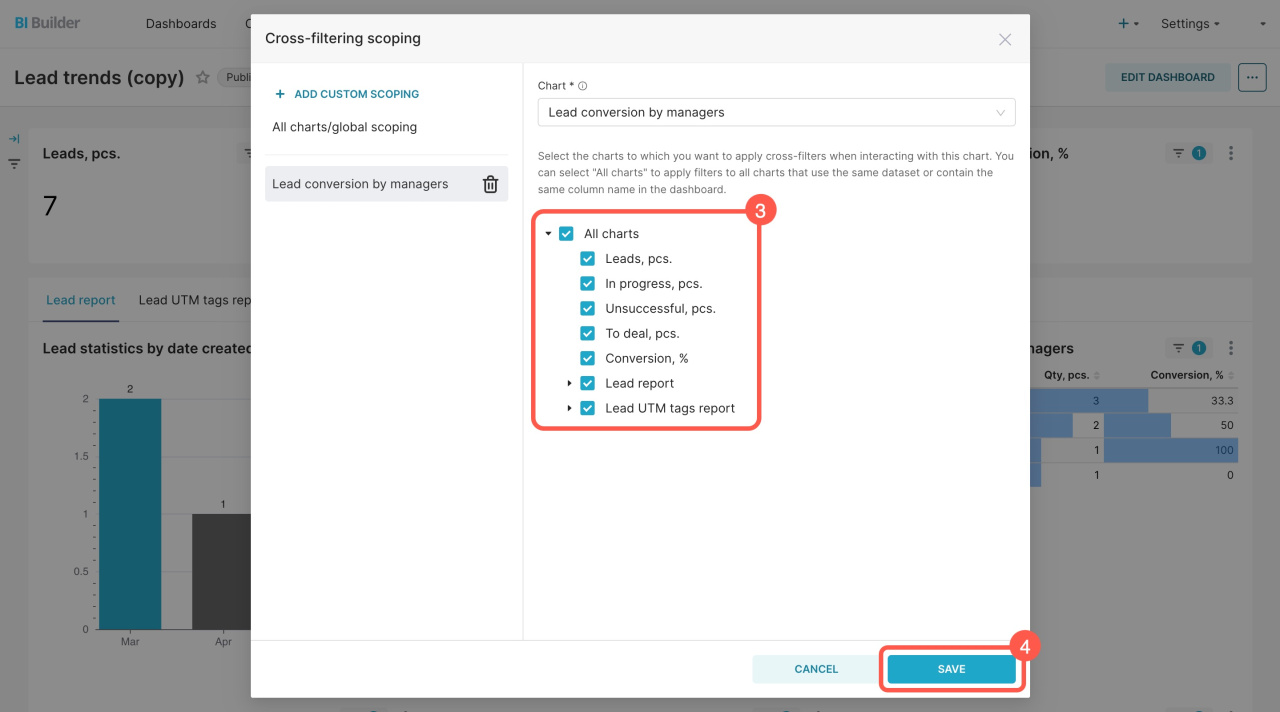
Select Cross-filtering scoping.
-
Disable unnecessary links.
-
Click Save.
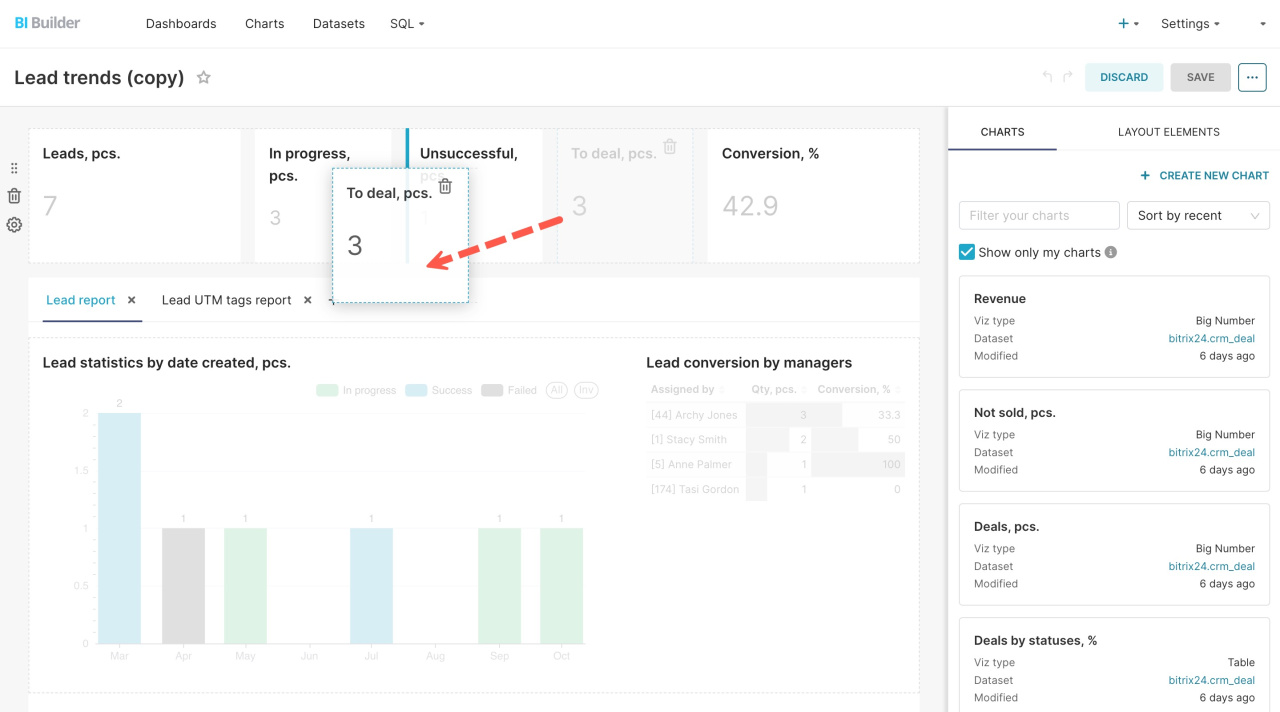
Move the elements. If you are not satisfied with the arrangement of the items in the charts, you can change it. Click Edit Dashboard, select an item, and move it to the desired part of the dashboard.
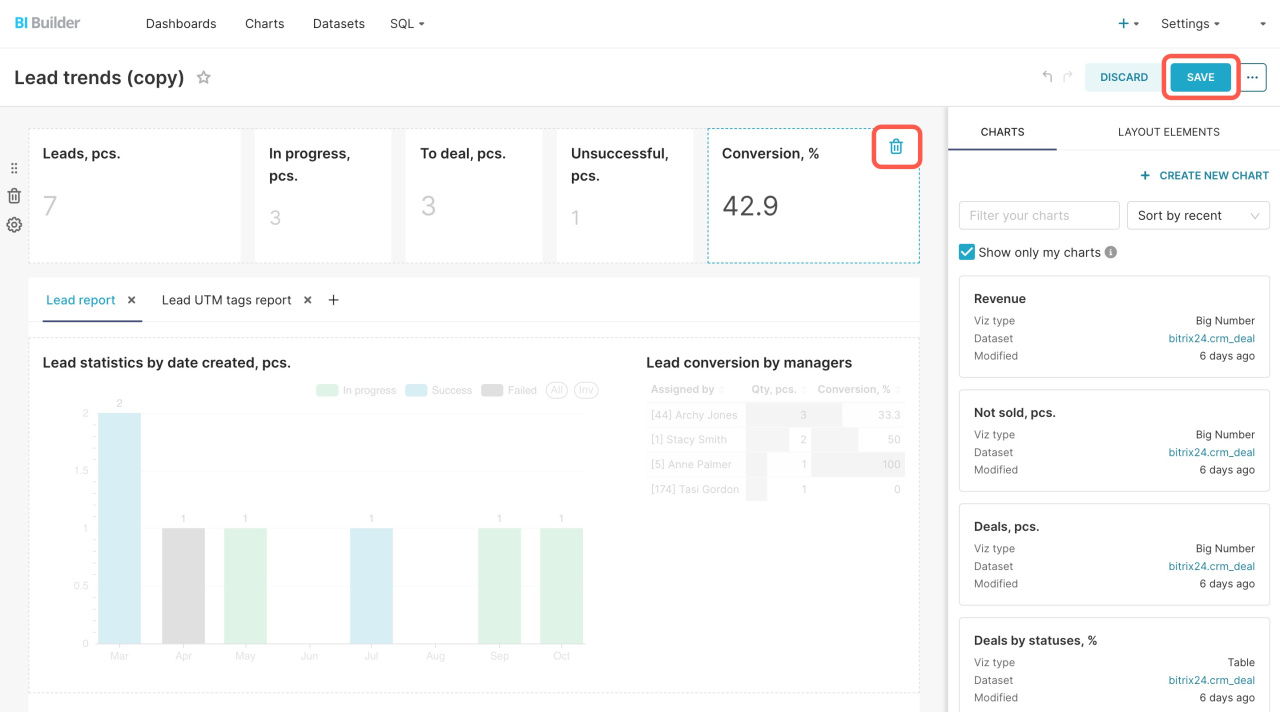
Remove unnecessary elements. If you don't need some graphs, click the ![]() icon next to the graph or table and save the changes.
icon next to the graph or table and save the changes.
In brief
- To properly analyze business indicators, customize the ready dashboards. Disable unnecessary filters and move or delete unnecessary charts.
- Go to the BI Builder section and click Edit to customize a dashboard.
- Configure cross-filters. A cross-filter automatically filters data in one chart when you click on an element of another chart. Before using the dashboard, customize each chart and see how its cross-filters affect other charts.
- To move or delete items in the dashboard, use edit mode.
Read also:

