Datasets contain information on leads, deals, companies, and other items. Each item has multiple datasets that automatically include both standard and custom fields. Use these datasets to create charts and analyze business performance indicators.
In this article, we'll explore datasets for products, how to blend them, and how to create charts.
Datasets:
- Products — crm_product
- Product properties — crm_product_property
- Product property values — crm_product_property_value
Examples:
Datasets
To start analyzing data on a dashboard, select a dataset and create a chart based on it.
Products — crm_product: Includes basic information about products from the catalog, such as their names, types, and prices.
Products — crm_product
| Field | Description | Field type |
|---|---|---|
| ID | Unique ID | Number |
| NAME | Name | String |
| TYPE | Product type | String |
| PARENT_ID | Parent product unique ID | Number |
| MEASURE | Unit of measurement | String |
| PRICE | Price | Number |
Product properties — crm_product_property: Contains information about the properties of each product, like color, size, or material.
Product properties — crm_product_property
| Field | Description | Field type |
|---|---|---|
| ID | Unique ID | Number |
| NAME | Name | String |
Product property values — crm_product_property_value: Provides information on the specific values of product properties, such as a particular color or size.
Product property values — crm_product_property_value
| Field | Description | Field type |
|---|---|---|
| ID | Unique ID | String |
| PROPERTY_ID | Property unique ID | Number |
| PRODUCT_ID | Product unique ID | Number |
| VALUE | Value | String |
How to create a chart
Use datasets to create charts and check business performance. For example, evaluate sales volume or which products are selling more often.
Go to the BI Builder and follow these steps:
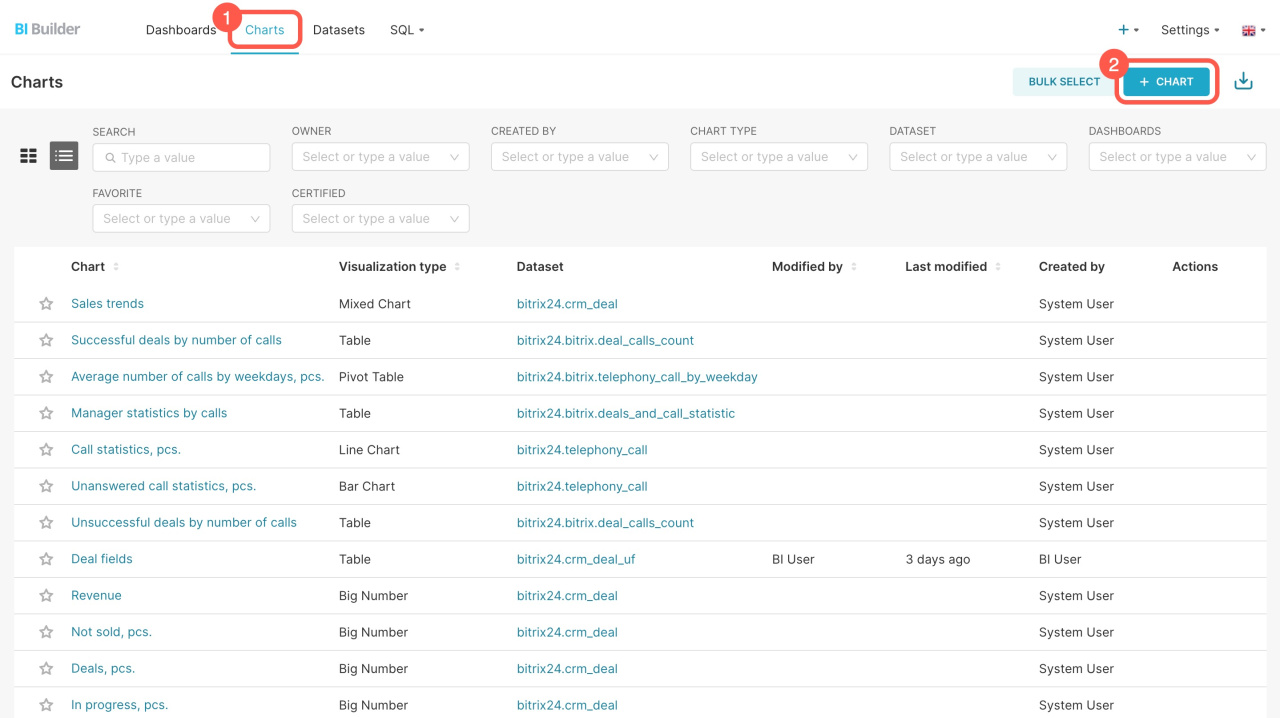
- Open the Charts tab.
- Click + Chart.
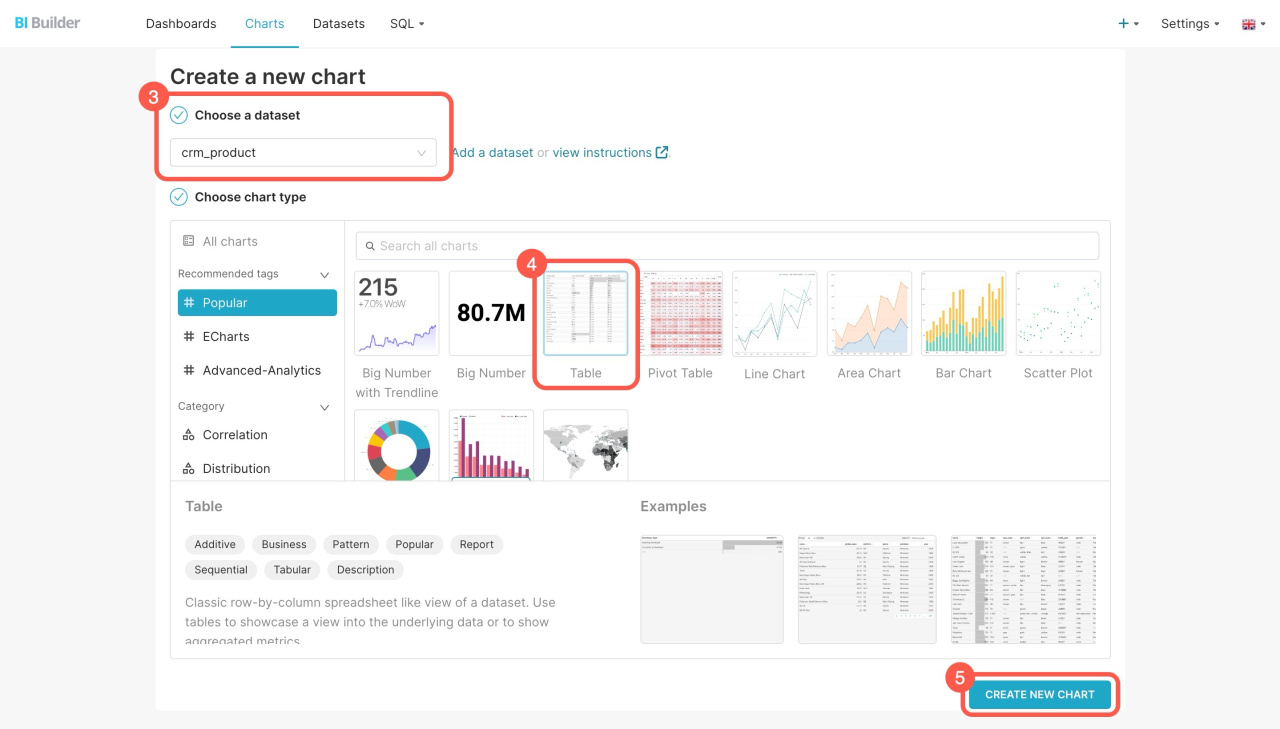
- Select the dataset from the list.
- Choose a format for showing the data: big number, table, line chart, or others.
- Click Create new chart.
How to blend datasets
Combine datasets to include both standard and custom product fields in your report and see what properties the products have.
Go to the BI Builder and do the following:
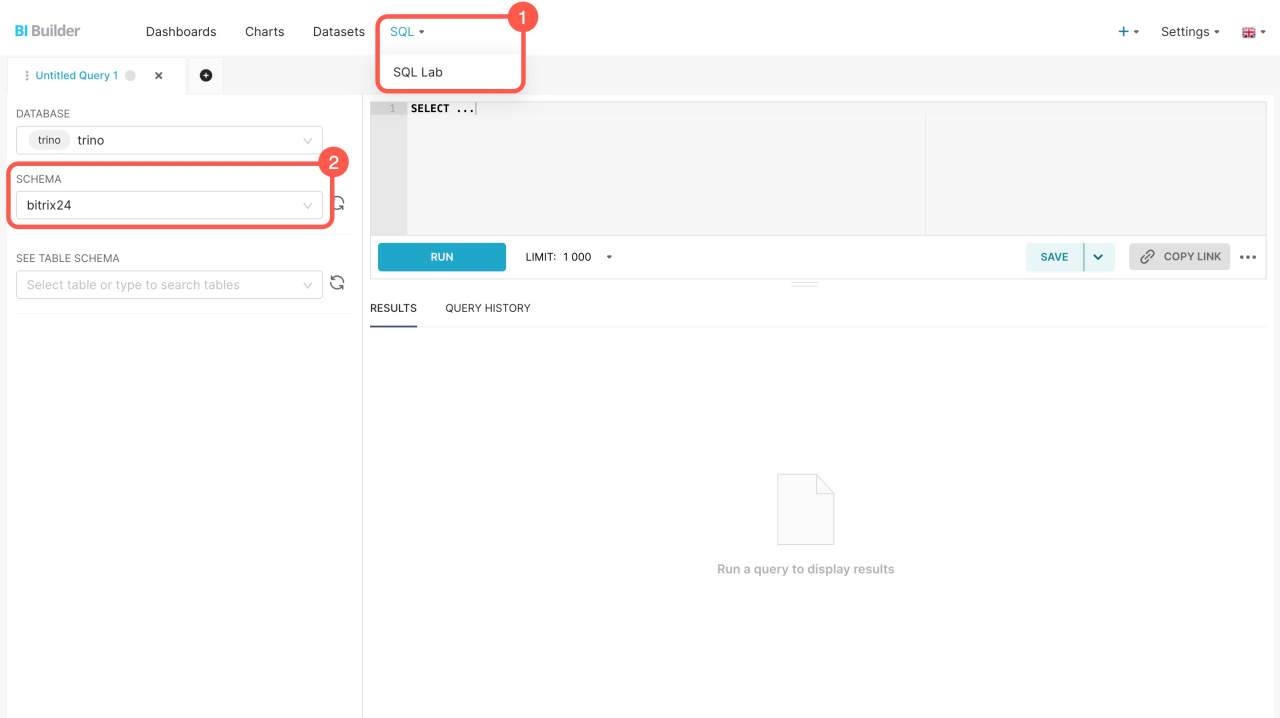
- Go to SQL > SQL Lab.
- Select the bitrix24 scheme.
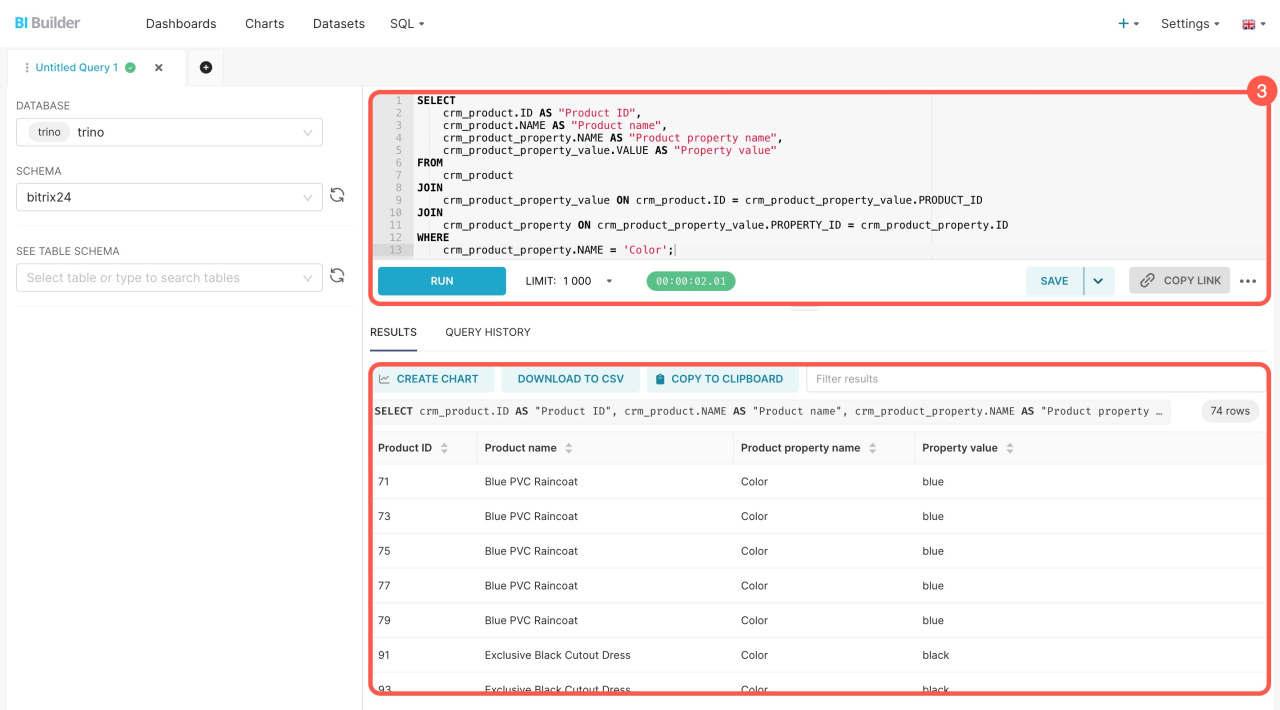
- Enter the SQL query and click Run.
The new set includes information from the fields that you specified in the SQL query. You can save it as a dataset to create a chart for the dashboard.
Create a chart based on a virtual dataset
If you're blending datasets for the first time, refer to the sample query.
Example of an SQL query
Here's an SQL query to extract data from three datasets: products (crm_product), product properties (crm_product_property) and product property values (crm_product_property_value). You can copy it and see how it works. The query selects all products with the Color property and shows their values.
SELECT
    crm_product.ID AS "Product ID",
    crm_product.NAME AS "Product name",
    crm_product_property.NAME AS "Product property name",
    crm_product_property_value.VALUE AS "Property value"
FROM
    crm_product
JOIN
    crm_product_property_value ON crm_product.ID = crm_product_property_value.PRODUCT_ID
JOIN
    crm_product_property ON crm_product_property_value.PROPERTY_ID = crm_product_property.ID
WHERE
    crm_product_property.NAME = 'Color';
SELECT: Chooses which data to extract. For example, the SELECT crm_product.ID AS "Product ID" part does the following:
- Selects the product
IDfrom thecrm_productdataset - Assigns it the name
Product ID - Displays the result in a separate column
FROM: Specifies the main table for the query, such as the crm_product table containing product information.
JOIN: Connects the crm_product table to crm_product_property_value by product ID. The query connects each product with its properties.
JOIN: Connects the crm_product_property_value table to crm_product_property by product property ID. The query connects the values of the product properties with the property names.
WHERE: Filters the query results to show only products with the property name "Color." You'll get a list of products from the catalog sorted by color. To filter for a specific color, add this condition: AND crm_product_property_value.VALUE = 'blue';. This will show you a list of products that are only blue.
In brief
-
Datasets contain information on leads, deals, companies, and other items.
-
Each item has multiple datasets that automatically include both standard and custom fields.
-
There are three datasets for catalog products: products (crm_product), product properties (crm_product_property), and product property values (crm_product_property_value).
-
Use these datasets to create charts and analyze business performance indicators. Charts can reveal the sales volume or which products are selling more often.
-
Blend datasets to combine data from both standard and custom product fields in your report and see what properties the products have. To do this, write an SQL query, save the result as a dataset, and create a chart.


