Now you can connect Facebook and Google Ads in BI Builder. This allows you to analyze account information and assess your advertising investments.
For example, connect a Facebook Ads account to see costs and find out which ads get more traffic. The information is automatically gathered into datasets for ad sources and expenses. You can use this data to create a dashboard to see how well your ads are working and if they're worth the cost.
This article explains how to connect an ad account and start working with advertising datasets.
Datasets:
Examples:
How to connect ad accounts
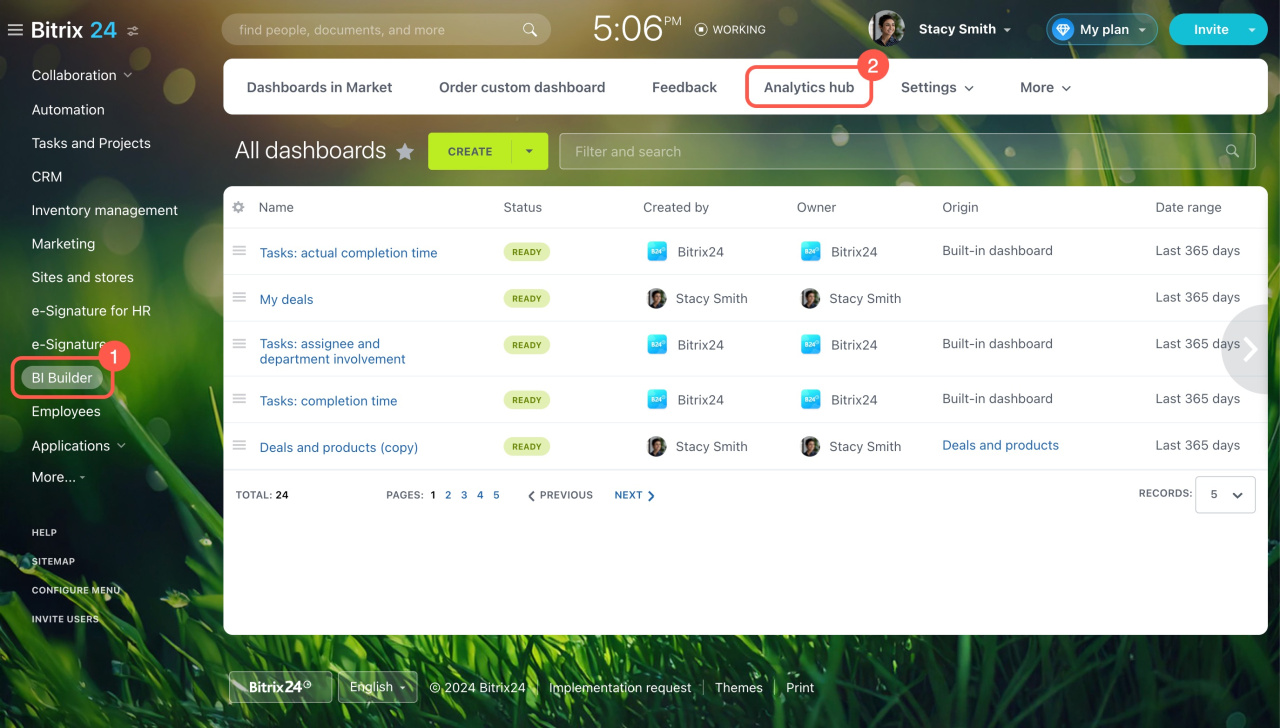
- Go to BI Builder.
- Open the Analytics hub tab.
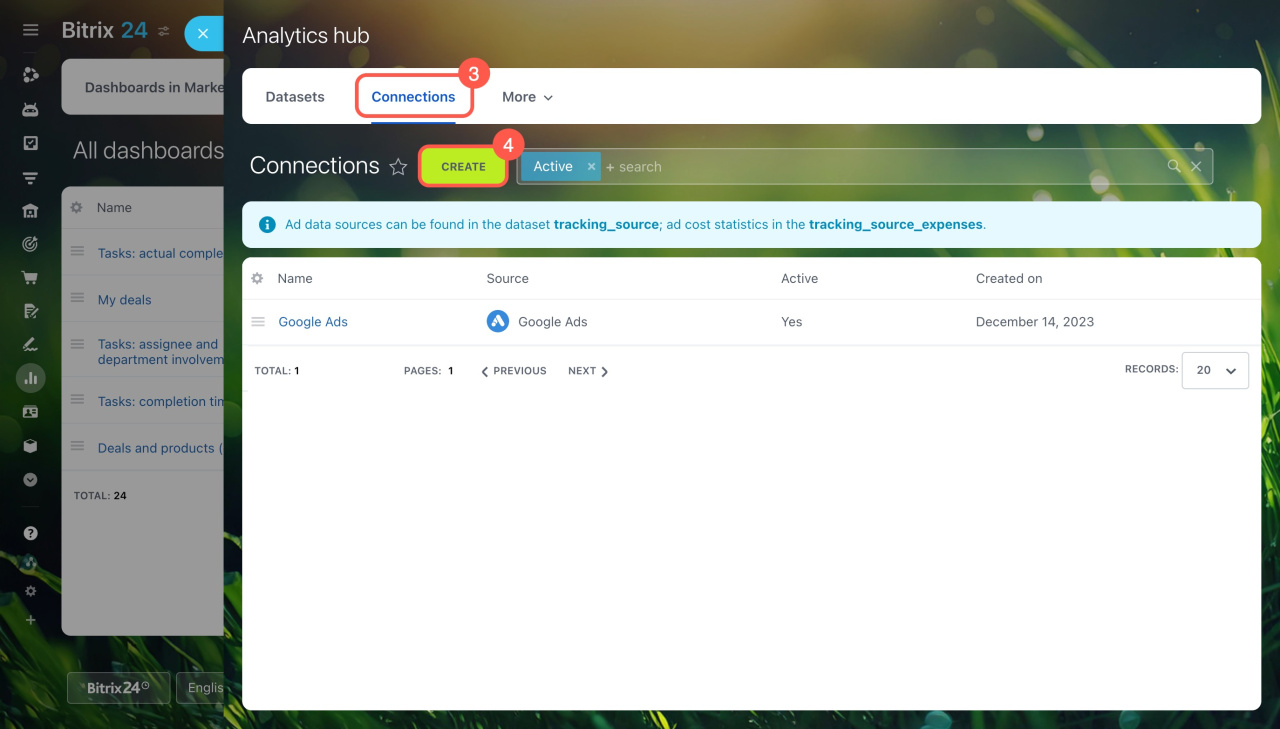
- Switch to Connections.
- Click Create.
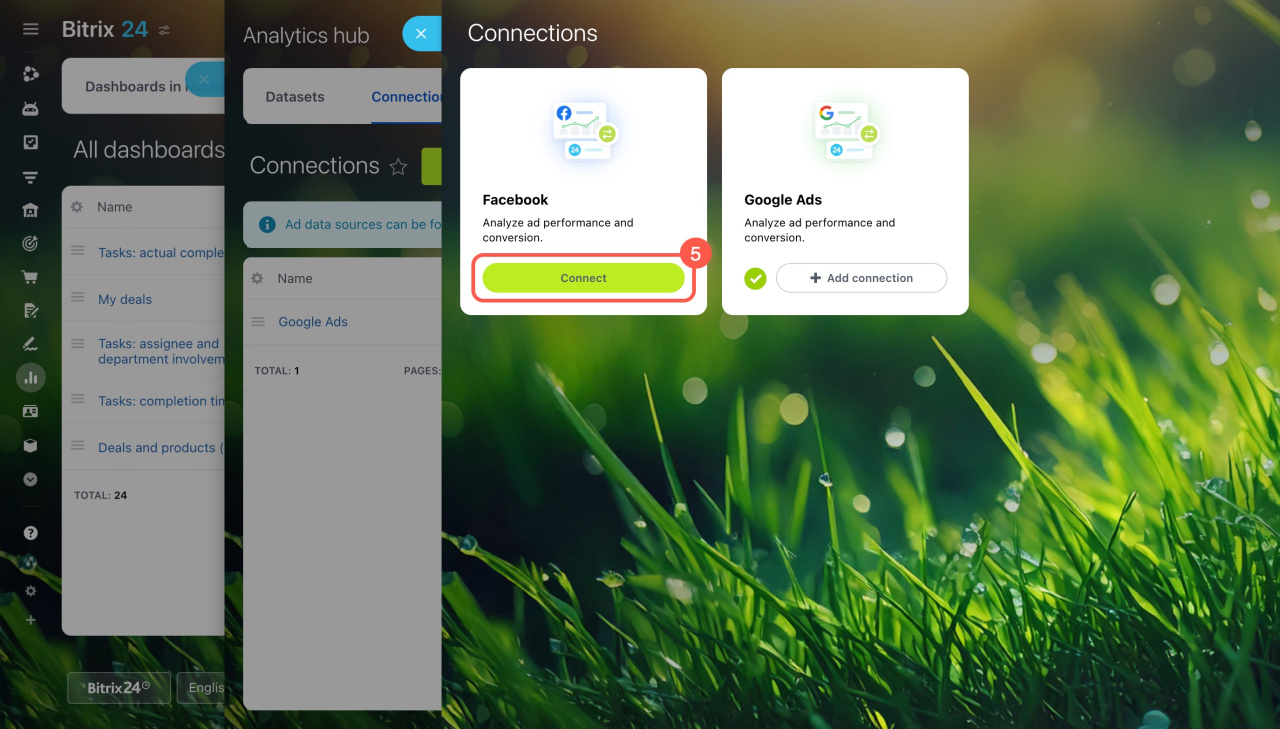
- Select an ad account and click Connect.
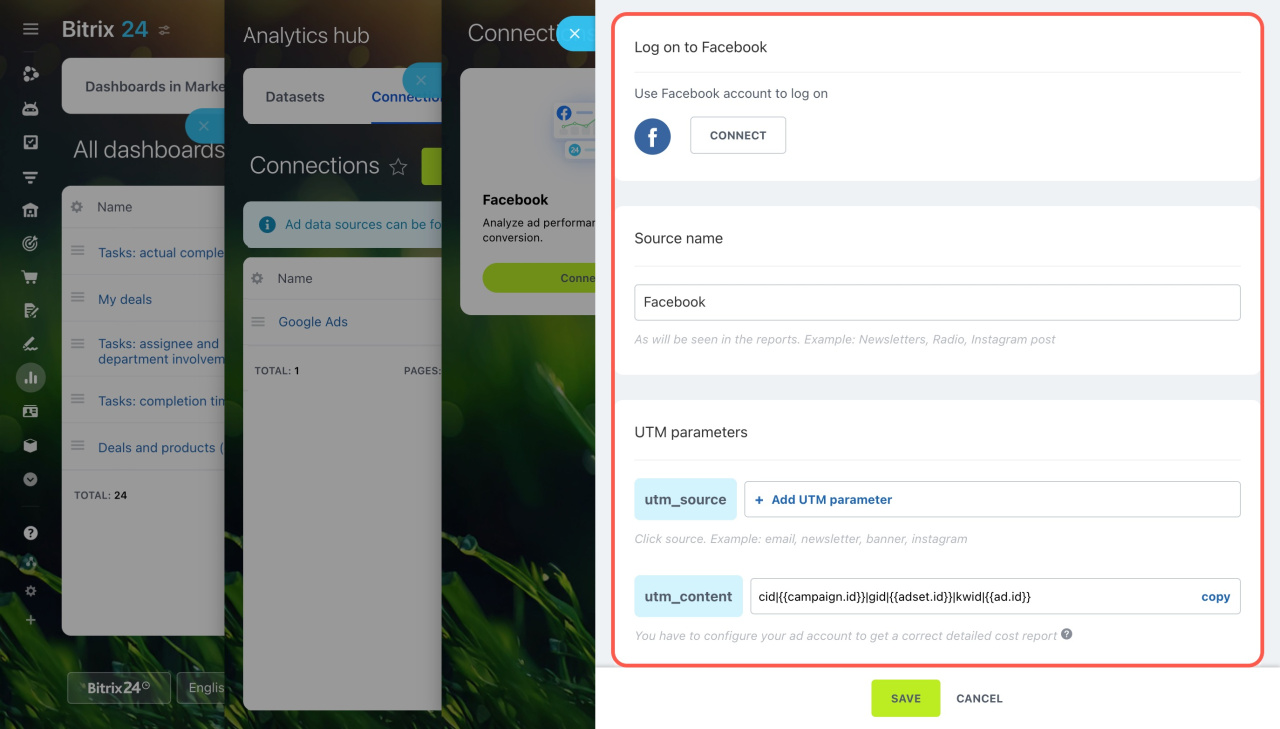
Here's how to connect a Facebook Ads account in three steps:
-
Log in to Facebook. Click Connect and log in to your Facebook Ads account, so BI Builder can access your ad campaign data.
-
Specify the source name. This will appear in the dataset. By default, it's named Facebook, but you can choose your own.
-
Add a UTM parameter. Set a value for the utm_source parameter to show where customers came from.
How to use datasets
To get data on advertising sources, use the following datasets:
tracking_source — ad data sources: This includes details about all connected ad sources, such as unique source IDs, names, and UTM parameters.
tracking_source
| Field | Description | Data type |
|---|---|---|
| ID | Source ID | Number |
| NAME | Source name | String |
| UTM_SOURCE_LIST | List of utm_source parameters | String array |
tracking_source_expenses — ad cost statistics: This provides daily ad cost statistics, including currency, number of clicks, impressions, and actions.
When using tracking_source_expenses, the query might fail due to a large volume of data. To reduce the load, apply filters and define the required period using the WHERE operator. For example, to get data for specific dates, use this query:
SELECT *
FROM tracking_source_expenses
WHERE DATE BETWEEN DATE('2024-11-01') AND DATE('2025-01-02')
tracking_source_expenses
| Field | Description | Data type |
|---|---|---|
| SOURCE_ID | Source ID | Number |
| EXPENSES | Expenses per day | Fractional number |
| CURRENCY | Currency | String |
| DATE | Date | Date |
| CAMPAIGN_NAME | Advertising campaign name | String |
| CAMPAIGN_ID | Advertising campaign ID | String |
| CLICKS | Number of clicks | Number |
| IMPRESSIONS | Number of impressions | Number |
| ACTIONS | Number of actions | Number |
| CPM | Cost per thousand impressions | Fractional number |
| CPC | Cost per click | Fractional number |
| GROUP_NAME | Ad group name | String |
| GROUP_ID | Ad group ID | String |
| AD_NAME | Ad name | String |
| AD_ID | Ad ID | String |
| UTM_MEDIUM | Traffic type specified in the utm_medium parameter, e.g., paid click cpc (cost-per-click). | String |
| UTM_SOURCE | Traffic source specified in the utm_source parameter, e.g., facebook. | String |
| UTM_CAMPAIGN | Campaign name from the utm_campaign parameter. | String |
| UTM_CONTENT | Additional information about ad content from utm_content, which may include display conditions, targeting, and other ad details. For example, automatic tagging may use variables like {keyword}, {phrase_id}, {device}. | String |
Facebook Ads data processing
BI Builder collects creative-level data from Facebook Ads. Since the same creative can be used across multiple ads, performance analysis is based on the creative and its parameters. This approach ensures accurate tracking of advertising expenses.
How data collection works. Expenses and links are retrieved from Facebook API elements. The primary object used to extract links and UTM parameters is the AdCreative. BI Builder checks fields that may contain links in a predefined priority order. If a UTM parameter is found, it is used; if not, the system proceeds to the next available field.
Field priority for link extraction:
-
url_tags: A set of parameters applied to all ad links within the creative. If a link already has these parameters, the values from url_tags will overwrite them. -
template_url,object_url: Direct or template links specified in the AdCreative. -
template_url_spec: This field is skipped because it contains different links for iOS, Android, and Web. Since parameters can vary between platforms, this field is excluded to avoid incorrect data collection. -
object_story_spec: Used in static ads. This may include links like link_data.link, template_data.link, and video_data.link. BI Builder checks all valid fields within this object. Fields like text_data and photo_data are ignored because they don’t contain links. -
call_to_action → value → link: Links from action buttons, such as "Learn More". -
asset_feed_spec → link_urls: An array of links used in dynamic ads, such as website_url or carousel_see_more_url from gallery cards. BI Builder goes through the array and extracts links if they contain parameters. -
asset_feed_spec → call_to_actions → url_tags: Tracking parameters applied to action buttons in dynamic ad cards. BI Builder processes the call_to_actions array and extracts url_tags if they are specified. -
value.link(nested objects): The last field checked if no links or parameters are found in higher-priority fields.
Behavior and special cases. If multiple links are present in the same object, such as object_url and template_url, BI Builder selects the field with higher priority. If an ad includes both object_story_spec and asset_feed_spec, both objects are processed. However, links are only extracted from text fields. Arrays, multimedia assets, or objects that do not include links are ignored.
Dynamic values. UTM parameters can use templates like {{field_name}}. BI Builder replaces supported variables with actual values:
- {{ad.id}}, {{ad.name}}
- {{adset.id}}, {{adset.name}}
- {{campaign.id}}, {{campaign.name}}
If a link includes one of these variables, BI Builder replaces it with the corresponding value. Any unsupported templates remain unchanged.
For example, if url_tags contains utm_medium=cpc and template_url_spec has utm_medium=social, the final URL will include utm_medium=cpc. This is because the value from url_tags takes priority and overwrites the parameter in the link.
Google Ads data processing
BI Builder collects Google Ads data at the individual ad level. This approach ensures accurate tracking of advertising expenses.
How data collection works. Data is retrieved from Google Ads via the API by querying the ad_group_ad resource.
Google Ads Query Builder (ad_group_ad)
BI Builder extracts the following fields:
segments.date: The date on which the data is displayed.campaign.id,campaign.name: The campaign ID and name.ad_group.id,ad_group.name: The ad group ID and name.ad_group_ad.ad.id,ad_group_ad.ad.type: The ad ID and type.customer.currency_code: The currency used in the advertising account.metrics.impressions,metrics.clicks,metrics.cost_micros,metrics.average_cpc,metrics.average_cpm: Statistics on impressions, clicks, and expenses.ad_group_ad.ad.text_ad.headlineandresponsive_search_ad.headlines: Ad headlines.
How UTM parameters are extracted. Links with UTM parameters are retrieved from the ad_group_ad.ad.final_urls field, which contains the ad's destination URLs along with any ValueTrack parameters. BI Builder analyzes ad links and replaces supported dynamic parameters with actual values. Supported dynamic parameters include:
- {campaignid} — Replaced with the actual campaign.id.
- {creative} — Replaced with ad_group_ad.ad.id.
- {adgroupid} — Replaced with ad_group.id.
All other parameters in the link remain unchanged.
Mapping ValueTrack Parameters with Report Fields
BI Builder supports all ad types that use the final_urls field, including TEXT_AD and RESPONSIVE_SEARCH_AD. If an ad doesn't contain final_urls or the link is missing, UTM parameters cannot be extracted.
UTM parameters are only taken from the primary link in final_urls, which is the first URL in the array. Supported variables are automatically replaced with actual values. All other parameters, including unsupported ValueTrack parameters, remain unchanged in the link.
How to create a chart
Add information from the dataset to charts to keep track of advertising expenses. For example, assess which ads get more traffic.
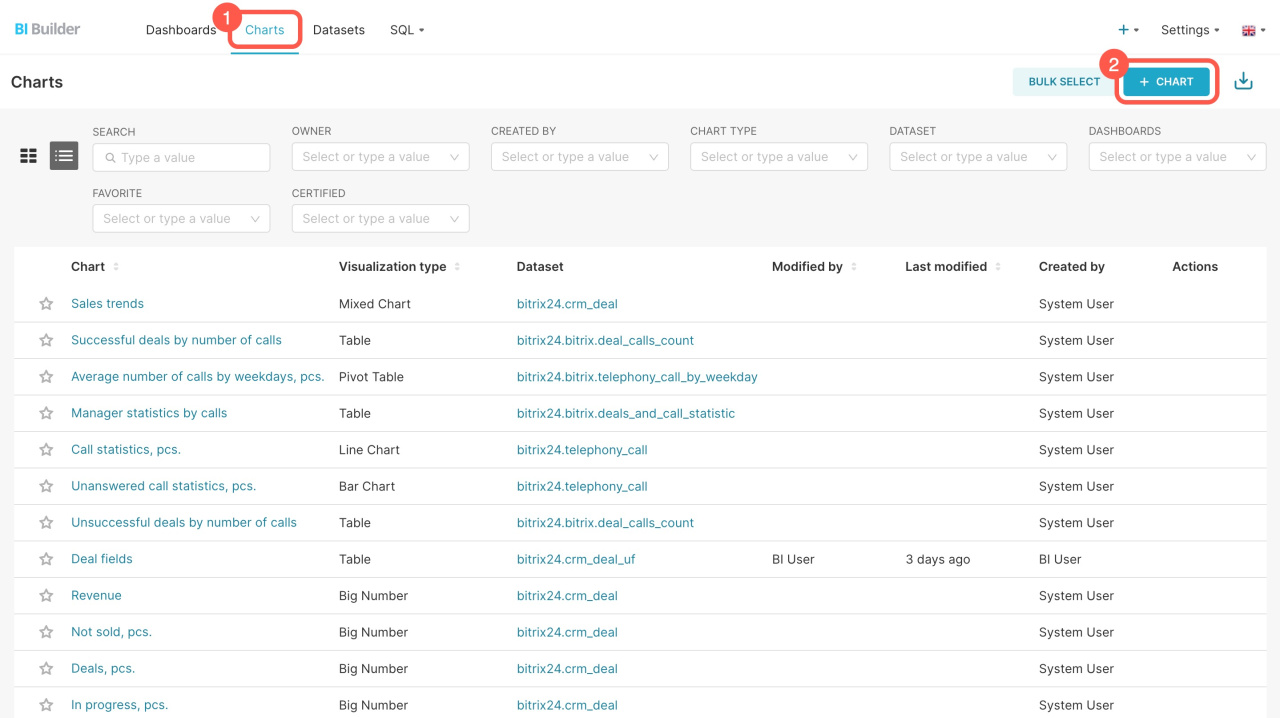
- Go to BI Builder and open the Charts tab.
- Click + Chart.
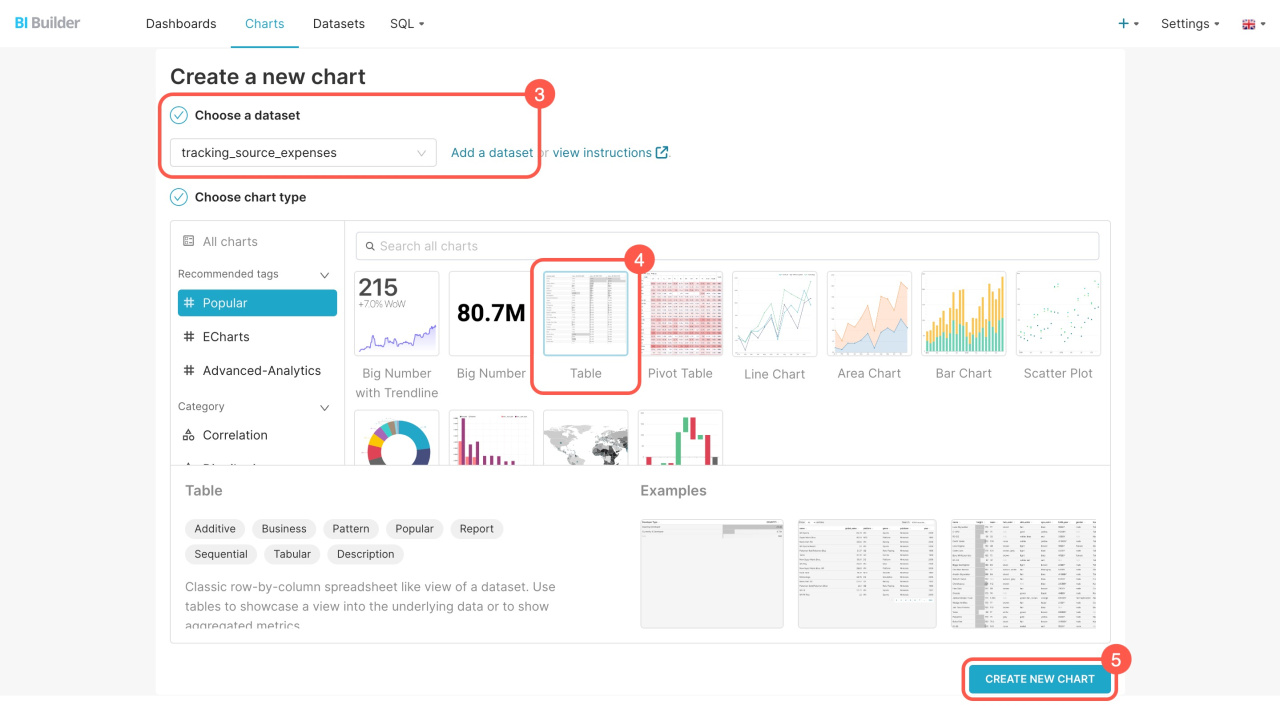
- Select the dataset from the list. If you don't see the one you need, click Add a dataset to create a new one.
How to create a dataset - Choose a format for showing the data: big number, table, line chart, or others.
- Click Create new chart.
How to blend datasets
Combine datasets to add information about advertising sources and expenses to the dashboard.
To blend datasets, do the following:
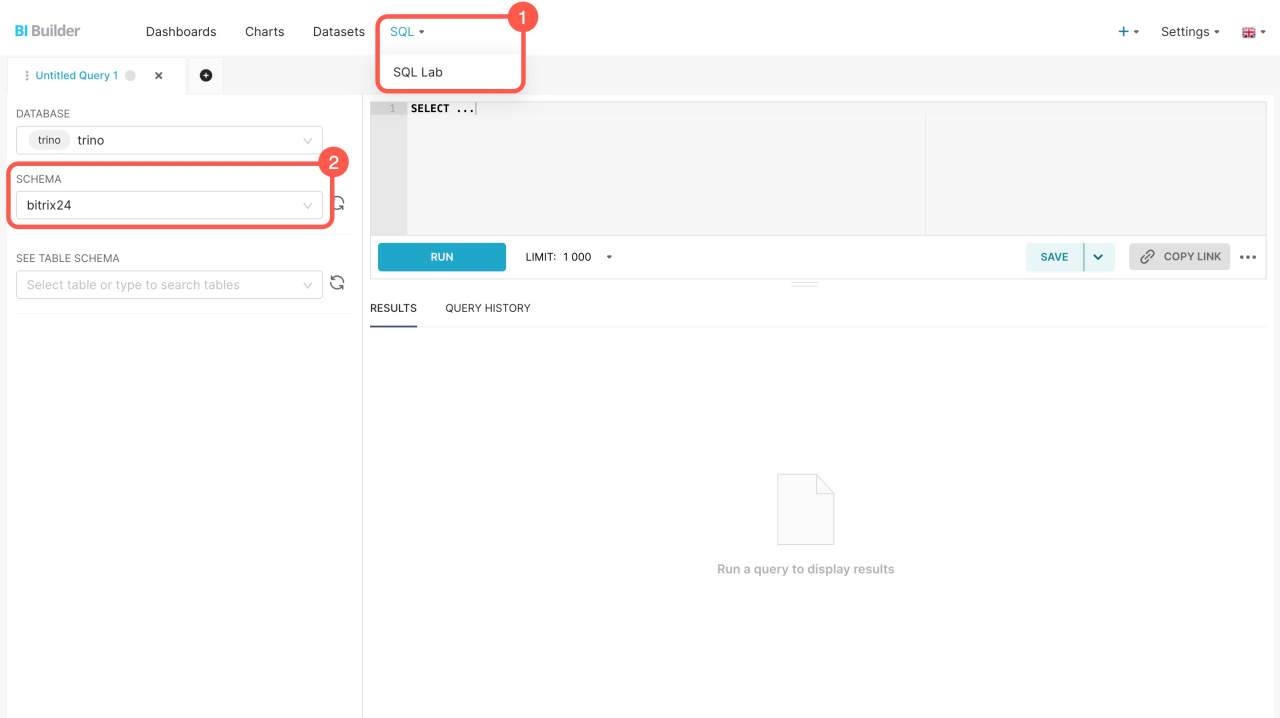
- Go to BI Builder > SQL > SQL Lab.
- Select the bitrix24 schema.
- Enter the SQL query and click Run.
The new set includes information from the fields that you specified in the SQL query. You can save it as a dataset to create a chart for the dashboard.
Create a chart based on a virtual dataset
If you're blending datasets for the first time, refer to this sample query.
Example of an SQL query
Here's an SQL query to extract data from two datasets: ad data sources (tracking_source) and ad cost statistics (tracking_source_expenses). This query combines data from these datasets using the source ID and selects information only for ad campaigns with IDs 19644720474 and 13541843024. You can copy it and see how it works. Just replace the campaign IDs before running the query.
SELECT tracking_source.ID AS "Source ID", tracking_source.NAME AS "Source name", tracking_source_expenses.CAMPAIGN_ID AS "Campaign ID", tracking_source_expenses.CAMPAIGN_NAME AS "Campaign name", tracking_source_expenses.DATE AS "Date", tracking_source_expenses.EXPENSES AS "Expenses", tracking_source_expenses.CLICKS AS "Number of clicks", tracking_source_expenses.CPC AS "Cost per click" FROM tracking_source INNER JOIN tracking_source_expenses ON tracking_source.ID = tracking_source_expenses.SOURCE_ID WHERE tracking_source_expenses.CAMPAIGN_ID IN ('19644720474', '13541843024');
SELECT: Chooses which data to extract. For example, tracking_source.ID AS "Source ID" selects the source ID from the tracking_source dataset, names it Source ID, and displays the result in a separate column.
FROM: Specifies the main table for the query, such as the tracking_source table with a list of ad sources.
INNER JOIN: Connects datasets and bends their information. The query tracking_source_expenses ON tracking_source.ID = tracking_source_expenses.SOURCE_ID combines ad source data with their expenses.
WHERE: Filters results to include data only from specific ad campaigns.
In brief
-
Now you can connect Facebook and Google Ads in BI Builder. This allows you to analyze account information and assess your advertising investments.
-
The information from ad accounts is automatically gathered into datasets: ad data sources (tracking_source) and ad cost statistics (tracking_source_expenses).
-
Add information from the dataset to charts to keep track of advertising expenses. For example, assess which ads get more traffic.
-
Combine datasets to add information about advertising sources and expenses to the dashboard. To do so, write an SQL query, save the result as a dataset, and create a chart.
Read also:

