Every business owner knows it's crucial to stay focused to keep things running smoothly. Analyzing sales funnels, employee performance, and sales trends is essential.
In Bitrix24, you can find all this information through CRM Analytics.
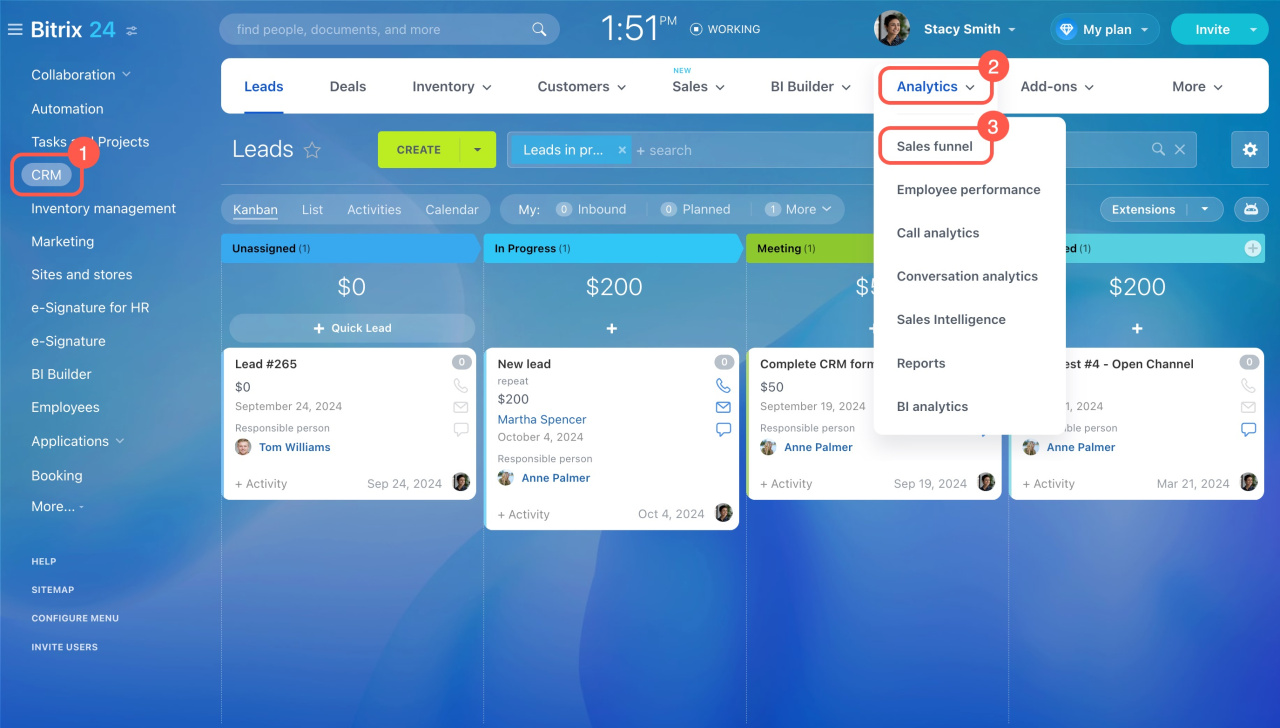
Go to the CRM > Analytics > Real time analytics > Sales funnels.
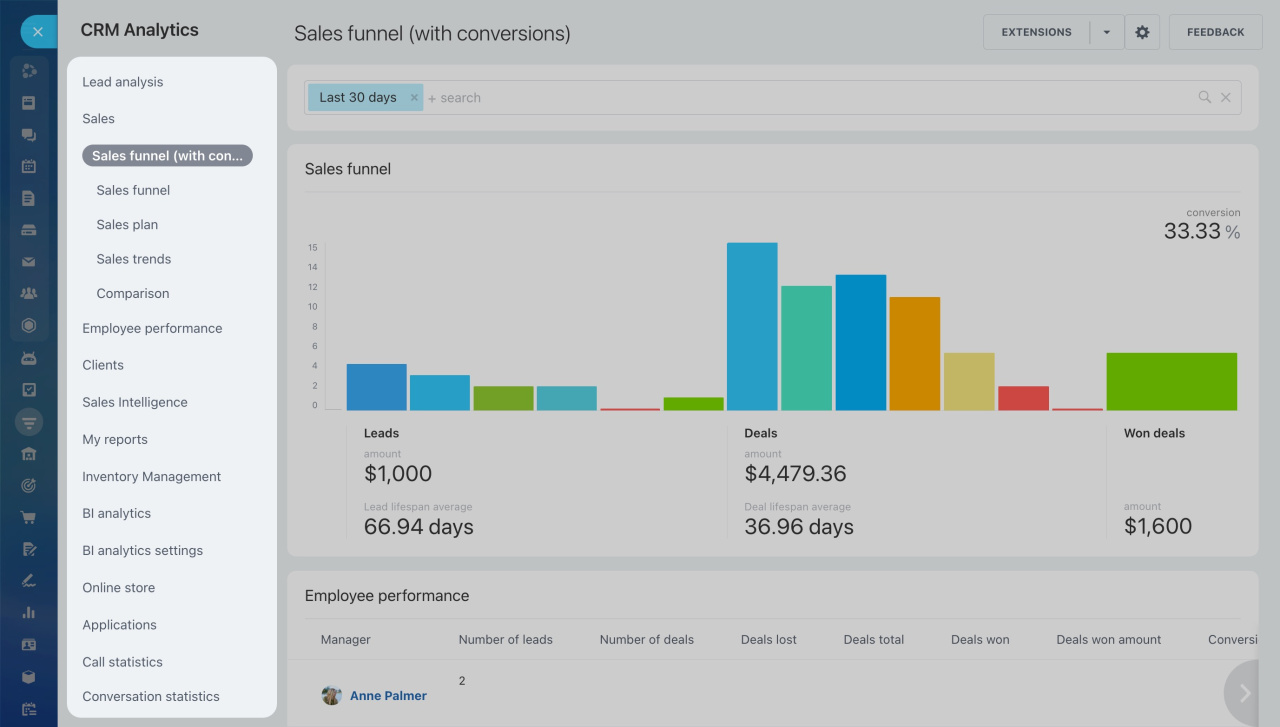
All available analytics reports are organized into different sections in the left navigation menu.
The main advantage of CRM Analytics reports is the ability to filter data by any field, including custom ones. For example, you can create a report for deals with delivered products.
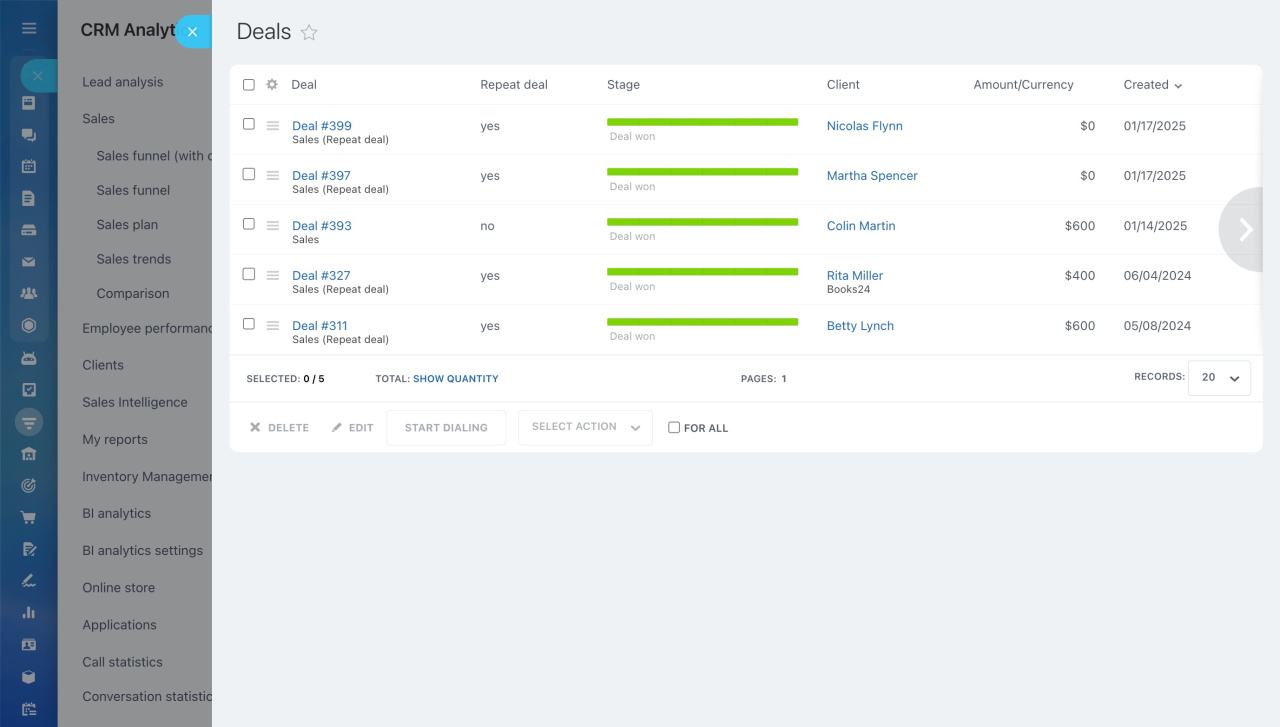
You can also click on any value, like the number of won deals, and Bitrix24 will display a list of those deals.
See the detailed description of the available reports in each section below.
Lead analysis
Choose a CRM mode
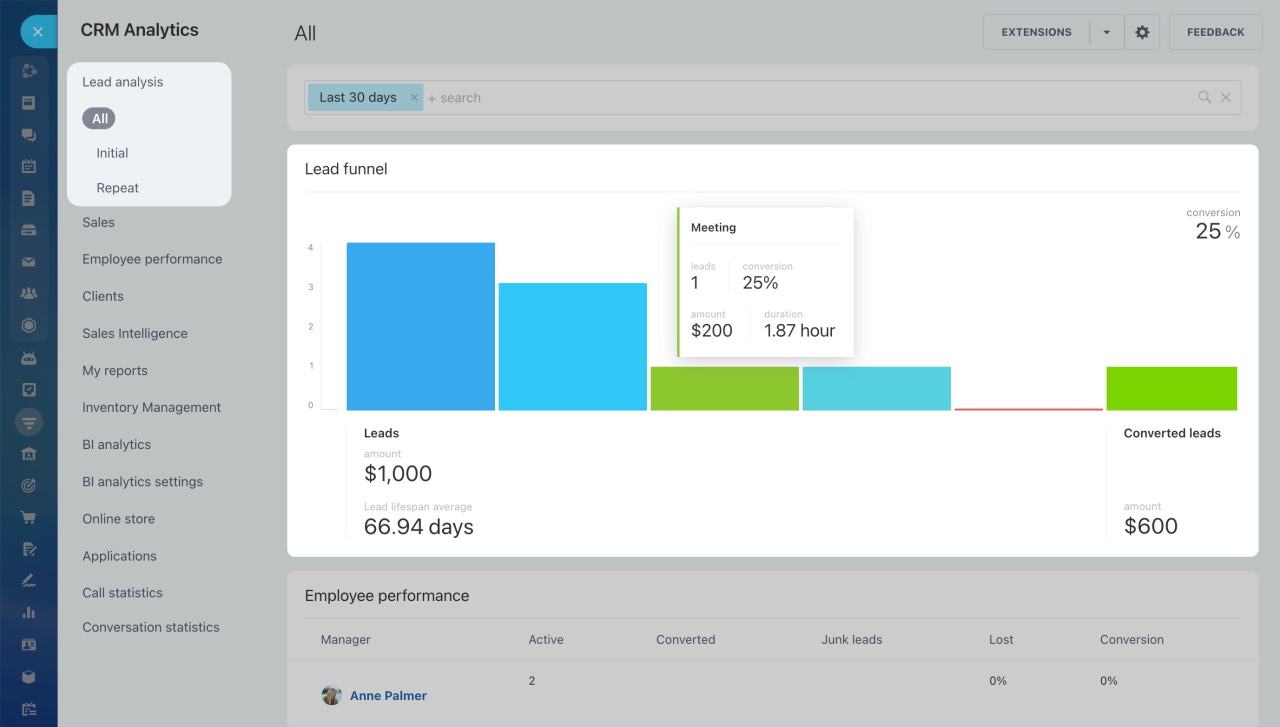
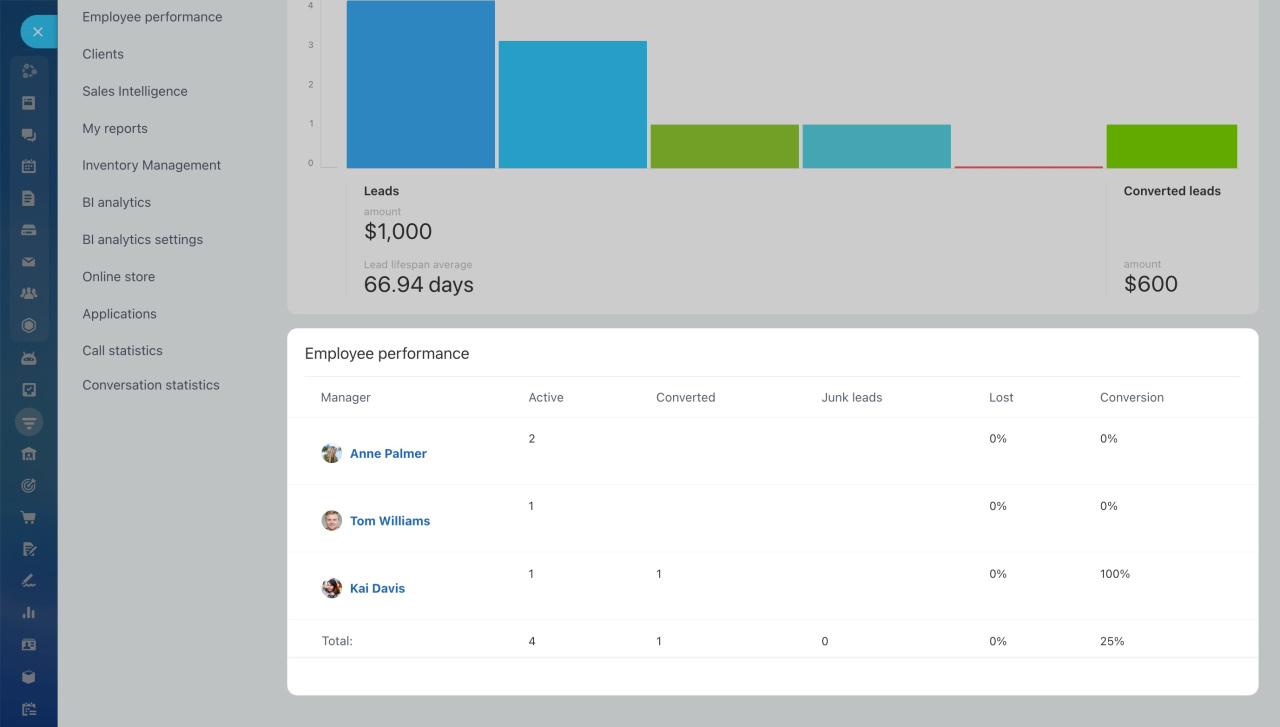
Click All to track how leads move from one stage to another and assess employee performance. The All report includes all leads, both initial and repeat. You can view separate reports for initial and repeat leads by clicking the corresponding buttons.
The Lead funnel the number of leads passing through each stage. Hover over a column to see more details, such as the number of leads, conversion rate, lead amount, and the time leads spend at each stage.
In this section, you can also find:
- Amount: Total amount of leads that have been converted.
- Lead lifespan average: Time spent from lead creation to conversion.
- Conversion: Percentage of leads successfully converted.
The Employee performance table below displays how many active, converted and junk leads each employee has and the percentage of lost and converted leads.
Sales
In the Sales section, you can view reports that help you track the sales process, starting from the lead creation and finishing with the Deal won stage.
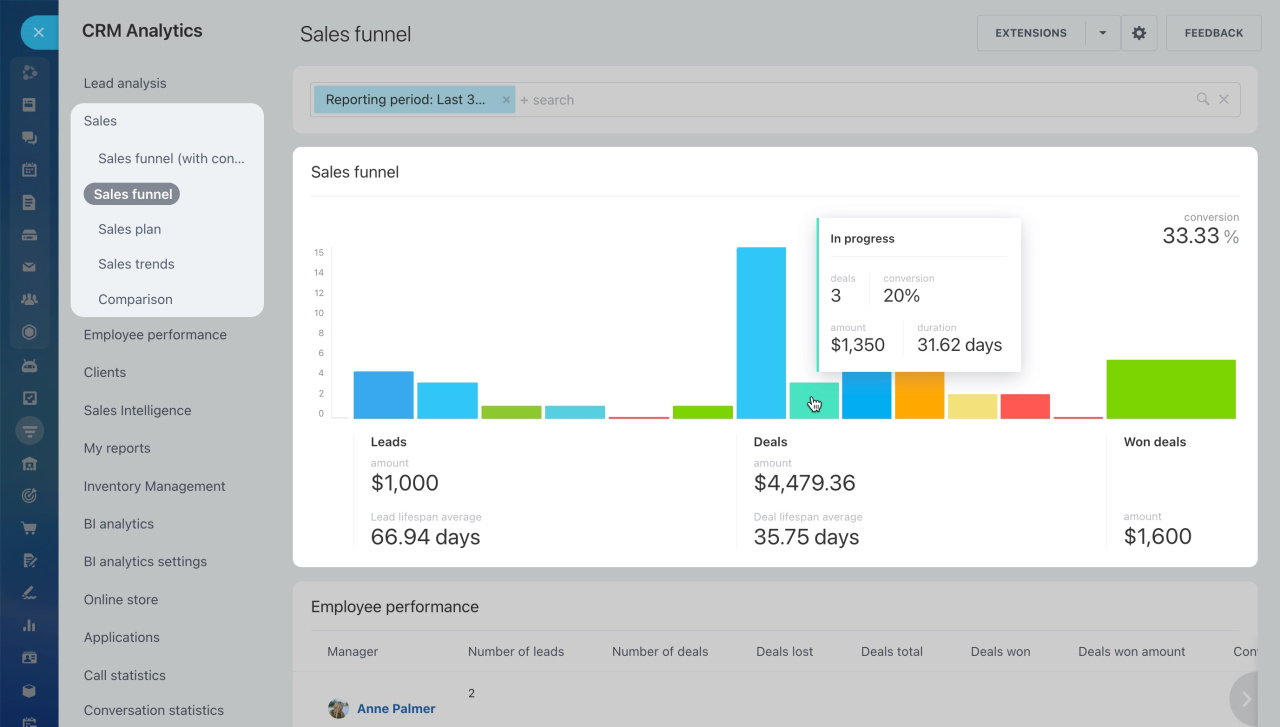
The Sales funnel report combines both lead and deal funnels. You have two funnel types to choose from: classic and conversion.
Difference between classic and conversion sales funnels
Hover over a column to view additional information, like the number of deals, conversion rate, deals amount, and the time deals spend at each stage.
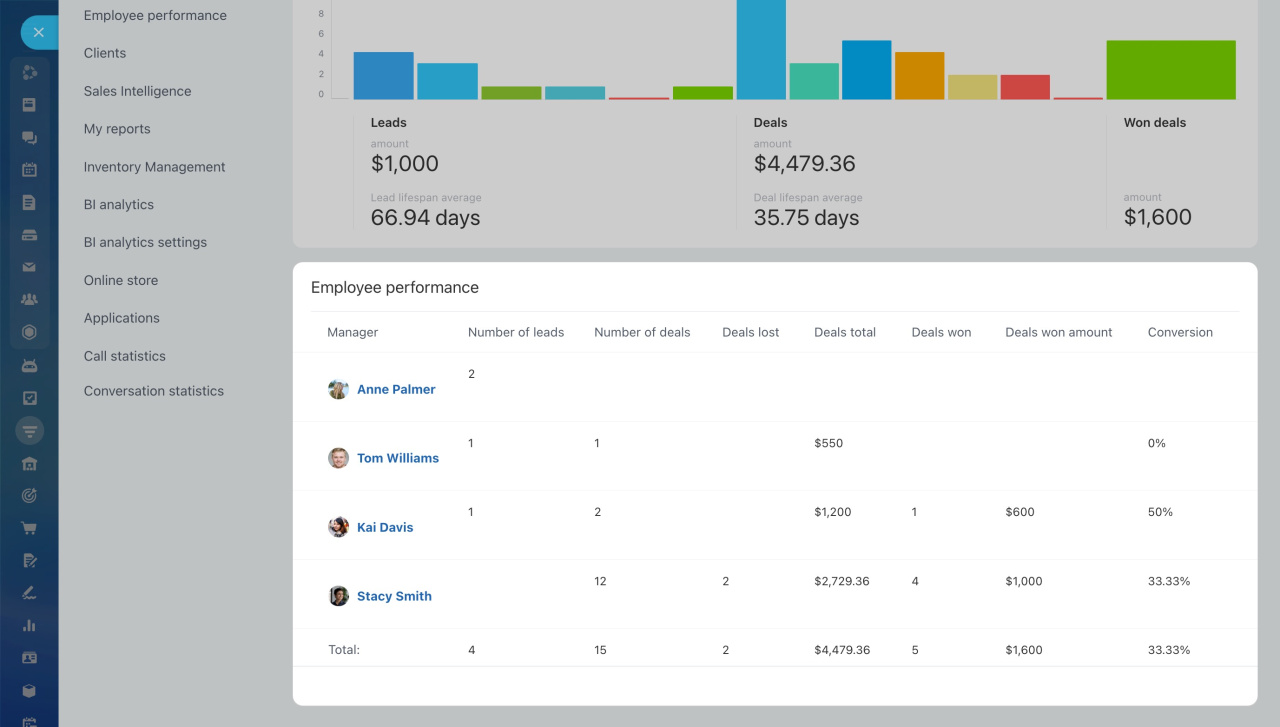
Scroll down to the Employee performance table to assess how well your team handles leads and deals.
The Sales plan helps you plan money flows into the company and control employees' productivity.
Sales plan
The Sales trends report shows how deal amounts change during the reporting period. It also helps to compare amounts of repeat and initial deals.
Sales trends
The Comparison report allows you to compare the total deal amounts between two reporting periods. For instance, if you've run a 1-month marketing campaign and want to compare total deal amounts before and after the campaign:
- Open the Comparison report.
- Select Month as the reporting period.
- Specify the month and year.
- Bitrix24 will generate a report showing results for the selected month and the previous month.
CRM Analytics limits
Employee performance
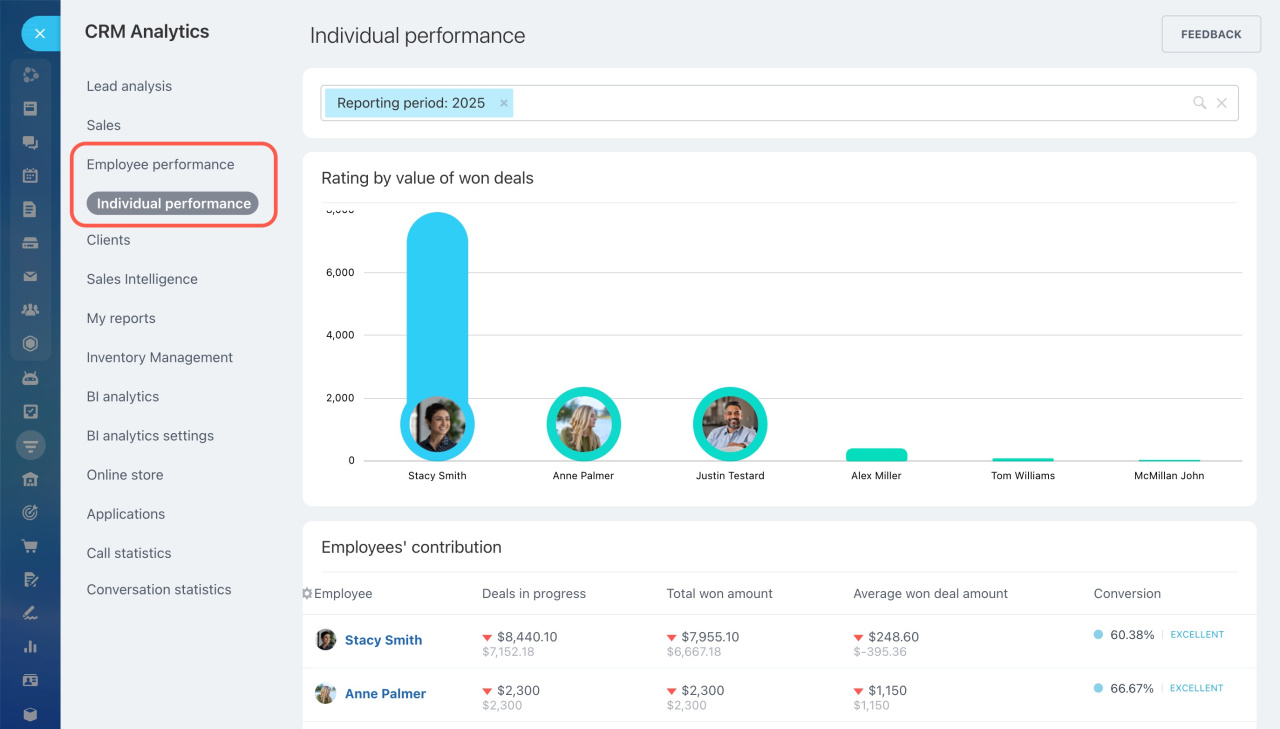
Only the Individual performance report is available in this section. It helps you rank the sales agents by the amount of won deals. Use the information from this report to evaluate the work results of each manager.
Individual performance report in CRM Analytics
Clients
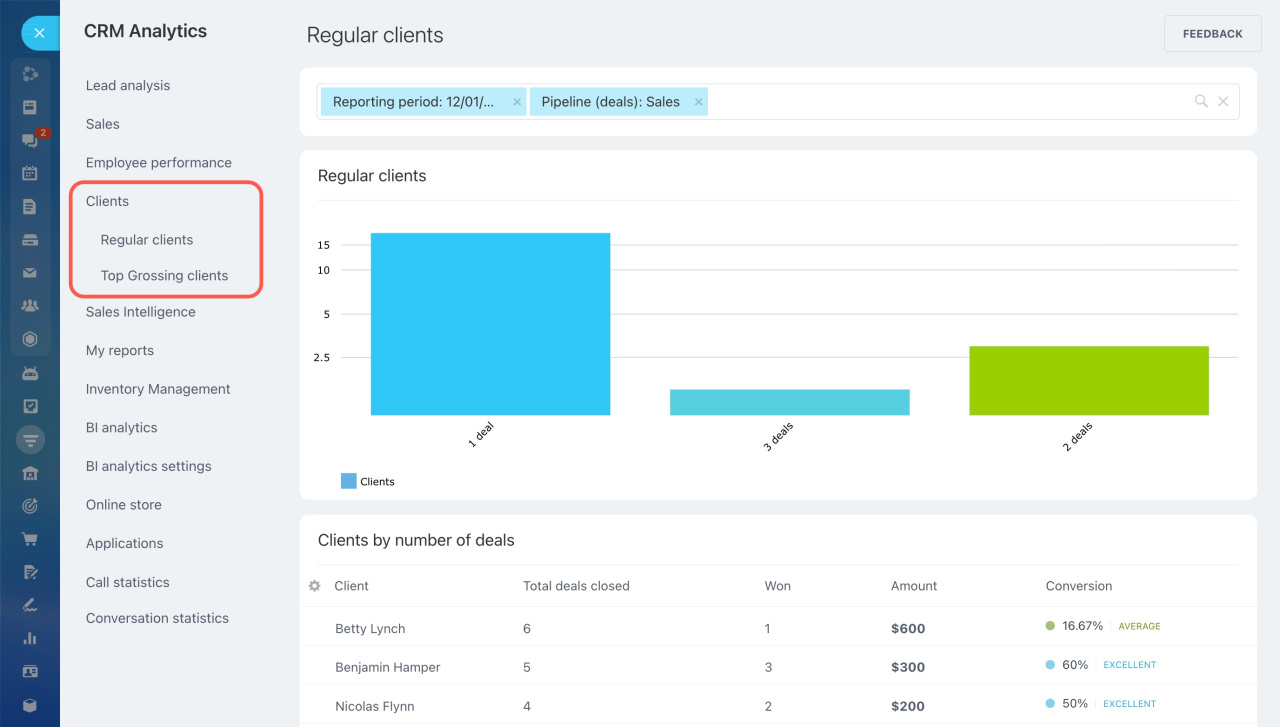
This section includes two reports: Regular clients and Top Grossing clients.
The Regular clients report shows how many clients have purchased something from you within the selected reporting period.
Regular clients
The Top Grossing clients report shows clients with the highest total amount of won deals. The data from this report may be useful, for example, when creating a loyalty program or making personal discounts.
Top Grossing clients
Sales Intelligence
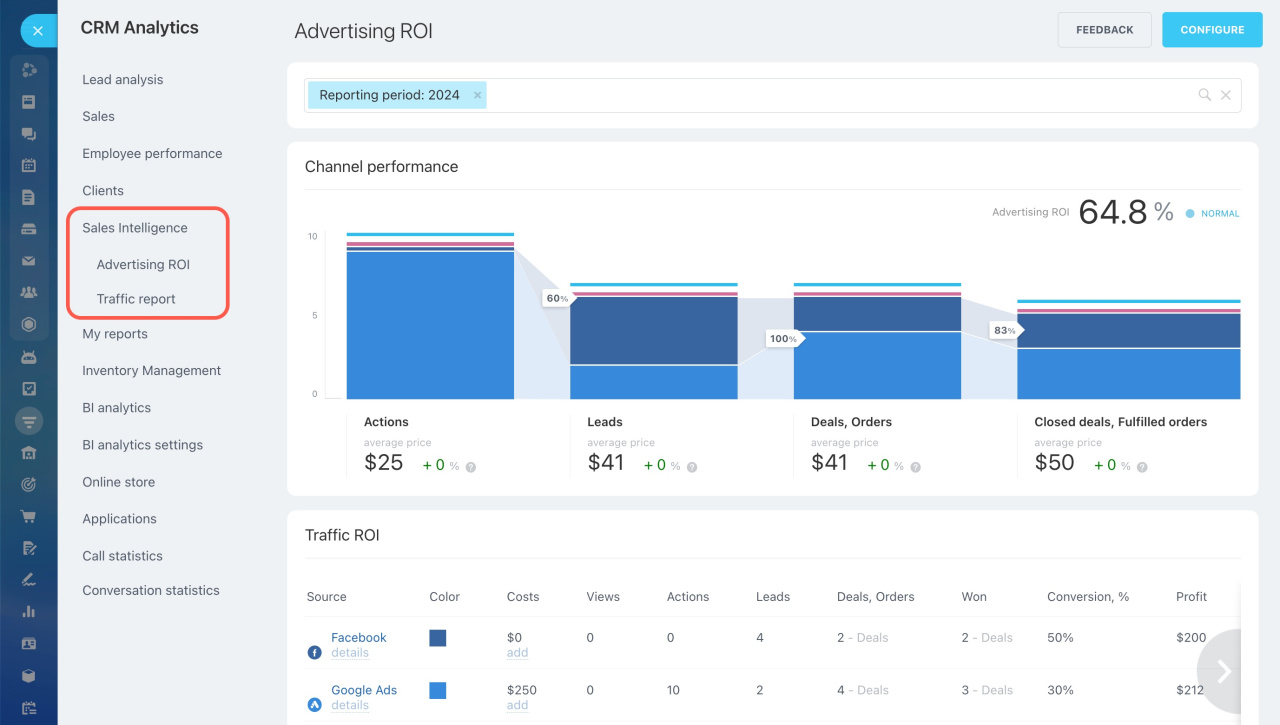
Sales Intelligence helps you find out which marketing channel gives you the best return on your investment.
The Advertising ROI report shows how effective each traffic source is, and the Traffic report shows how well managers are working with each source.
Sales Intelligence analytical reports
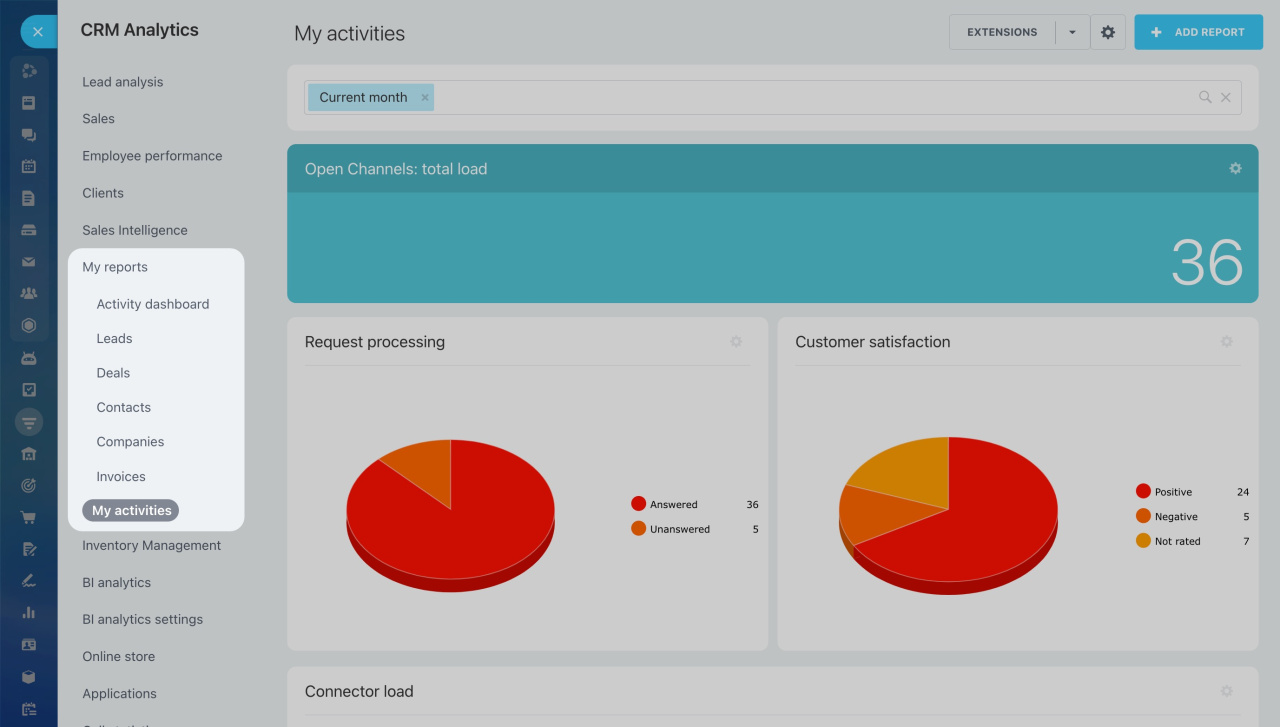
My reports
Reports on different CRM items are available in the My reports section. Select a desired CRM item to see the corresponding report.
Learn more about each report in these articles:
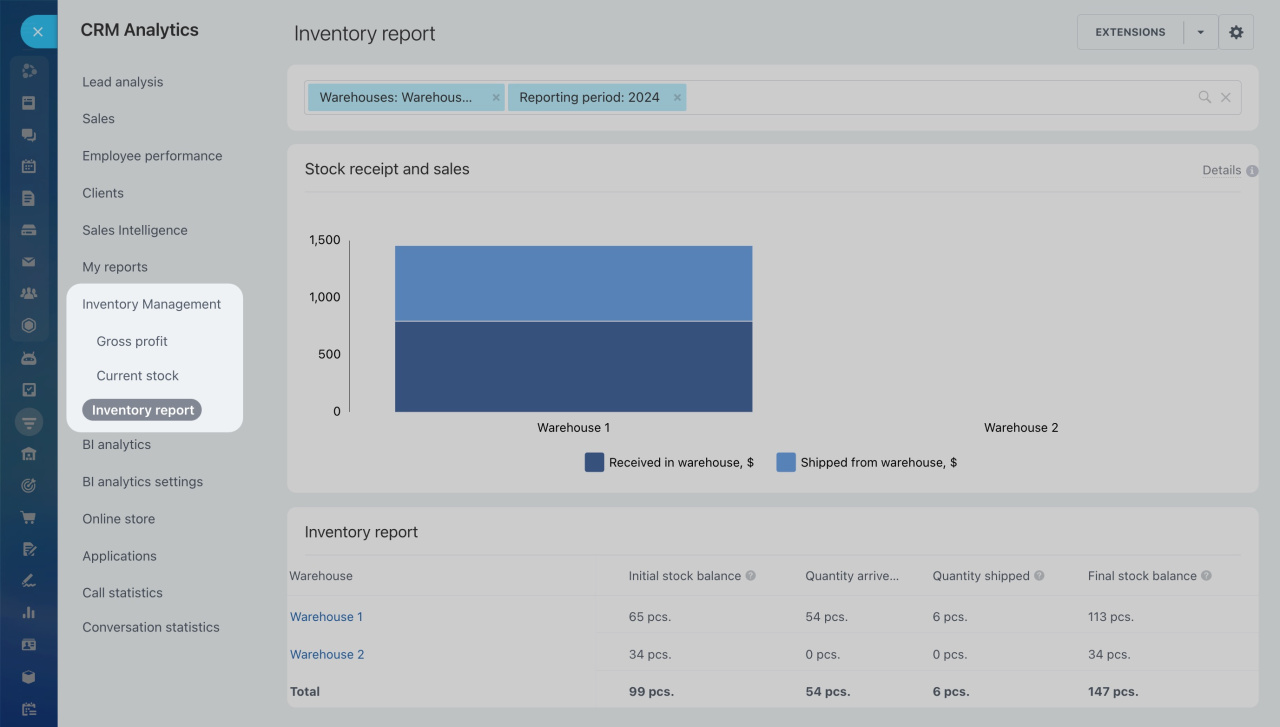
Inventory Management
In this section, you can find the following reports:
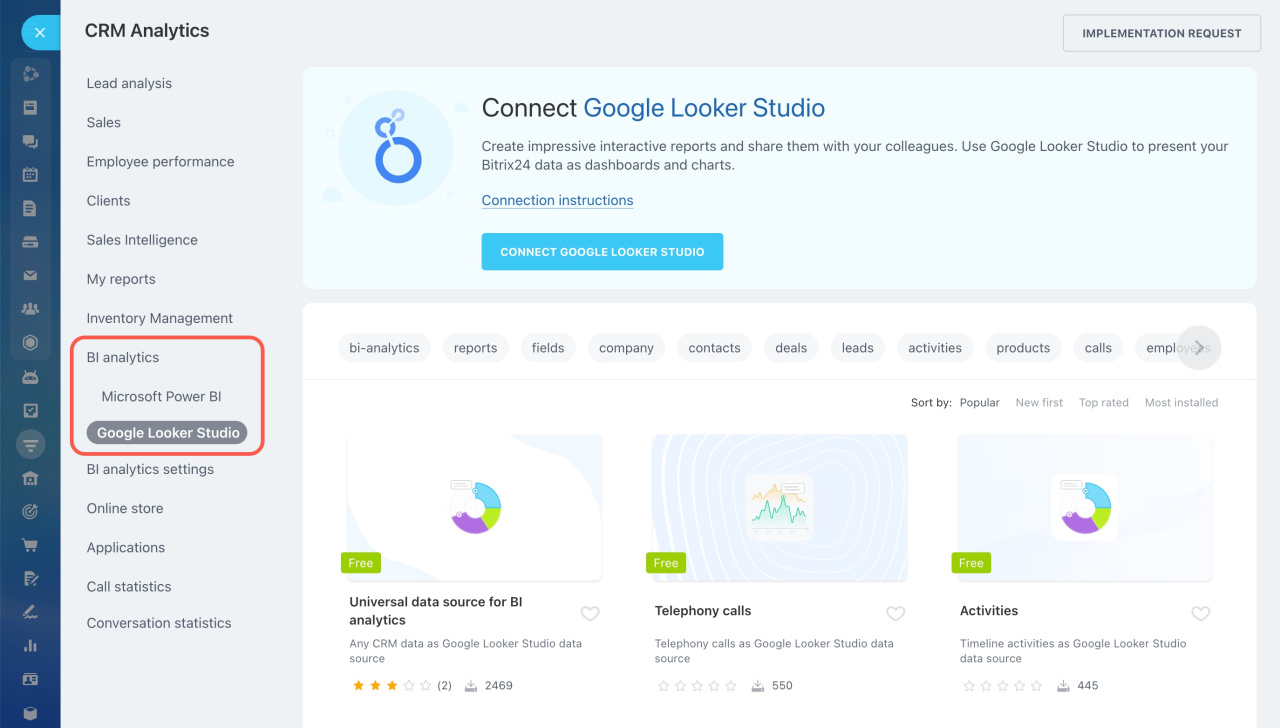
BI analytics
Bitrix24 BI analytics is a powerful tool for analyzing data collected in Bitrix24. It allows you to connect with Google Looker Studio or Microsoft Power BI to create complex reports and track key indicators.
Connect Google Looker Studio
Connect Microsoft Power BI
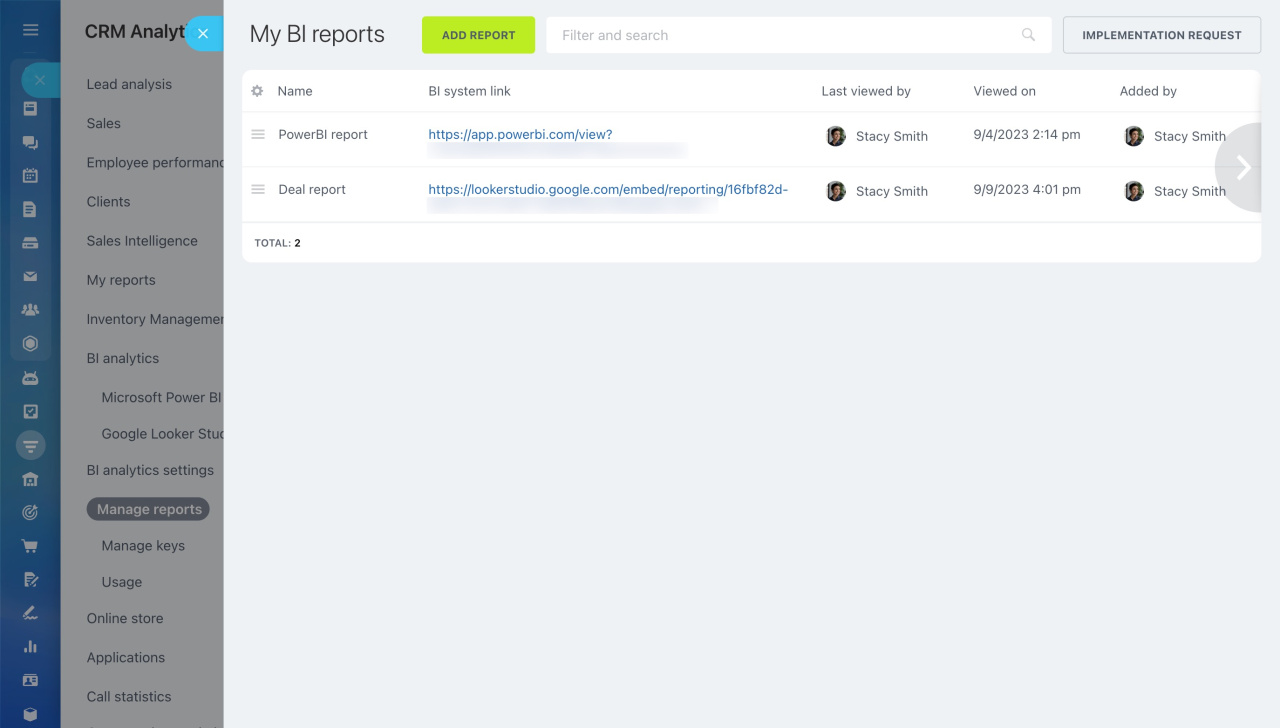
BI analytics settings
BI analytics settings allow you to add new reports to your Bitrix24, configure access to them, manage keys, and monitor the statistics of bi-connector usage.
BI Analytics Settings
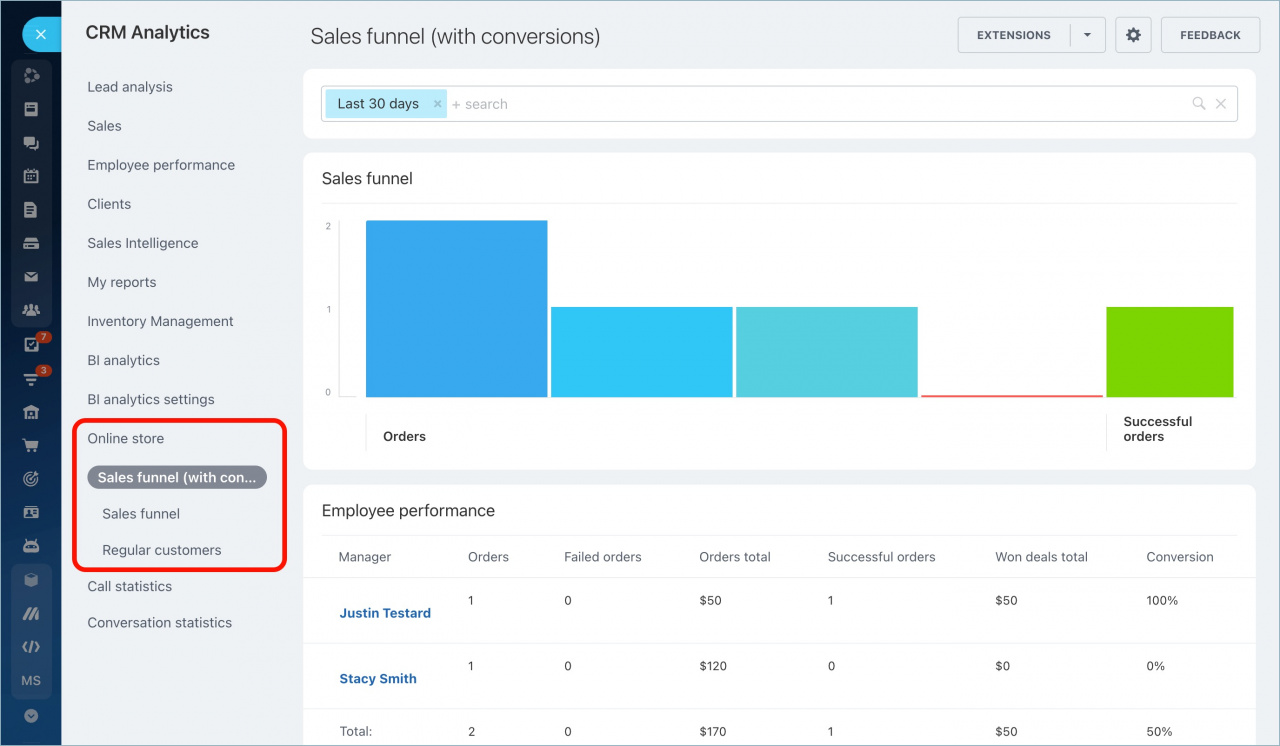
Online store
Here you can find the reports for the online store orders created within the deals.
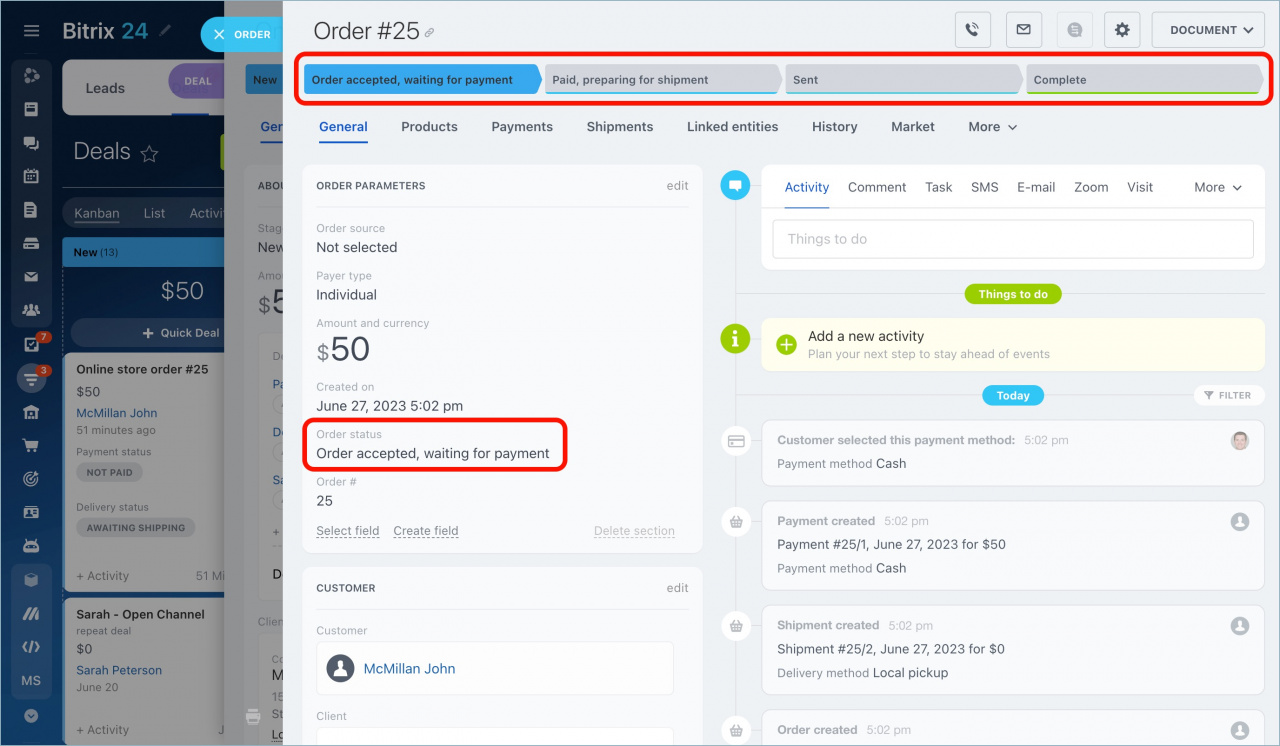
These reports take into account only the switch between the order statuses.
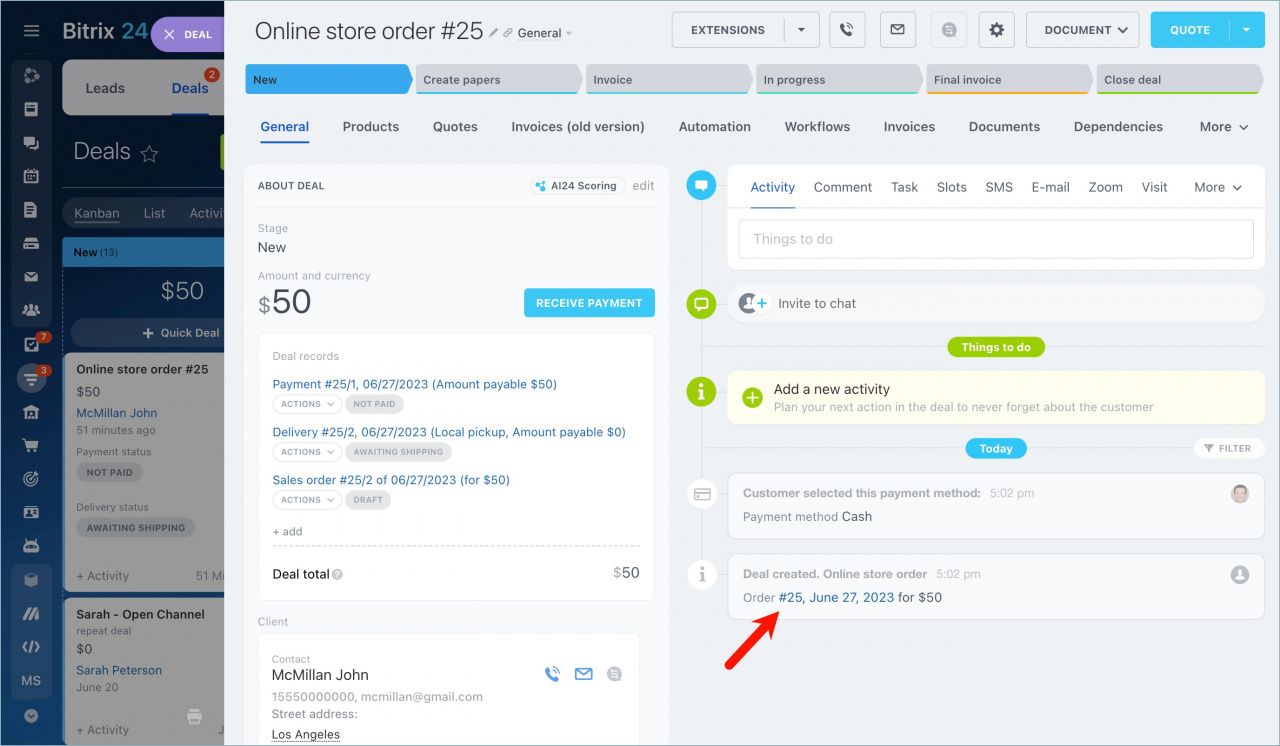
If you switch to Without orders mode, you can still access an order from the deal timeline.
Work in Store without orders
Call statistics
The Call statistics section allows you to analyze all calls in Bitrix24. You can generate reports on the total number of calls and monitor your employees' performance.
Call statistics covers all calls, whether made through Bitrix24 built-in telephony or via REST and SIP integrations.
Call statistics
Conversation statistics
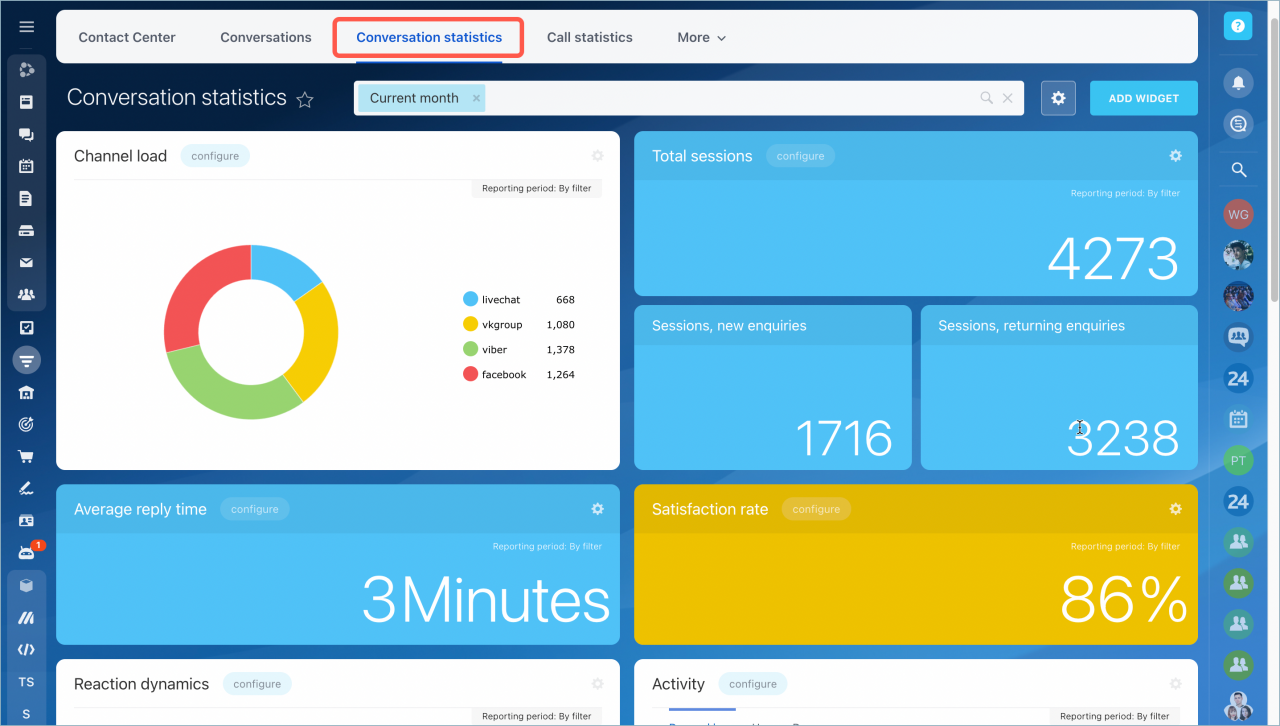
Chat statistics will help you assess the most popular open channel by evaluating employee effectiveness, average response time, satisfaction rate, and more.
To access this, select Conversation statistics from the left menu, and a section with various widgets will open in a new tab.
Conversation statistics

