
Use deal and employee data in one report to track how many deals each sales agent creates. Set up the table to compare sales performance across your team.
Add data sources to Looker Studio
- Go to Analytics > BI analytics.
- Click Connect Google Looker Studio.
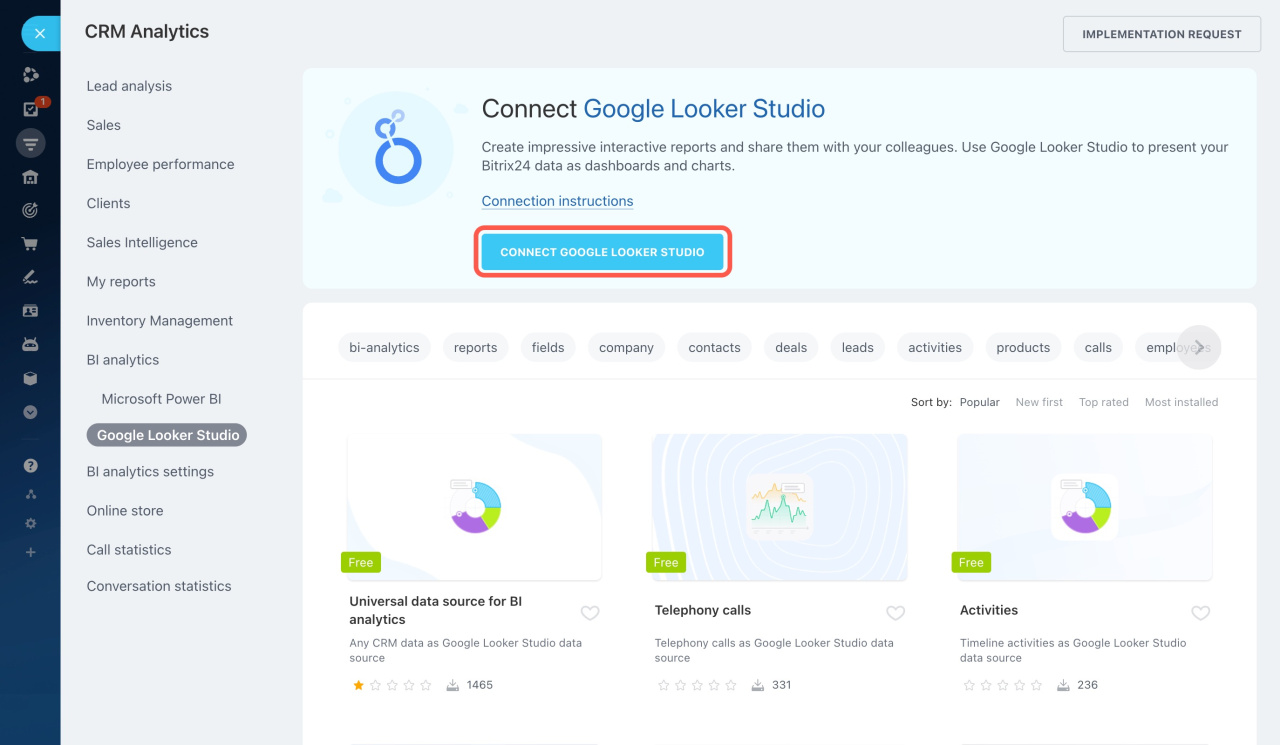
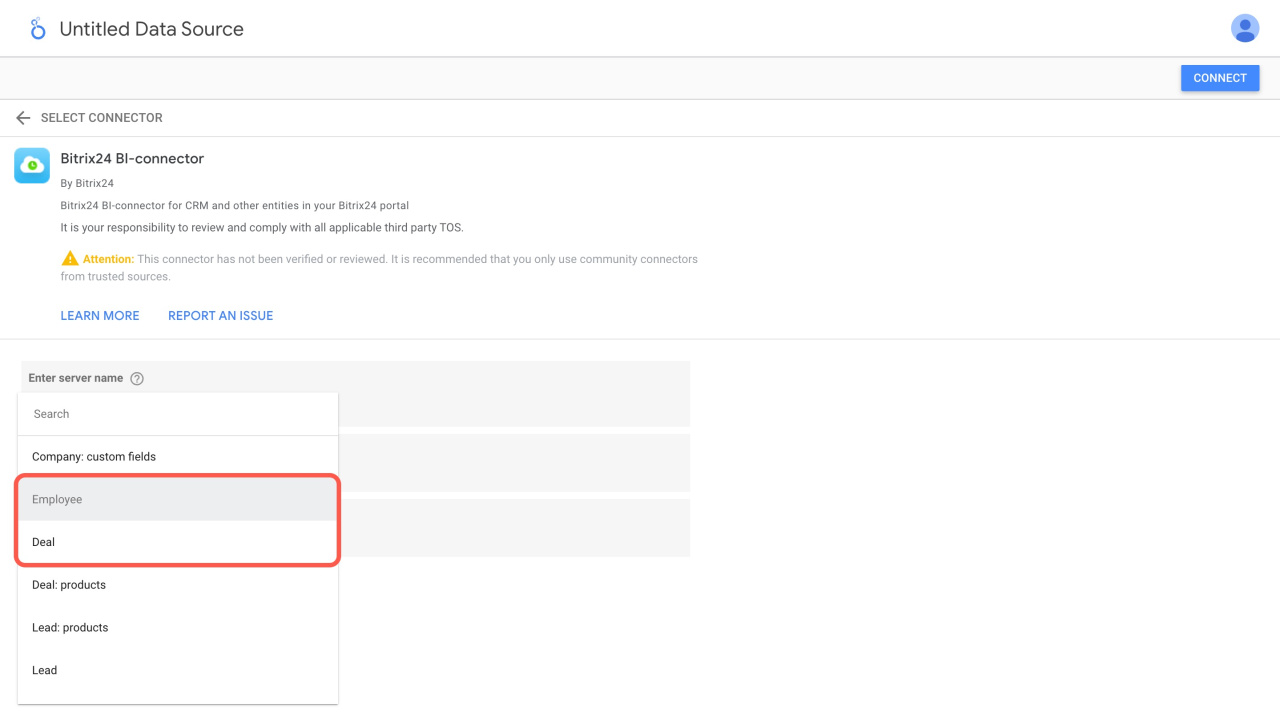
Looker Studio will open in a new tab. Add the data source tables one at a time: Deals and Employees.
Description of entity fields in BI Analytics
How to blend data sources
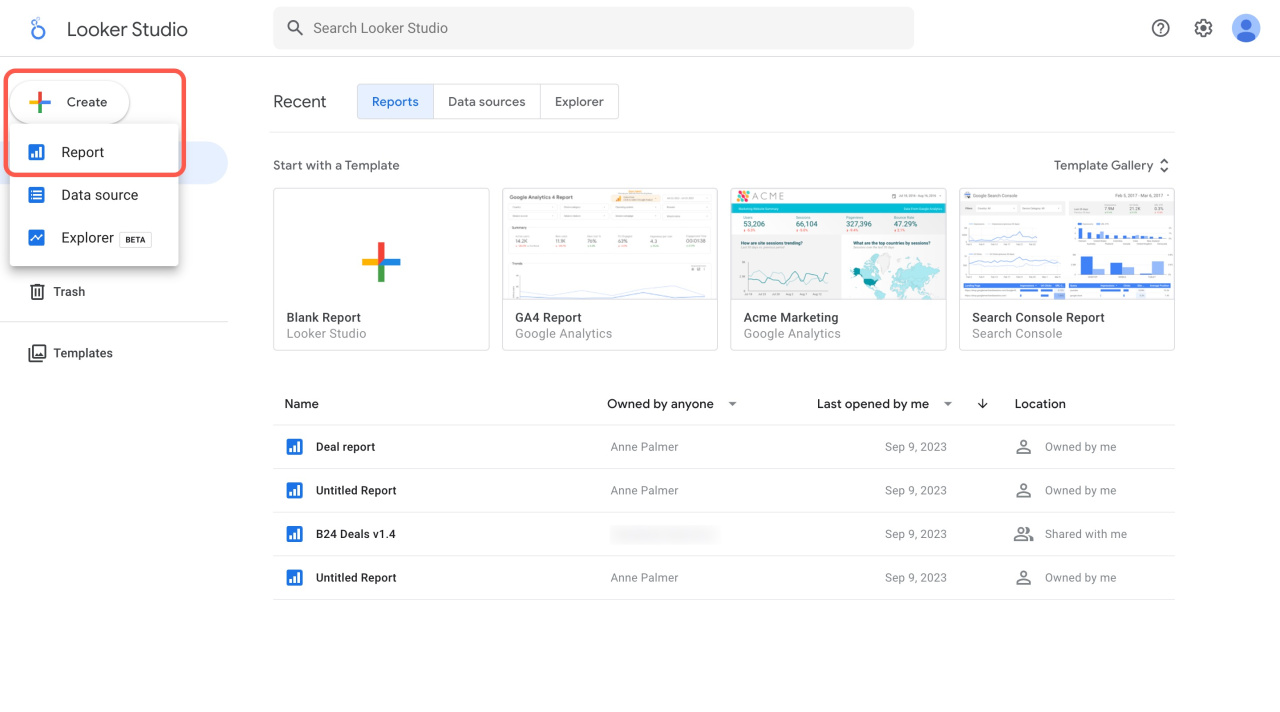
- In Looker Studio, click Create and select Report.
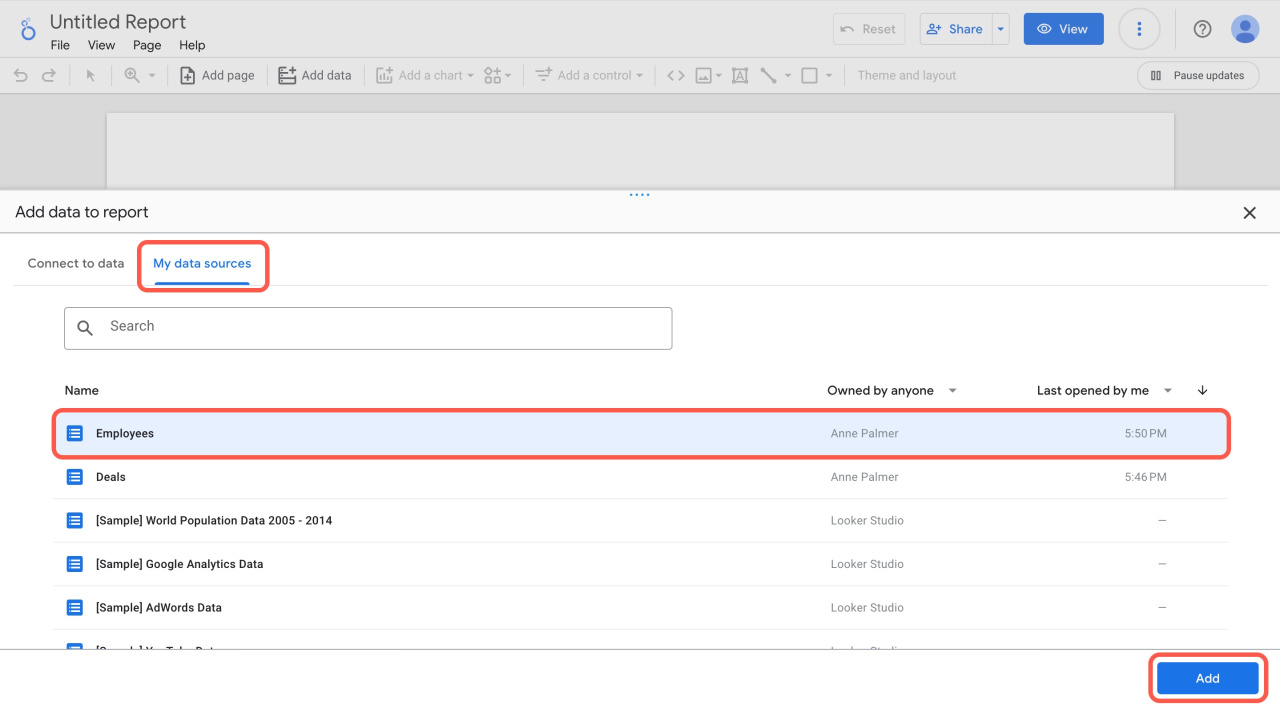
- Open the My data sources tab.
- Select a source and click Add.
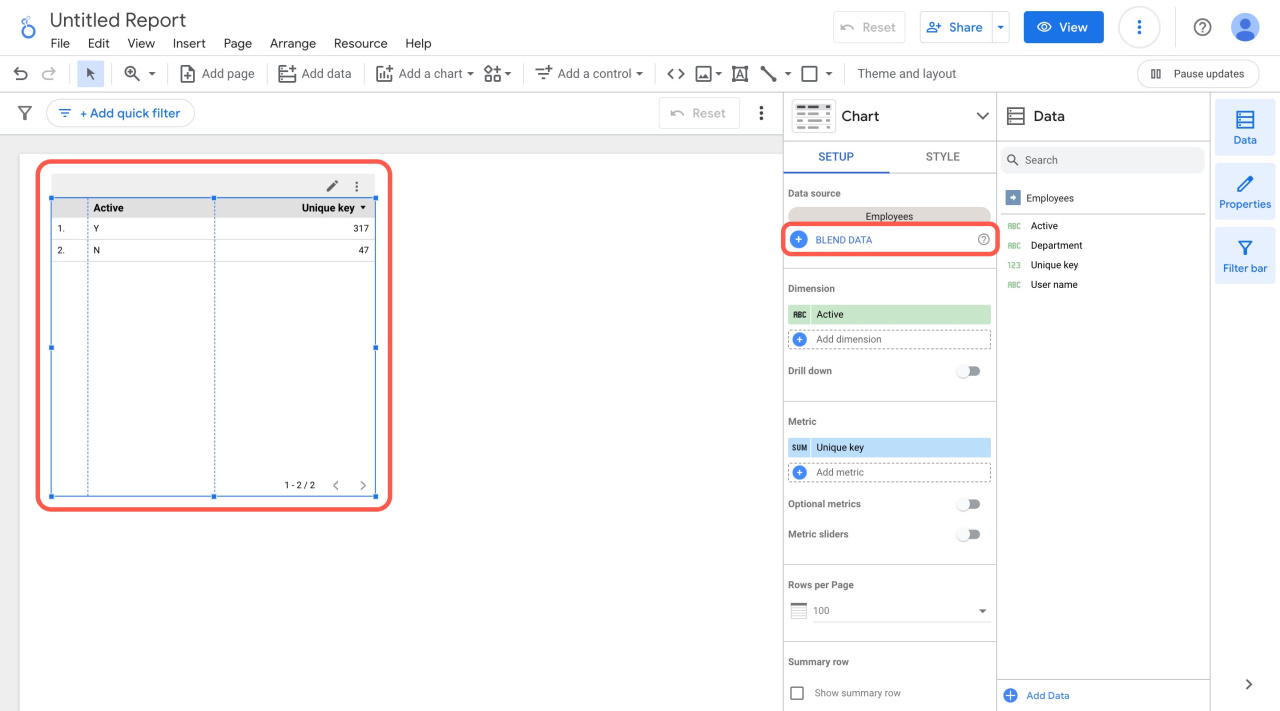
- Select the table and click Blend Data.
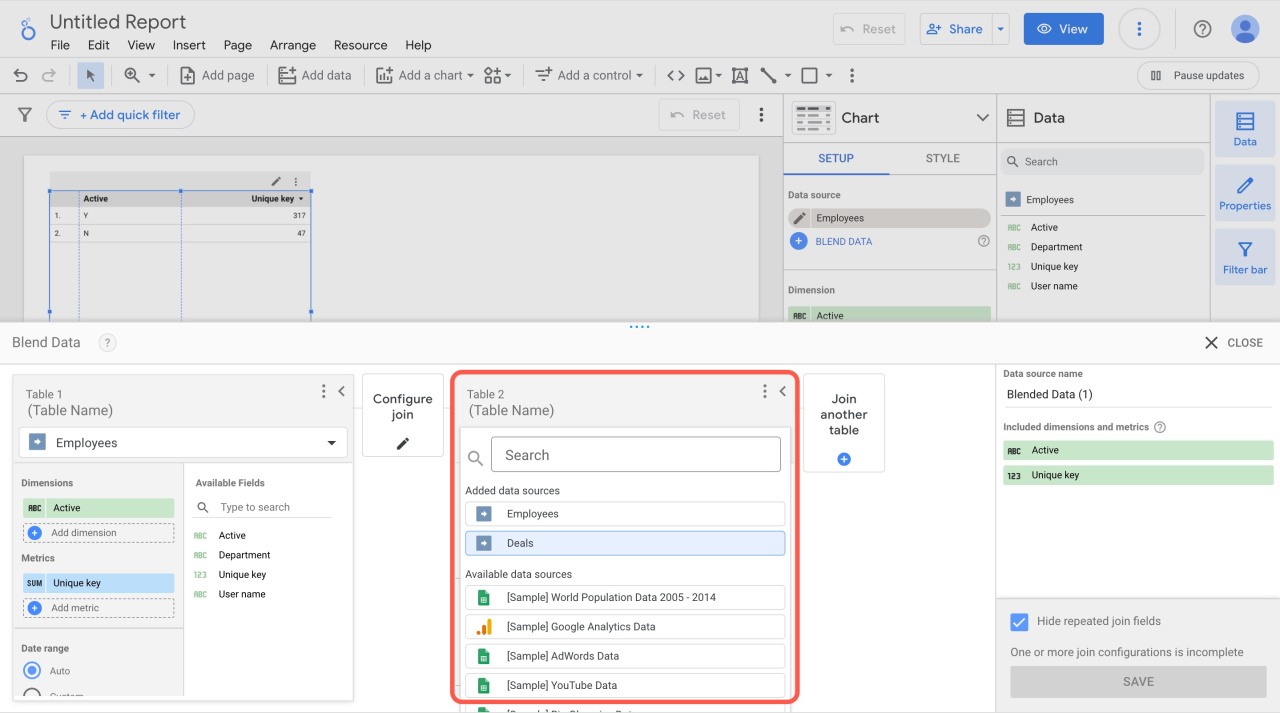
- Add another table with deal data.
Configure dimensions
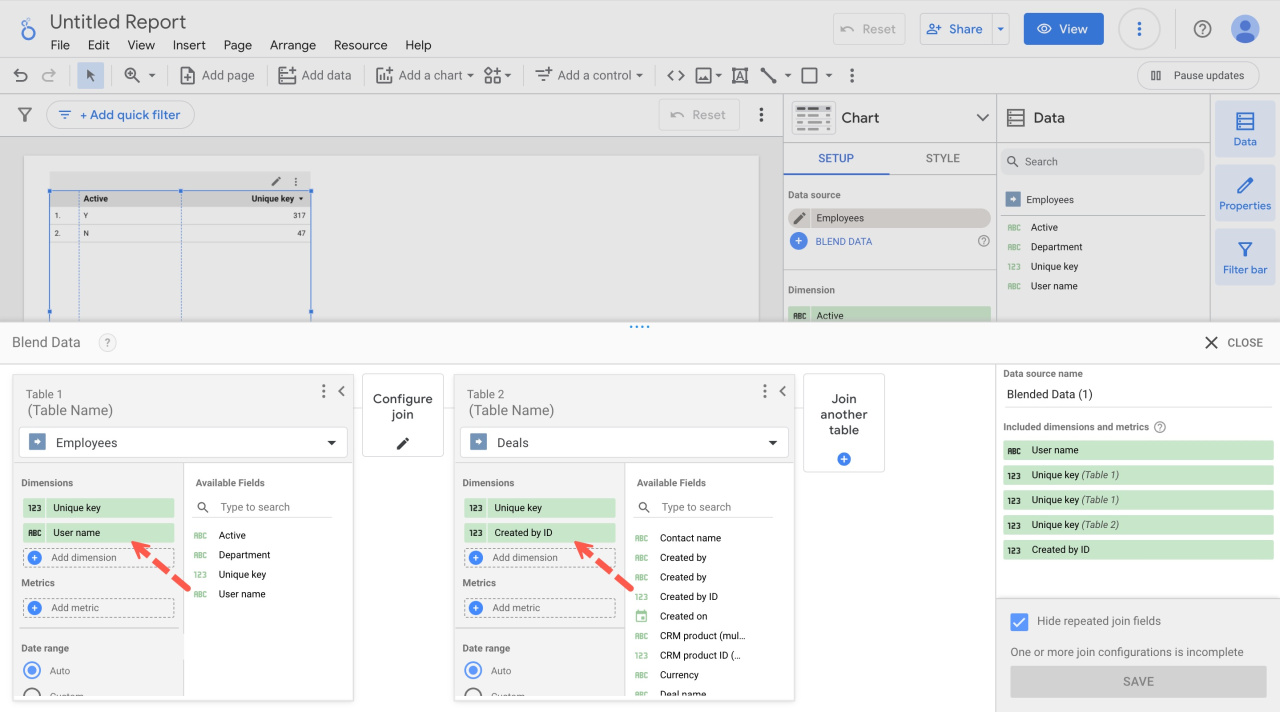
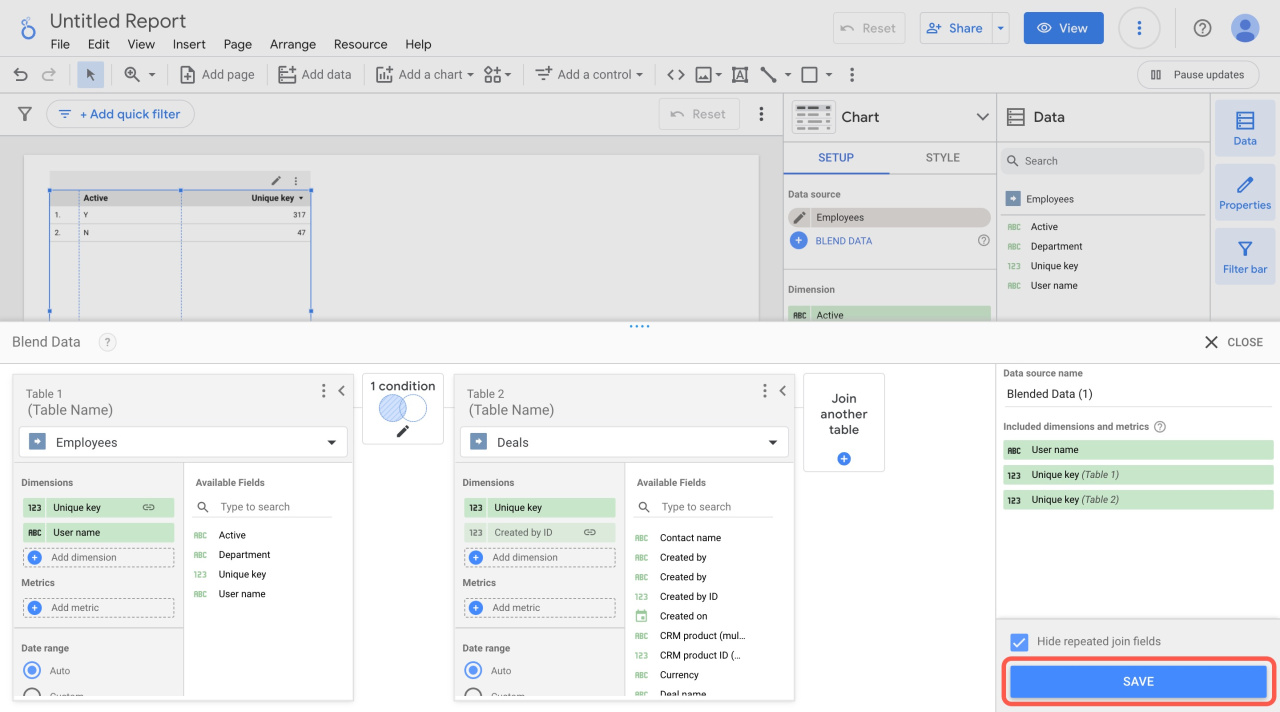
For the Employees table, add these fields:
- Unique Key
- User Name
For the Deals table, add:
- Created by ID
Configure the join
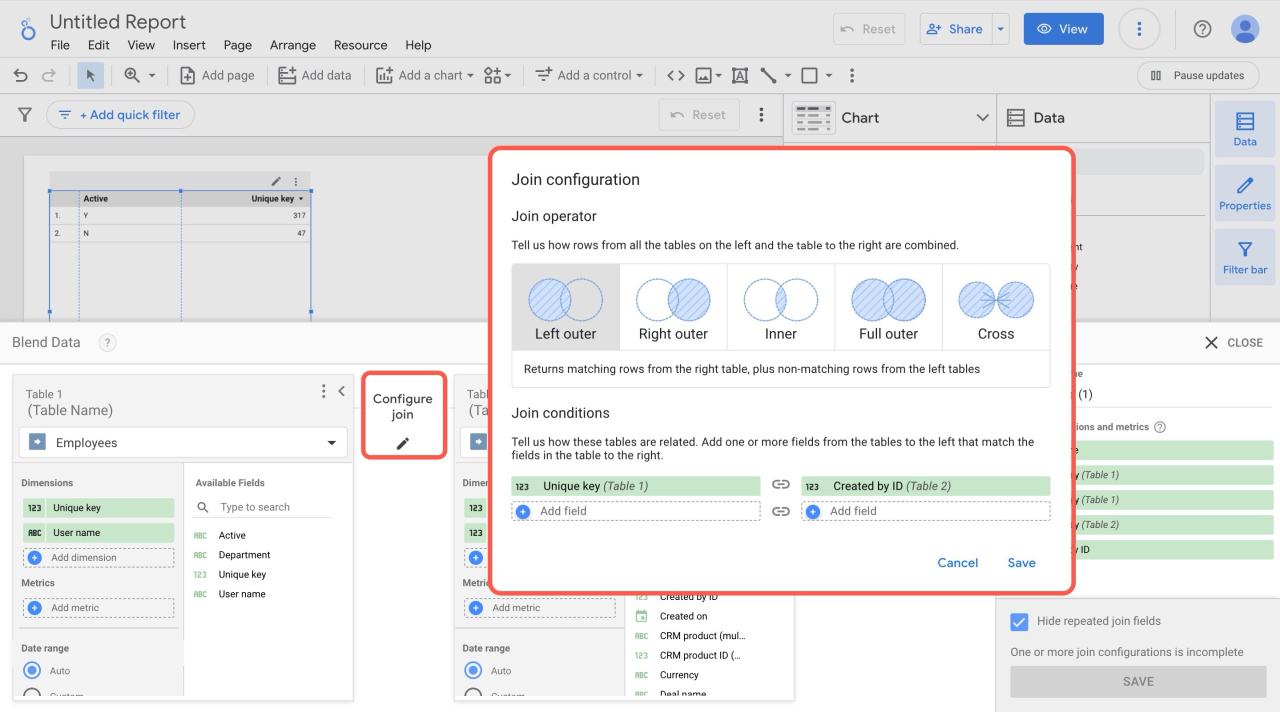
- Click Configure Join.
- Set the following parameters:
- Join operator: Select Left outer.
This join shows all employees, including employees without deals. - Join conditions: Select the fields used to match rows between tables.
In this example:- Unique key from Employees
- Created by ID from Deals
- Save the blended data.
Set up table metrics
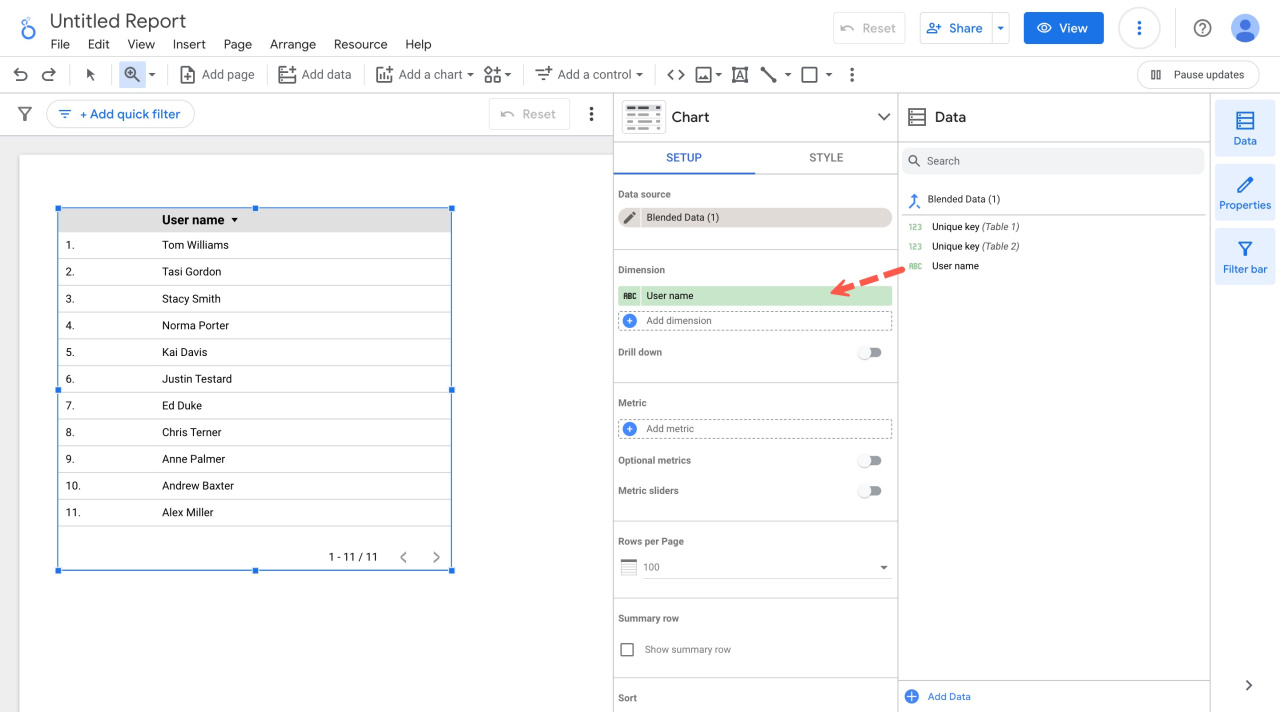
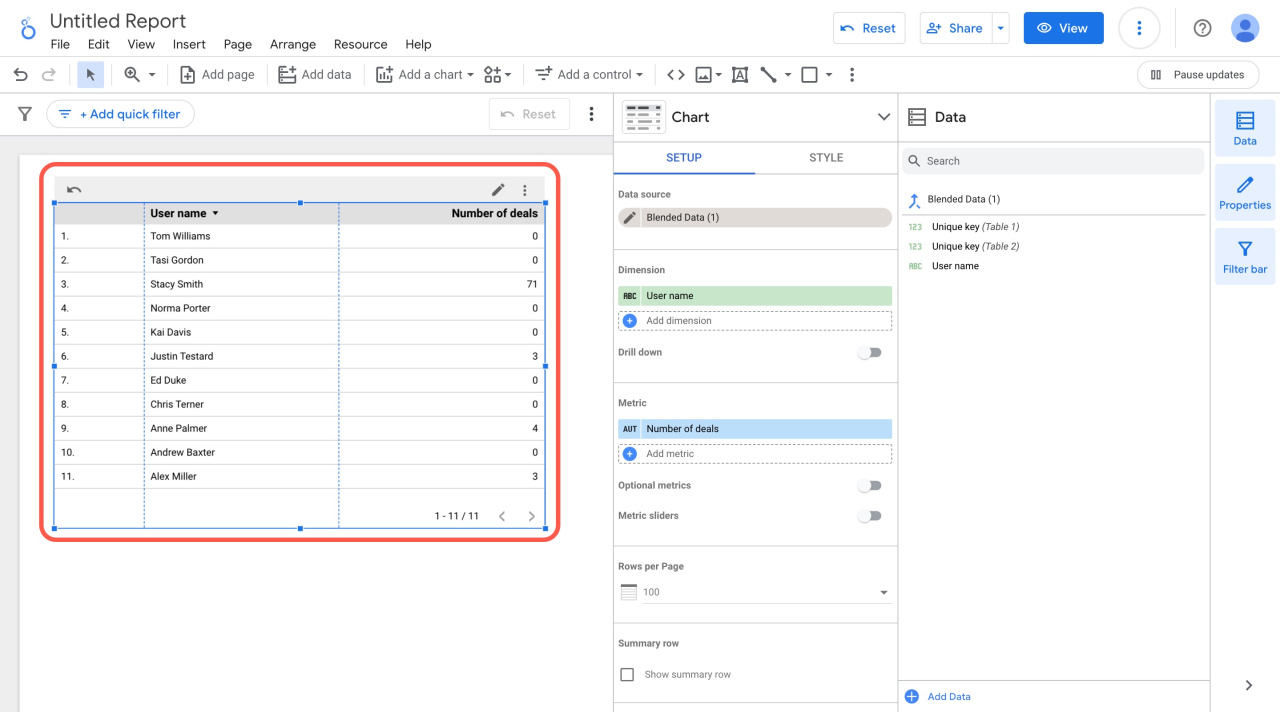
- To display employee names in the table, drag the User name field to dimensions.
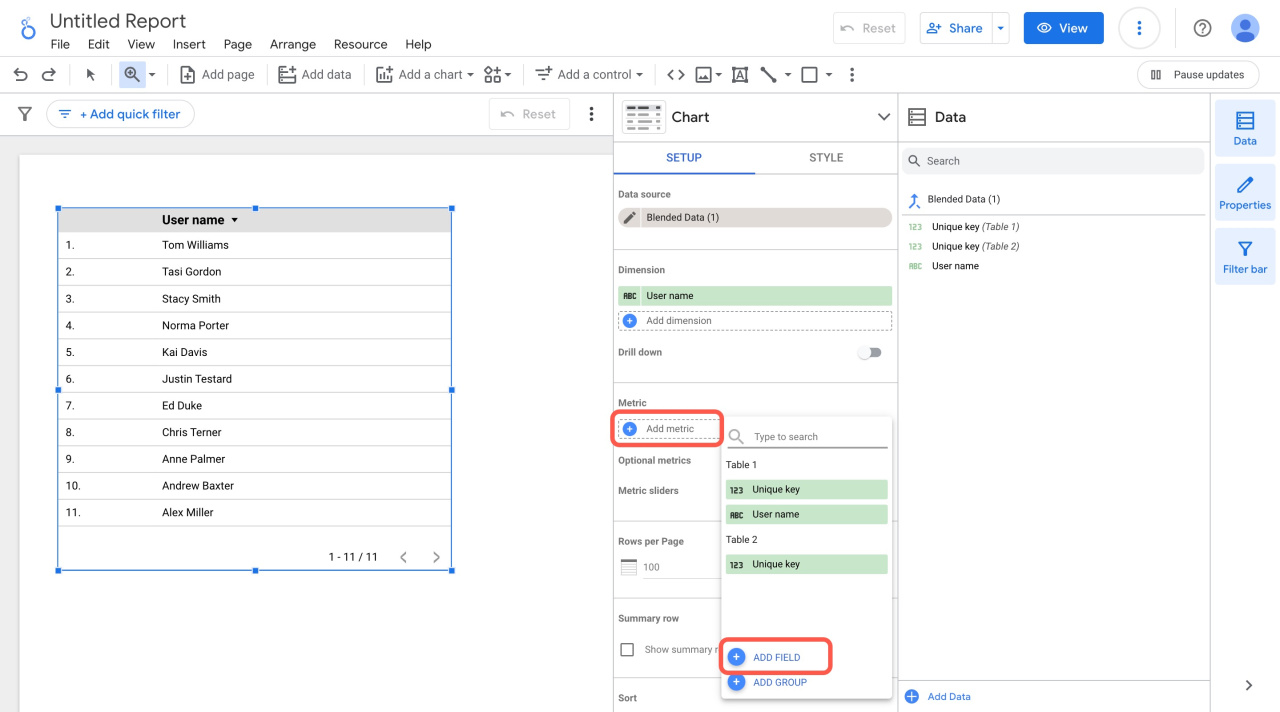
- To add a column with the number of deals:
- Click Add metric
- Select Add field
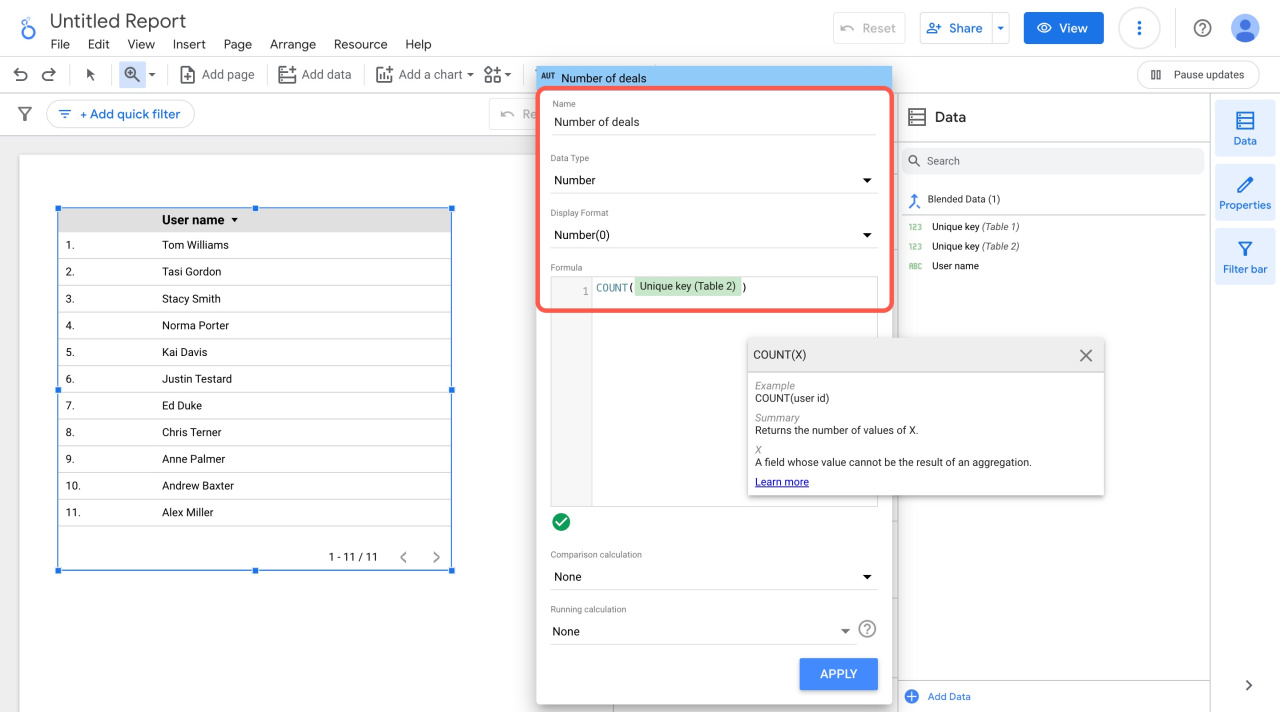
- Enter the metric name, select the data type, and add a formula.
Example formula for the total number of deals:
COUNT(Unique key (Table 2))
The table now shows how many deals each employee created. It also helps you identify employees who have not created any deals.
In brief
- Use blended deal and employee data to track the number of deals per sales agent.
- Use the Left outer join to include all employees in the report.
- Configure table metrics to compare employee sales performance.