
The OR filter in Looker Studio displays data that matches at least one condition. For example, you can use it to track leads with the Processed and In process statuses. The filter excludes new leads and displays only active and completed leads.
Create a report in Looker Studio
To create a filter, first create a report.
- Go to Analytics > BI analytics.
-
Click Connect Google Looker Studio.
Connect Google Looker Studio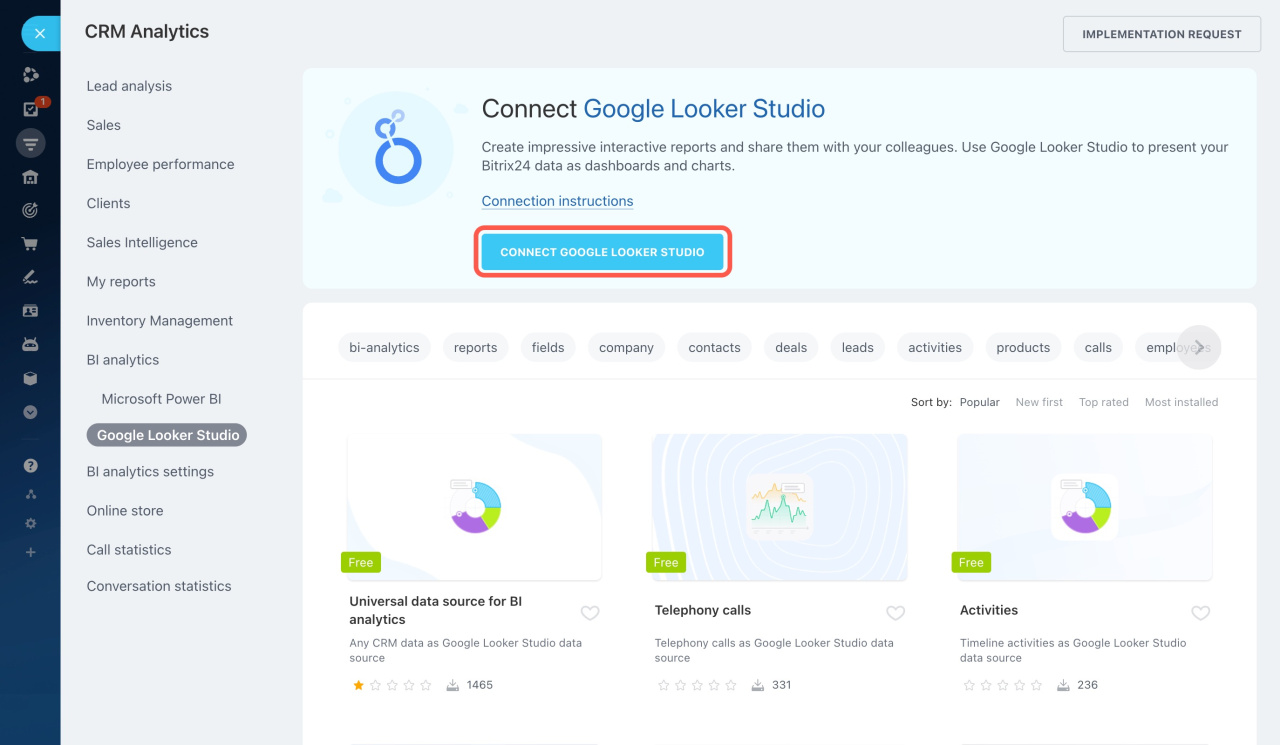
Looker Studio opens in a new tab.
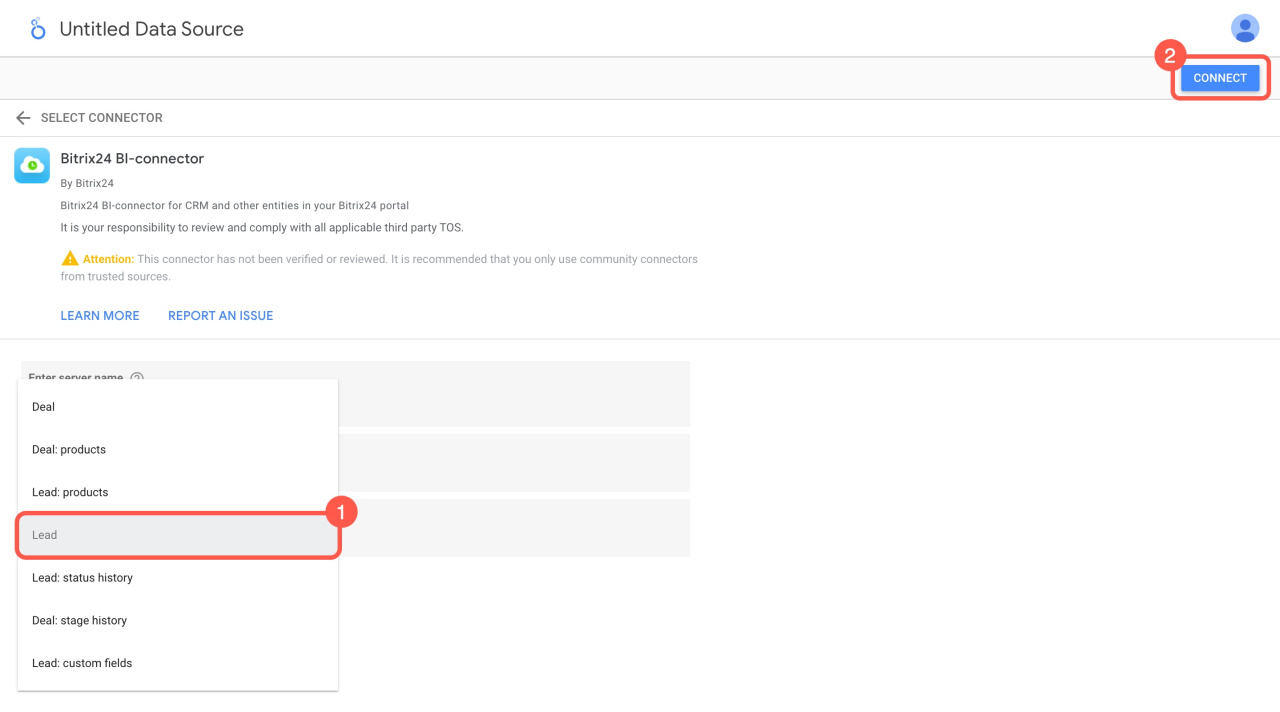
- Select Leads as the data source.
-
Click Connect.
Description of entity fields in BI Analytics - Review the available fields and click Create report.
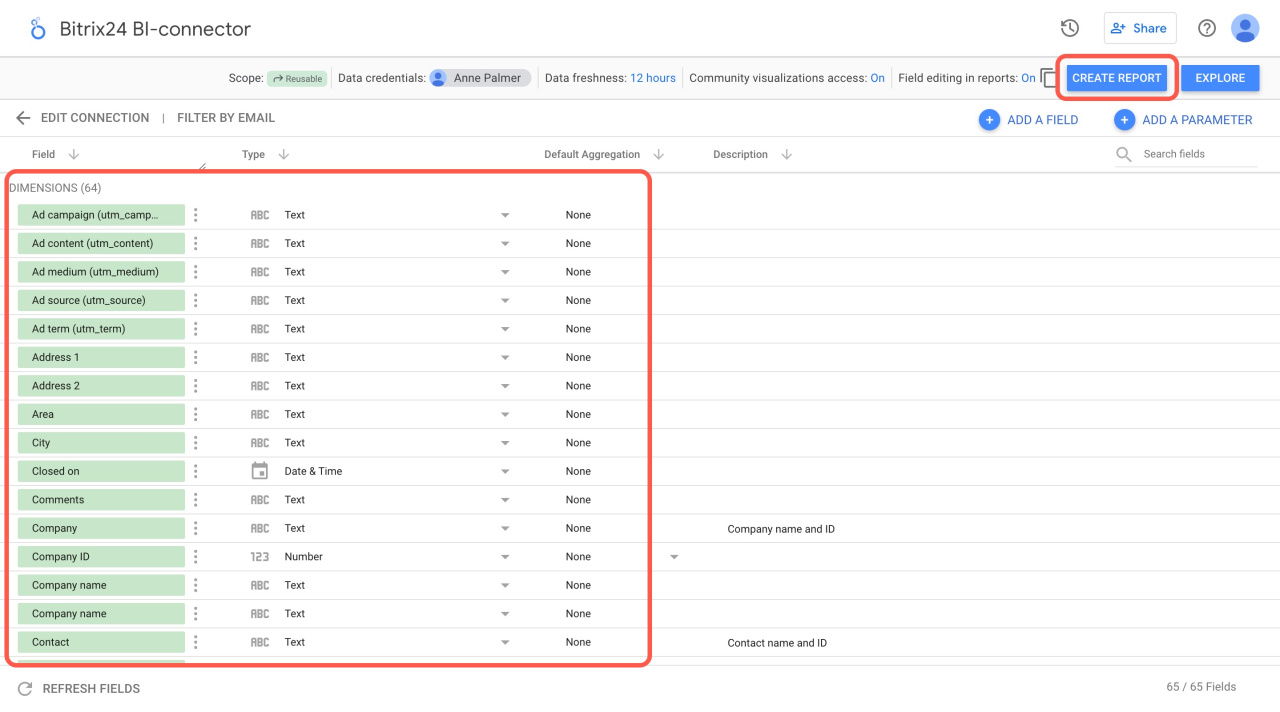
If some fields are missing, blend data from multiple sources.
Blend data sources in Google Looker Studio reportsThe report opens in a new tab.
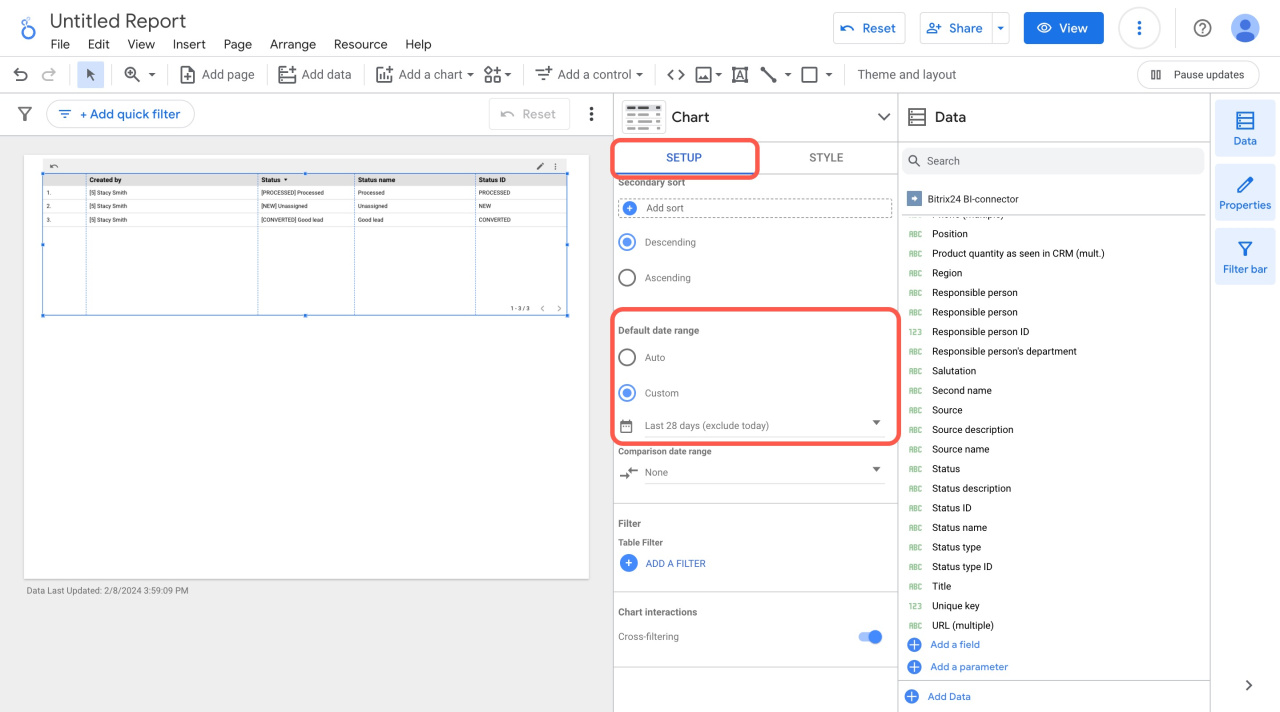
- In the Setup tab, select the date range.
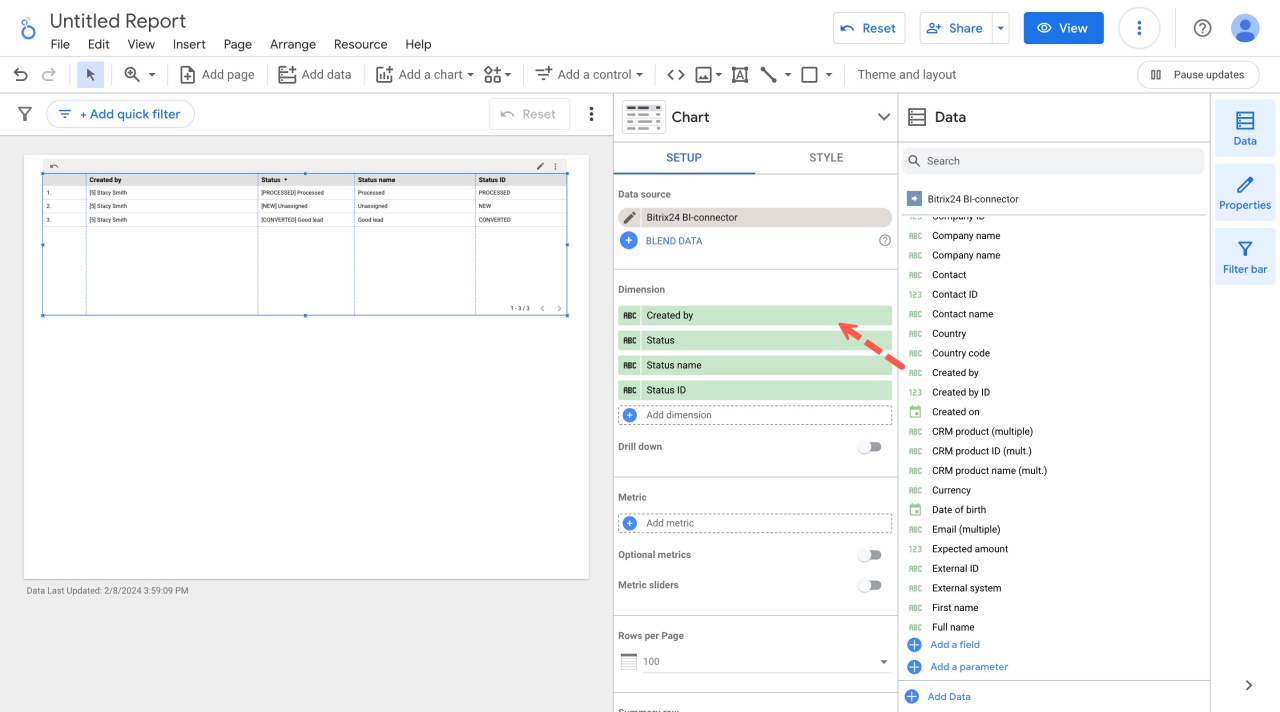
- Drag the required fields from the Data section to the Dimensions block.
For example:
- Created by
- Status
- Status name
- Status ID
The table displays lead creators, totals, and statuses.
Add a filter to a report
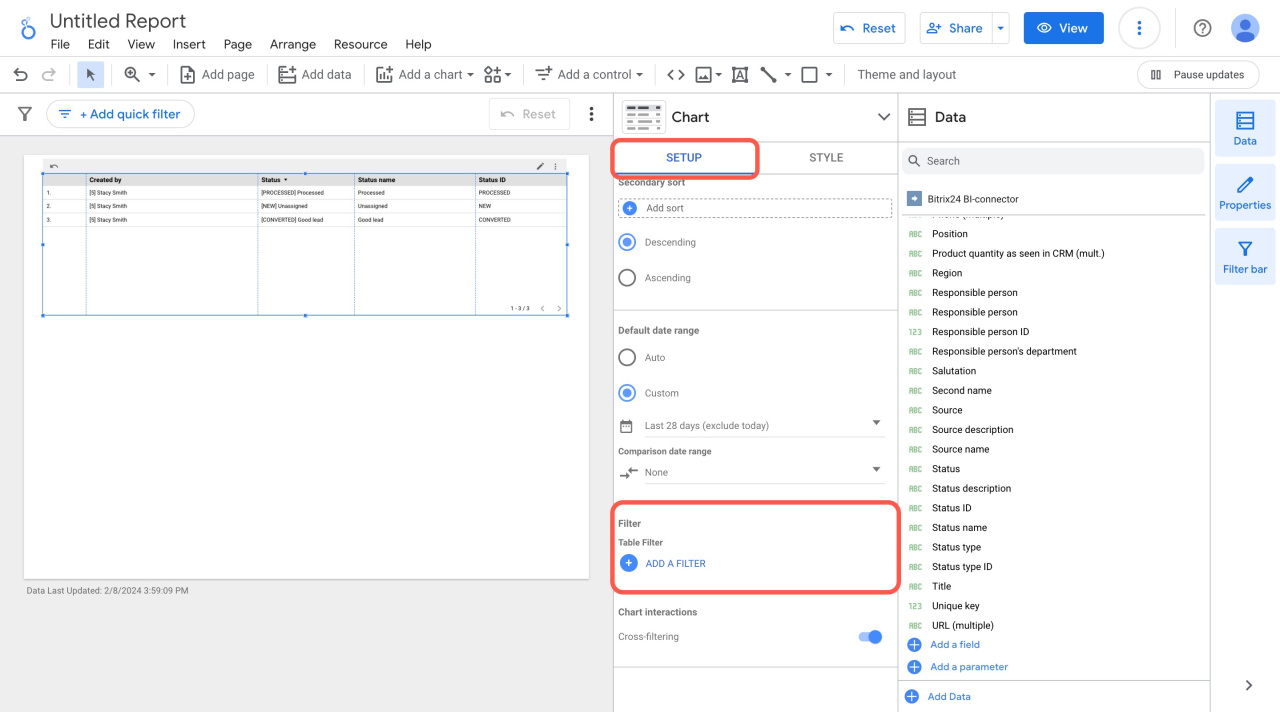
- Open the Setup tab.
- Click Add a filter.
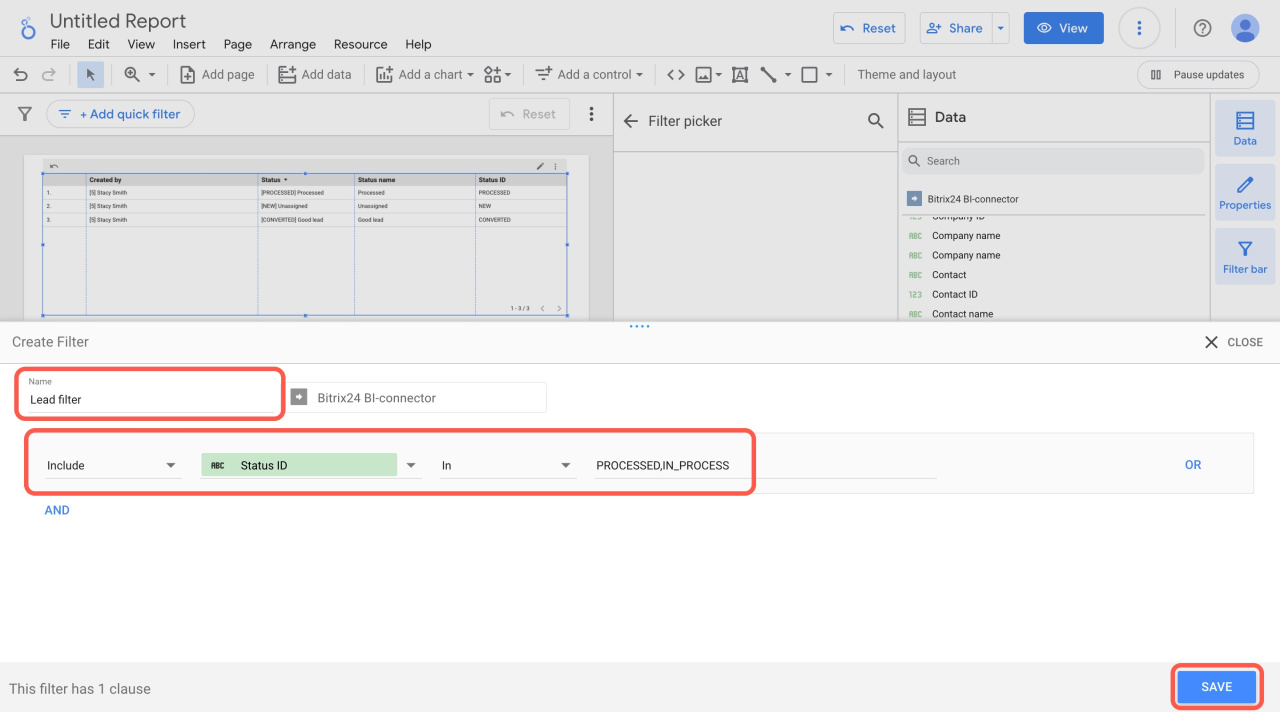
- Enter the filter name.
-
Configure the filter conditions:
- Select the Status ID field.
- Specify the
PROCESSEDandIN_PROCESSstatuses.
- Click Save.
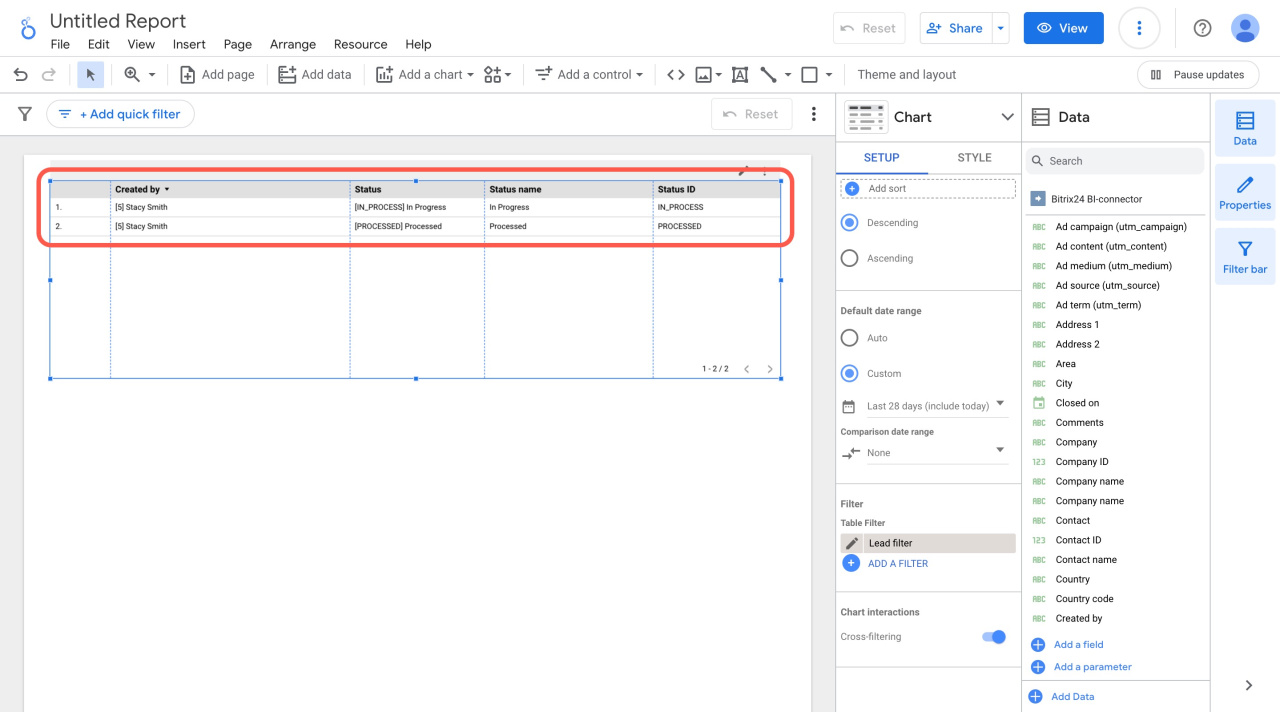
The report now displays only processed leads and leads that are in progress.
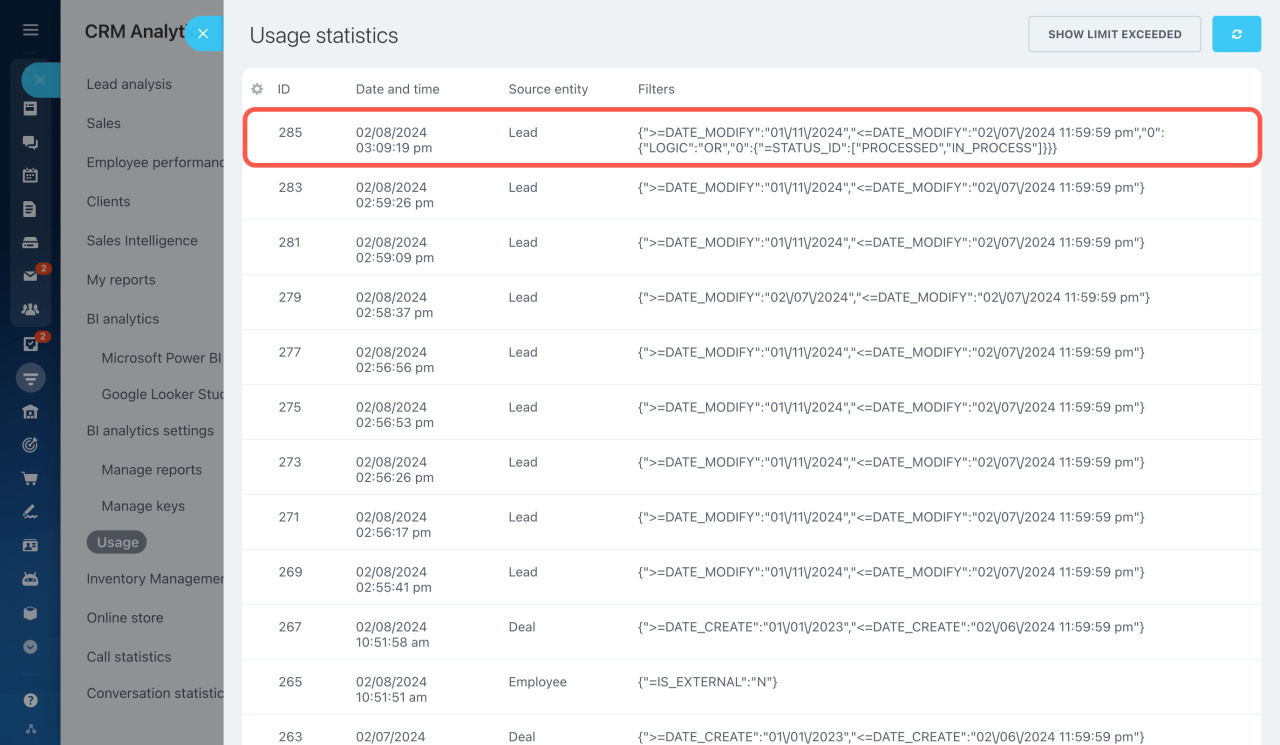
Check applied filters in Bitrix24
You can check which filters are used in your reports.
Go to CRM > Analytics > BI analytics > BI analytics settings > Usage.
This section shows:
- Query results
- Usage statistics
- Data sources
In brief
- The OR filter in Looker Studio displays data that matches at least one condition.
- To add a filter, open a report, go to the Setup tab, and click Add a filter.
- Configure the conditions to filter your leads.
- To check which filters are applied to reports, go to CRM > Analytics > BI analytics > BI analytics settings > Usage.